

 PDF
PDF ePub
ePub Citation
 Print
Print


INTRODUCTION
Hepatocellular carcinoma (HCC) is the most common primary malignant tumor of the liver. Although surgical resection and liver transplantation are potentially curative, only a small number of patients are candidates for surgery at the time of diagnosis due to advanced stage of HCC, poor liver function, or organ donor shortage (12). In non-operable HCC cases, several non-surgical treatment methods exist for HCC, including local ablation, transarterial chemoembolization or chemoinfusion, antiangiogenic drugs, and intra-arterial radiotherapy (1). Concurrent chemoradiotherapy (CCRTx) has recently been reported as an alternative option for treating locally advanced HCC that can increase patient survival (345). CCRTx can also be used to downstage HCC or to bridge therapy until liver transplantation (67).
In an era in which various treatment options are available for HCC, early prediction of treatment response can allow treatment options to be chosen or changed to fit each individual patient. Tumor microenvironments might change in response to treatment. Dynamic contrast-enhanced (DCE) imaging studies can detect these microenvironmental changes by quantitative measurement of tissue perfusion (8). According to previous studies, tumor response and survival of HCC patients treated with sorafenib and metronomic tegafur/uracil (9), sunitinib (10), transarterial chemoembolization (11), and conventional radiotherapy (12) can be predicted with DCE MRI. In CCRTx, treatment outcome depends on oxygen status of the tumor tissue and intra-tumoral vascular status including blood supply and vessel leakage that are closely related to perfusion parameters. Hence, DCE imaging studies can potentially predict treatment response in patients who undergo CCRTx.
Recently, attempts have been made to use contrast-enhanced US (CEUS) to evaluate treatment response instead of DCE MRI which is less accessible to patients due to high cost, longer scanning time, and the necessity of gadolinium contrast media administration. CEUS is more accessible with less effect on renal function than DCE MRI. Several experimental and clinical studies have evaluated the feasibility of ultrasound contrast media to predict treatment response (131415). However, most of these past studies were focused on the treatment effect of antiangiogenic drugs using qualitative or semiquantitative methods to evaluate disappearance of arterial enhancing portion or proportion changes of non-enhancing area to total cross-sectional area after treatment (141617). To the best of our knowledge, the use of quantitative methods to evaluate the feasibility of CEUS and DCE MRI in patients who undergo CCRTx has not been reported yet. Therefore, the purpose of this study was to investigate the feasibility of DCE MRI and CEUS as noninvasive biomarkers for the prediction of treatment response in patients with locally advanced HCC.
MATERIALS AND METHODS
Patients
This prospective study was approved by the institutional review board of Yonsei University College of Medicine. Informed consent was acquired from all patients. All data were handled in accordance with HIPAA compliance. Between June 2011 and March 2013, 34 patients who were first diagnosed with locally advanced HCC and for whom CCRTx was planned were consecutively enrolled in this study. Exclusion criteria were: 1) patients who had received any other prior treatment including surgery, transarterial chemoembolization, transarterial chemoinfusion, systemic chemotherapy, intra-arterial chemotherapy, antiangiogenic therapy, and local ablation such as radiofrequency ablation and cryotherapy, 2) patients with evidence of distant metastasis, 3) patients under 20 years of age, 4) patients with hypersensitivity to MRI or US contrast agents, 4) patients who were pregnant, lactating or of childbearing potential, and 5) patients with impaired renal function (eGFR < 30) or on dialysis.
Study Protocol
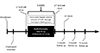
The study protocol is summarized in Figure 1. After initial screening, a chemoport was inserted via the femoral artery and an infusion catheter was placed in the common hepatic artery. CCRTx was administered for five weeks (Fig. 1). Radiotherapy with a total dose of 45 Gy was done with 25 fractions of 1.8 Gy. During radiotherapy, a concurrent continuous infusion of 5-flurouracil (5-FU) at a dose of 500 mg/m2/day was administered through the chemoport. After CCRTx, patients received hepatic arterial infusion chemotherapy with 5-FU (500 mg/m2/day for 5 hours) for three consecutive days and cisplatin (60 mg/m2/day) on day 2 of their monthly cycles for 3–12 cycles depending on tumor response (1819). DCE MRI and CEUS were performed before CCRTx was initiated (MRI1 and CEUS1) and immediately after CCRTx was completed (MRI2 and CEUS2). DCE MRI and CEUS were performed on the same day. In addition, CEUS was performed one month after CCRTx was completed (CEUS3). Afterwards, CT was usually performed every 2–3 months to evaluate tumor response. Additional imaging examinations including CT, MRI, US, and PET were performed depending on patient status. Time intervals between MRI1/CEUS1 and MRI2/CEUS2 and between MRI2/CEUS2 and CEUS3 were 32.6 ± 5.1 days and 31.8 ± 4.6 days, respectively.
MRI and CEUS Protocol
All MRI examinations were performed in a 3T system (Magnetom Trio, Siemens, Erlangen, Germany) with 6-channel body coils. First, a survey scan (HASTE; repetition time [TR]/echo time [TE], 500/95 msec; matrix, 256 × 205; slice thickness, 8 mm; slice spacing, 9.6 mm; flip angle, 2°; scanning time, 19 sec) and fat-saturated axial T2WI (turbo spon echo [TSE]; TR/TE, 2000/81 msec; matrix, 320 × 205; slice thickness, 4 mm; slice spacing, 5 mm, flip angle, 140°; scanning time; with navigation) were acquired for localization. In addition to DCE MRI, diffusion-weighted imaging (DWI) was acquired. DWI (echo planar imaging with spectral presaturation attenuated by inversion recovery; TR/TE, 6100/69 msec; matrix, 192 × 108; slice thickness, 5 mm; slice spacing, 6 mm, flip angle, 90°; with free breathing) was acquired with three b values (50, 400, 800 s/mm2). Apparent diffusion coefficient (ADC) map was automatically generated on the console using mono-exponential model. In terms of DCE MRI, dual flip angle T1WI (3D VIBE; TR/TE, 4.91/1.71 msec; matrix, 192 × 138; slice thickness, 3.6 mm; flip angle, 2° and 14.6°) was first acquired to estimate T1 map. DCE MRI (TWIST; TR/TE, 4.51/1.76 msec; matrix, 192 × 138; slice thickness, 3.6 mm; flip angle, 12°) was acquired after a bolus injection of gadodiamide (Omniscan; GE Healthcare, Oslo, Norway) at a dose of 0.1 mmol/kg (0.2 mL/kg) with an injection rate of 5 mL/sec followed by a 30 mL saline flush. Twenty slices (range, 10 cm) with an acquisition time of 0.295 sec/slice were acquired while centered on the center of the tumor in one cycle (total scanning time of one cycle, 5.9 sec). A total of 75 image sets were acquired during approximately 7–8 min.
CEUS was performed by one experienced radiologist using an ACUSON S2000 (Siemens AG, Erlangen, Germany) with a 4C1 curved transducer at contrast-specific mode (Cadence Contrast Pulse Sequence, CPS technology). Before CEUS, conventional US was performed to locate the tumor. The location of the transducer was fixed to visualize the tumor as large as possible. Contrast media (Sonovue, Bracco, Milan, Italy) was administered via the arm vein at a dose of 2.4 mL. During CEUS, patients were instructed to take shallow breaths. The mechanical index was set to 0.07. Real-time CEUS was stored as a 90-sec video clip taken after the contrast medium was injected for quantitative analysis.
Image Analysis
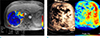
MR images were sent to a picture achieving and communication system (PACS, Centricity RA1000, GE Healthcare, Milwaukee, WI, USA). ADC values were measured on PACS. Three circular regions of interest (ROIs) were drawn within the tumor as large as possible on the ADC map and average ADC values were calculated. Quantitative DCE parameters were calculated and measured with dedicated software (Tissue 4D, Siemens, Erlangen, Germany) based on the modified Tofts model in a post-processing workstation (Leonardo, Siemens, Erlangen, Germany). At first, motion correction was performed by a non-rigid body algorithm followed by registration of the T1 map to the dynamic images. A DCE map was then generated (19). At least three ROIs were drawn around the tumor margin at different slices of the DCE map. Mean values of volume transfer constant from blood plasma to extracellular extravascular space (Ktrans, min−1), rate constant from blood plasma to extracellular extravascular space (Kep,, min−1), and extravascular extracellular volume fraction (Ve = Ktrans/Kep, %) were measured (Fig. 2a). CEUS was analyzed using dedicated software (contrast dynamics software, Siemens) installed on an ACUSON S2000. Quantitative CEUS parameters including peak enhancement (PE, %), time to peak enhancement (TTP, seconds), and mean transit time (MTT, seconds) were calculated by gamma variate processing (Fig. 2b). PE was defined as the maximum amplitude of the curve. It was calculated as the percentage of peak enhancement contrast signal to full-scale contrast signal. If the contrast image within the ROI was full white, PE was 100%. TTP was defined as the time interval between contrast media administration and peak enhancement in the ROI. MTT was defined as the average time required to reach half of the gamma-variate curve area (20). After loading and reviewing CEUS clips, circular ROIs were drawn within the tumor as large as possible. Measurements were taken at least three times. Average values of quantitative parameters were calculated.
Clinical Data Acquisition and Tumor Assessment
Clinical data including age, sex, Eastern Cooperative Oncology Group (ECOG) performance status score, etiology of chronic liver disease, tumor size, presence or absence of vessel invasion, TNM stage, Child-Pugh class, alpha-fetoprotein (AFP) level, level of protein induced by vitamin K absence/antagonist-II (PIVKA II), and retention rate of indocyanine green 15 min after administration (ICG R15) were collected from medical records. Tumors were assessed with a 3-month follow-up CT after CCRTx was completed based on Response Evaluation Criteria in Solid Tumors 1.1 (RECIST 1.1). Based on follow-up imaging taken three months after CCRTx, patients who showed partial response or stable disease were categorized into a non-progression group while patients who showed disease progression were categorized into a progression group. Progression-free survival (PFS) was defined as the interval between the date of patient enrollment and that of tumor progression. Overall survival (OS) was defined as the interval from the date of patient enrollment to death. PFS and OS were both calculated from the date of enrollment to December 31, 2016.
Statistical Analysis
Mann-Whitney U test was used for continuous variables whereas Chi-square test or Fisher's exact test was used for categorical variables to compare non-progression and progression groups. Repeated measures ANOVA or Mann-Whitney U test was used to compare differences in parameters according to acquired time. Youden index (sensitivity + specificity −1) was calculated and optimal cutoff points of variables were determined to maximize the Youden index. Sensitivity and specificity for differential diagnosis were calculated using optimal cutoff values for non-progression and progression groups. Patients were divided into the two groups using these cutoff values. PFS and OS were compared for each group using the Kaplan-Meier method with the Breslow technique. A P value of less than 0.05 was considered statistically significant.
RESULTS
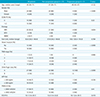
Among 34 patients, four patients were excluded (death before CCRTx completion [n = 1], administration of only palliative RTx [n = 2], and administration of transarterial chemoembolization during chemoport insertion [n = 1]). Finally, 30 patients were enrolled in this study. The mean age of these enrolled 30 patients was 55 years old (range, 28–71 years) and the sex ratio was 24:6 (M:F) (Table 1). Among these 30 patients, 25 patients were categorized into the non-progression group (partial response, n = 17; stable disease, n = 8) and the remaining five patients were categorized into the progression group. Demographics of all patients and those of the non-progression and progression groups are summarized in Table 1. There were no significant differences in age, sex, ECOG performance score, etiology of chronic liver disease, tumor size, presence of vessel invasion, TNM stage, Child-Pugh class, AFP level, or PIVKA II level between non-progression and non-progression groups (Table 1). PFS was longer in the non-progression group (mean, 716.2 days; standard error [SE], 134.6 days) than that in the progression group (mean, 84.8 days; SE, 17.2 days) (P < 0.001). OS was also significantly longer in the non-progression group (mean, 987.9 days; SE, 147.2 days) than that in the progression group (mean, 181.4 day; SE, 27.2 days, P < 0.001).
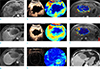
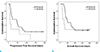
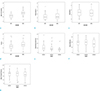
Quantitative parameters measured by MRI and CEUS are summarized in Table 2. PE1 was significantly (P = 0.002) lower in the non-progression group than that in the progression group (Fig. 3). There were no significant differences in other quantitative parameters between the two groups. On ROC analysis, with a cutoff value of 42.6%, the sensitivity and specificity for discriminating the non-progression group from the progression group was 90.9% and 100%, respectively. When patients were divided into two subgroups based on the cutoff value, patients with PE ≤ 42.6% showed better PFS (P = 0.020) and OS (P = 0.032) than patients with PE > 42.6% (Fig. 4).
In a subgroup analysis of the non-progression group, ADC values (P < 0.001) and Ve (P = 0.025) were significantly increased in MRI2 compared to those in MRI1 (Fig. 5). For CEUS parameters, there were no significant differences in PE (P = 0.055), TTP (P = 0.460), or MTT (P = 0.809) among the three CEUS examinations, although all three values continuously decreased in follow-up CEUS examinations. A subgroup analysis was not performed for the progression group because of its small number of patients.
DISCUSSION
Our results showed that treatment response could be predicted by PE on CEUS before CCRTx in patients who underwent CCRTx due to locally advanced HCC. Patients with lower PE before treatment showed better response to CCRTx compared to patients with higher PE. All DCE MRI parameters could not predict treatment response before CCRTx. On serial follow-up in the non-progression group, ADC values and Ve significantly increased after CCRTx compared to pretreatment values, whereas there were no significant changes in CEUS parameters among the three consecutive CEUS examinations.
Radiation therapy can induce cell death either by direct or indirect DNA damage or by vascular damage, resulting in changes in intratumoral microenviroment (21). A lower PE might indicate that a lower number of blood vessels within the HCC will be effectively damaged by the same radiation dose compared to HCC with high PE, resulting in worse clinical outcomes for HCC with low PE. We might also assume that hypoxia can decrease response to radiation therapy as anoxic cells are more resistant to radiation than others during radiation therapy (2223). However, very low oxygen concentrations (about 10 Torr) are enough for oxygen to act as an adequate radiation sensitizer during RTx (22). Blood flow was maintained during CCRTx and one month after CCRTx in this study, although it did show continuous decrease. Hence, tumor oxygen levels might have been maintained above 10 Torr, the minimum required for oxygen to work as a radiation sensitizer even in HCC with lower PE.
According to a previous study, blood flow to tumors is increased immediately after radiation therapy on contrast-enhanced Doppler US (24). In our study, all CEUS parameters decreased immediately after treatment and at one month after treatment with or without statistical significance. This discrepancy might be because of differences in radiotherapy methods and CEUS techniques. The previous study performed proton radiotherapy with semi-quantitative CEUS analysis using a 1st generation US contrast agent whereas our study performed CCRTx with quantitative analysis using a 2nd generation US contrast agent and contrast-specific mode.
Previous studies have determined whether DCE MRI can be used to evaluate treatment response in various tumors including HCC and reported contradictory results depending on the treatment method chosen and DEC MRI parameters evaluated (252627). Some studies reported that pretreatment DCE parameters in HCC patients who underwent radiation therapy did not significantly differ between non-progression and progression groups (1928) whereas an increased slope and peak observed within two weeks after radiotherapy was associated with better local response. These results were comparable with our study results in that initial DCE MRI parameters were not significantly different between non-progression and progression groups while Ve significantly increased after CCRTx compared to pretreatment DCE MRI. Ve is defined as the extracellular extravascular space fraction (= Ktrans/Kep) (23). After radiotherapy, Ktrans (the volume transfer constant from blood plasma to extracellular extravascular space) might increase due to loss of vessel integrity and Kep (the rate constant from extravascular extracellular space to blood plasma) might decrease due to increased extravascular extracellular space by cell death, which might result in an increase in Ve after treatment.
A higher ADC suggests lower cellularity or the presence of necrosis (19). In a study by Kim et al. (19), higher pretreatment ADC values were associated with better PFS in patients with CCRTx. These results were comparable with our study results as we found that ADC values were higher in the non-progression group than those in the progression group, although the difference between the two was not statistically significant. Furthermore, ADC values significantly increased immediately after CCRTx in the non-progression group possibly due to decreased cellularity within the HCC after treatment.
This study has several limitations. First, the number of total patients and the proportion of patients in the progression group were relatively small. Second, only a 2-dimensional evaluation of tumors was done, although three consecutive slides of MRI which included the largest tumor size were evaluated in efforts to overcome this limitation. Third, the relationship between pathology change and DCE MRI/CEUS parameters could not be determined because most patients had locally advanced HCC. They did not undergo surgery after treatment. Fourth, the number of enrolled patients was relatively small. Further studies with larger study populations are warranted in the future to investigate biomarkers that can monitor treatment response during CCRTx.
In conclusion, early treatment response and OS could be predicted by PE on CEUS before CCRTx in patients with locally advanced HCC. In addition, ADC values and Ve significantly increased after CCRTx compared to pretreatment values in the non-progression group.

 XML Download