

 PDF
PDF ePub
ePub Citation
 Print
Print


INTRODUCTION
The two types of boundary artifact on magnetic resonance (MR) imaging are chemical shift artifact and India ink artifact. The India ink artifact appears as a sharp black stripe at the fat-water interface on opposed-phase chemical shift MR image. It indicates the presence of water and fat protons in the same voxel. It occurs between macroscopic fat and non-fat portions of the body. Previous studies demonstrated its diagnostic role in a few fat-containing lesions (123).
However, India ink artifact at the boundary of small lesions may mimic signal drop by intracytoplasmic fat on opposed-phase images or obscure small lesions. In such circumstances, the India ink artifact should be reduced for proper diagnosis. Conversely, lesions containing small amount of macroscopic fat might be detected more clearly by maximizing the artifact.
Dixon techniques rely on difference in water-fat chemical shift. Following substantial improvement in phase correction and advances in post-processing techniques, several modified Dixon methods have been successfully implemented with different pulse sequences. They are insensitive to B0 heterogeneity, offering robust and signal-to-noise ratio (SNR)-efficient fat suppression even in areas with high magnetic susceptibility and in anatomic regions that are difficult to image. They also show good results in contrast-enhanced T1-weighted images. Recently, the clinical use of modified Dixon methods has increased in abdominal, breast, and spine imaging with T1-weighted and T2-weighted fat-suppressed images (456). Therefore, India ink artifact is frequently used with various pulse sequences and scanning protocols. However, the correlation between various MR parameters and India ink artifact has yet to be clearly established.
In a preliminary study using a Gimbap phantom, a Korean dish containing rice, meat, radish, and ham, we found that the thickness of India ink artifact could be changed with different MR parameters, showing that the artifact was accentuated with a short echo time (TE), large field of view (FOV), long echo train length (ETL), and thick slice (supplement). The objective of the present study was to determine the MR parameters affecting India ink artifact on opposed-phase chemical shift MR imaging in an animal model.
MATERIALS AND METHODS
Animal and MRI Protocol
This study was approved by our Institutional Animal Care and Use Committee. One female Sprague-Dawley rat weighing about 200 g was used. MR scans were conducted under general anesthesia by injecting an intraperitoneal mixture of 10 mg/kg xylazine hydrochloride (Rompun; Bayer, Leverkusen, Germany) and 10 mg/kg alfaxalone (Alfaxan; Jurox, NSW, Australia) using a 3 Tesla MR unit (Discovery MR 750; GE Healthcare, Milwaukee, WI, USA). The animal was held in a prone position in the eight-channel wrist array coil.
Axial opposed-phase images of the abdominal cavity were obtained using iterative decomposition of water and fat with echo asymmetry and least-squares estimation (IDEAL), a modified Dixon method. We carefully evaluated the images at the level of both kidneys revealing adequate retroperitoneal fat in contrast to renal parenchyma and abdominal wall. To evaluate the effects of repetition time (TR), TE, FOV, ETL, bandwidth, and slice thickness, the following MR parameters were used as shown in the Table 1: 1) Series 1 comprising different TRs (400, 2000, and 4000 ms) with TE of 10 ms, FOV of 8 cm, ETL of 2, bandwidth of 50, and slice thickness of 4 mm; 2) Series 2 comprising different TEs (10, 50, and 100 ms) with a TR of 4000 ms, FOV of 8 cm, ETL of 2, bandwidth of 50, and slice thickness of 4 mm; 3) Series 3 with different FOVs (6, 8, 16, and 24 cm) and TR of 400 ms, TE of 10 ms, ETL of 2, bandwidth of 50, and slice thickness of 4 mm; 4) Series 4 with different ETLs (2, 4, and 8) and TR of 400 ms, TE of 10 ms, FOV of 8 cm, bandwidth of 50 and slice thickness of 4 mm; 5) Series 5 containing different bandwidths (25, 50, and 85) with TR of 400 ms, TE of 10 ms, FOV of 8 cm, ETL of 2, and slice thickness of 4 mm; and 6) Series 6 showing different slice thickness (1, 2, 4, 8, and 16mm) with TR of 400 ms, TE of 10 ms, FOV of 8 cm, ETL of 2, and bandwidth of 50.
Image Analysis
India ink artifact on opposed-phase images was evaluated by two radiologists (with 1 year and 17 years of experience, respectively) based on a consensus for subjective analysis. Axial opposed-phase images at the same level were randomly distributed in each series. Observers recorded these images in the order of artifact thickness in each series. Subsequently, the MR parameters of each image were disclosed and the correlations between the image order and the parameters were determined. When the order could not be decided subjectively in each series, an altered parameter in the series was assigned as an “irrelevant” MR parameter.
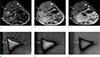
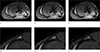
To analyze India ink artifact objectively, the artifact thickness was measured on axial opposed-phase images at the same level using Aquarius iNtuitionsoftware Ver 4.4.12 (TeraRecon, San Mateo, CA, USA) five times at the interface between the left psoas muscle and the retroperitoneal fat (Fig. 1).
Statistical Analysis
SPSS version 22 (IBM Corp., Armonk, NY, USA) was used for all statistical analyses. Spearman's correlation was performed in each series to identify the association between each MR parameter and the thickness of India ink artifact. P values < 0.05 were considered statistically significant.
RESULTS
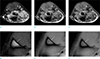
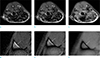
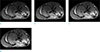
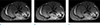
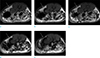
Subjective analysis revealed that the India ink artifact did not differ grossly between opposed-phased images with different TR (Fig. 2) assigned as an irrelevant MR parameter. The artifact became thicker in images with shorter TE (Fig. 3). The artifact was not different in images with FOVs of 6 cm and 8 cm. However, it was apparent in images with FOVs measuring 16 cm and 24 cm (Fig. 4). As ETL increased, the artifact appeared to increase in thickness. However, blurring also occurred along the black stripe margin (Fig. 5). Blurring with long ETL was not uniform in all directions. Bandwidth had no significant subjective effect on the artifact (Fig. 6). Bandwidth was an irrelevant MR parameter. At slice thicknesses of 1, 2, and 4 mm, artifacts did not vary grossly. However, the artifact appeared thicker in images with slice thicknesses of 8 and 16 mm (Fig. 7).
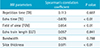
The India ink artifacts measured with different MR parameters are shown in Table 2. Objective analysis revealed that the artifact thickness showed a strong negative correlation with TE (r = -0.870, P < 0.01) but strong positive correlation with FOV (r = 0.854, P < 0.01) and slice thickness (r = 0.971, P < 0.01). However, the artifact thickness showed no statistically significant correlation with TR, ETL, or bandwidth (Table 3).
DISCUSSION
Chemical shift image, also known as in-phase and opposed-phase image, is based on differences in resonance frequency of water and fat protons. It is highly sensitive in depicting microscopic fat (123). The two-point Dixon method was initially proposed, and water-only and fat-only images were acquired via mathematical calculation usingin-phase and opposed-phase images (23). However, the two-point Dixon method was associated with several major challenges, including sensitivity to field heterogeneity, increased scan time, and degradation of image quality. The recently introduced modified Dixon methods can overcome the drawbacks of the two-point Dixon method (23). IDEAL, which is one of the modified Dixon techniques, is a three-point water-fat separation method that uses asymmetric echoes and least-squares fitting to yield the maximum possible SNR performance. The IDEAL method uses an iterative approach to estimate the field map while separating water-only and fat-only images, which can be recombined into in-phase and opposed-phase images after correction for chemical shift artifact (7). The opposed-phase images generated automatically from IDEAL image acquisition were used in this study.
Two types of boundary artifact including chemical shift and India ink artifacts occur on MR imaging. The chemical shift artifact manifests as a dark and bright band perpendicular to the frequency-encoding direction. It is attributed to spatial misregistration of fat signal (289). It can be minimized with a broader receiver bandwidth, lower field strength, and fat suppression techniques. It is also dependent on frequency-encoding direction, shape, and orientation of the fat-water interface (2, 9,10,11,12). India ink artifact, also known as type II chemical shift artifact, etching artifact, or black boundary artifact, occurs due to the presence of water and fat protons in the interfacing voxel, resulting in signal cancellation in all directions on opposed-phase chemical shift MR imaging (1,2,3). It appears as a sharp black stripe at the fat-water interface. It also reveals the presence of macroscopic fat within a mainly water-containing structure.
Clinical applications of India ink artifact include evaluation of fat-containing renal and adrenal masses (311). Kemmling et al. (12) have suggested that the uniform and continuous dark line surrounding the small intracranial lipoma on out-of-phase images facilitates the differential diagnosis of lesions that may be mistaken for thrombosed aneurysms and associated flow-related artifacts on timeof-flight MR angiography.
In addition to tissue characterization, lesion detection is also supported by this artifact in that it can reveal small amounts of fat metaplasia due to old myocardial infarction that is not adequately visualized on other sequences (13). Minor and incomplete fractures missed on simple radiographs, computed tomography (CT), and other MR sequences can be detected on opposed-phase images (14). Gokalp et al. (15) have reported that images obtained by subtracting opposed-images from in-phase images efficiently show the interface between the mass and breast tissue seen as an India ink artifact on opposed-phase images, resulting in a well-delineated margin of the mass. The chemical shift subtraction images facilitate morphologic evaluation of the breast mass, especially in fatty breasts. In these circumstances, lesions with small amount of macroscopic fat can be detected more easily by increasing the artifact.
However, the India ink artifact in small nodules or at the margin of small fatty lesions can mimic microscopic fat by appearing as a signal drop on opposed-phase images or obscure small lesions (311). For example, the artifact can mimic signal loss in small adrenal nodules. Typically, this pitfall is encountered when imaging very small adrenal nodules or when using poor resolution images (16). Small adrenal carcinoma adjacent to the retroperitoneal fat can be mistaken for adrenal adenoma. In these cases, reducing the artifact size can lead to proper diagnosis.
IDEAL techniques can be used in various MR protocols, including fat-suppressed T2-weighted images with long TR and TE, fat-suppressed T1-weighted image with short TR and TE, and fat-suppressed proton density image with long TR and short TE. The protocols vary with different TRs, TEs and bandwidths. In this study, the thickness of India ink artifact was changed with different IDEAL protocols.
India ink artifact appears on opposed-phase images regardless of the acquisition method (3). It was found on T1-weighted opposed-phase, T2-weighted opposed-phase, and proton density opposed-phase images in the present study due to chemical shift effect and T2* effect. If TE increased as in T2-weighted opposed-phase image, the difference between T2 decay and T2* decay decreased, resulting in the elimination of T2* effect on T2-weighted opposed-phase image. In the present study, the India ink artifact was increasingly apparent in sequences using shorter TE (T1-weighted opposed-phase and proton density opposed-phase images) (Fig. 1). We believe that the artifact was well-visualized with good contrast using short TE.
In large FOV and images with thick slices, the probability of coexistence of water and fat protons in the same voxel increased with larger voxel. Consequentially, the artifact became more prominent and thicker in large voxel.
Subjective analysis showed that the artifact increased with larger ETL. However, objective analysis revealed no significant statistical correlation between ETL and artifact thickness. With increased ETL, blurring occurred more along the margin of the black stripe, resulting in different outcomes of subjective analysis in this study.
This study has several limitations. First, for each parameter, only small numbers of each MR parameter were used (e.g., only 400, 2000, and 4000 ms of TR were used). These differences did not increase or decrease proportionately. However, generally used parameters were applied. Fortunately, we found statistical significance with such small number of differences for each parameter. Second, many modified Dixon methods have been introduced recently. However, not all the methods were included in this study. We hope that this study will be used in basic research to develop appropriate imaging protocols, especially for the detection of small fatty lesions. In addition, not all artifacts on opposed-phase images were measured and compared. We only evaluated the prominent artifacts. Measurement of lesser prominent portions or all artifacts may lead to slightly different results. Third, the motion of rats might influence the results. To minimize the respiratory motion, an imaging study of the animals was performed under deep anesthesia. Indeed, the thickness of India ink artifact was measured in the retroperitoneal area where the effects of respiratory motion and bowel movement are negligible. Finally, this study was conducted using a rat model without any lesion or disease. Further studies are necessary using specific pathological lesions in human body.
In conclusion, the India ink artifact was accentuated with short TE, large FOV, and increased slice thickness. Minimizing or maximizing the artifact using these parameters facilitates the detection and characterization of lesions in clinical settings.


 XML Download