

 PDF
PDF ePub
ePub Citation
 Print
Print


INTRODUCTION
Oral anticoagulants (OACs) is the mainstream therapy for the prevention of thromboembolism (TE) in patients with atrial fibrillation (AF).1)2) Although use of non-vitamin K antagonist oral anticoagulants (NOACs) have been increasing, warfarin is the most important and fundamental OACs, because of its easy availability and cost-effectiveness. In patients with non-valvular AF, most guidelines recommend warfarin titration with an international normalized ratio (INR) 2.0 to 3.0 to maintain maximal efficacy for the prevention of TE and safety for the prevention of major bleeding. Also, mean time in the therapeutic range (TTR) should be kept high as possible.
However, Japanese pharmacotherapy guidelines for AF recommend different warfarin INR target range with 2.0 to 3.0 in patients younger than 70-year-old, 1.6 to 2.6 in patients older than 70-year-old, which reflect Japanese clinical results comparing lower intensity warfarin (INR 1.6–2.6) and standard intensity warfarin (INR 2.0–3.0).3) Also, clinical trials at Hongkong and China suggested that lower intensity warfarin dose adjustment was suitable for Asian AF patients.4)5)6)7)
Those studies raised question that universal criteria with warfarin titration to INR 2.0 to 3.0 is ideal intensity in Asian AF patients, because universal criteria were almost drawn from western population, and did not consider ethnic difference. Asian patients have been known to be more vulnerable to major bleeding with OACs compared with western population.8)9)
Impact if anticoagulation intensity of warfarin in Korean AF patients remains unclear, because of limited data and population size. To identify impact of anticoagulation intensity of warfarin in Korean population, efficacy and safety were analyzed according to sub-divided warfarin INR and TTR groups in Korean non-valvular AF patients.
METHODS
Study population
A total of 2,971 patients with AF who had taken warfarin to prevent TE from January 2012 to December 2013 were initially included in a cross-sectional analysis at the Department of Neurology and Cardiology, Chonnam National University Hospital, Gwangju, Korea. A total of 710 patients (64.9±9.8 years old, 467 males) comprised the study population met both inclusion and exclusion criteria. The inclusion criteria were as follows: ≥18-year-old, CHA2DS2-VASc score ≥1, and warfarin medication as antithrombotic treatment. The criteria for exclusion included patients with valvular heart disease (mitral stenosis with more than moderate severity, prosthetic mitral valve replacement or repair), any OACs class change (from warfarin to NOACs, from NOACs to warfarin). The patients were followed for 2 years or until the first occurrence of any study outcome from the date of enrollment. Patients with follow-up loss were included in the analysis until the last follow-up period within 2 years or until the first occurrence of any study outcome from the date of enrollment. The study was approved by the ethics committee at Chonnam National University Hospital, Gwangju, Korea (CNUH-2017-078), where exempted informed consent from enrolled patients because of retrospective study protocol.
Definition
Primary efficacy end-point was TE, the composite of new-onset stroke and systemic embolism (SE). New-onset stroke was defined as the sudden onset of a focal neurologic deficit in a location consistent with the territory of a major cerebral artery and categorized as ischemic, hemorrhagic, or transient ischemic attack (TIA). SE was defined as an acute vascular occlusion of an extremity or organ, documented by means of imaging or surgery. Primary safety end-point was major bleeding, defined according to the International Society on Thrombosis and Haemostasis criteria, as clinically overt bleeding accompanied by a decrease in the hemoglobin level 2 g/dL or transfusion of at least 2 units of packed red cells, occurring at a critical site, or resulting in death. Minor bleeding was defined as clinically overt bleeding which did not meet major bleeding criteria. Primary net-clinical outcome was defined as the composite of new-onset stroke and major bleeding. Secondary net-clinical outcome was defined as the composite of new-onset stroke, major bleeding, and death.
The degree of anticoagulation was measured as INR. The intensity of anticoagulation was calculated as the mean INR value and the mean time in TTR by a modified Rosendaal method of linear interpolation between each pair of measured INR values.10) Median frequency of INR measurement was 12 (10–14) times with 49.7 days interval. The TTR1 was calculated as the portion of days with INR values between 2 and 3. The TTR2 was calculated as the portion of days with INR values between 1.6 and 2.6. The TTR3 was calculated as the portion of days with INR values between 1.6 and 2.6 in patients older than 70-year-old and between 2.0 and 3.0 in patients younger than 70-year-old. Optimal anticoagulation was defined as TTR ≥60%.11) Chronic kidney disease (CKD) was defined as an estimated glomerular filtration rate <60 mL/min obtained by using Chronic Kidney Disease Epidemiology Collaboration (CKD-EPI) equation.
Statistical analysis
For continuous variables, differences between groups were evaluated using an unpaired t-test or Mann-Whitney rank-sum test. For discrete variables, differences were expressed as counts and percentages, and were analyzed using a χ2 test or Fisher's exact between groups as appropriate. Crude incidence rate was calculated as the number of events divided by 100 person-years (percentage/year). Clinical outcomes were assessed according to TTR classified into 6 groups (<30%, 30–39.9%, 40–49.9%, 50–59.9%, 60–69.9%, ≥70%) and mean INR value classified into 5 groups (<1.6, 1.6–2.99, 2.0–2.59, 2.6–2.99, ≥3.0). Also, clinical outcomes were assessed according to dichtomous TTR and INR values. We constructed Kaplan-Meier curves for clinical outcomes and difference among the groups was assessed by log-rank test. Overall statistical difference was measured by pooled over strata method, whereas statistical difference between each group was analyzed by pairwise over-strata method. Cox proportional hazards regression was used to analyze hazard ratios (HRs) as estimates for clinical outcomes. We controlled for baseline clinical characteristics and CHA2DS2-VASc score in regression analysis. All potentially relevant variables included: age, sex, hypertension, diabetes mellitus, previous history of myocardial infarction (MI), heart failure, and stroke or TIA, malignancy, CKD and CHA2DS2-VASc score. All statistical analyses were performed using SPSS 21.0 (Statistical Package for the Social Sciences; SPSS-PC Inc, Chicago, IL, USA). All analyses were 2-tailed, with clinical significance defined as values of p<0.05.
RESULTS
Baseline clinical characteristics
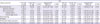
There was no difference in gender, age, prevalence of hypertension, smoking, previous history of malignancy, MI, HF, TIA/stroke, and CKD among the 5 INR groups. Also, mean value of CHA2DS2-VASc score and creatinine clearance were not different among the 5 INR groups. However, the prevalence of diabetes mellitus was different among the 5 INR groups (34.9% vs. 18.0% vs. 19.6% vs. 6.8% vs. 19.0%, p=0.011) (Table 1).
Table 1
Baseline clinical characteristics
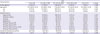
Values are presented as number (%) or mean±standard deviation.
CKD = chronic kidney disease; HF = heart failure; INR = international normalized ratio; MI = myocardial infarction; TIA = transient ischemic attack.
*Comparison made using χ2 test; †Median (25% to 75% percentiles), comparison made using Mann-Whitney test.
Clinical outcomes according to international normalized ratio groups
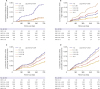
Annual incidence of TE was 1.8%, whereas that of major bleeding was 2.2%. Incidence rate of TE (12.9%/yr vs. 2.1%/yr vs. 3.0%/yr vs. 3.4%/yr vs. 0%/yr, p<0.001), new-onset stroke (12.9%/yr vs. 1.4%/yr vs. 3.0%/yr vs. 3.4%/yr vs. 0%/yr, p<0.001) and embolic stroke (11.3%/yr vs. 1.1%/yr vs. 2.6%/yr vs. 1.1%/yr vs. 0%/yr, p<0.001) were gradually decreased as higher INR groups. In contrast, incidence of major bleeding was gradually increased as higher INR groups (7.0%/yr vs. 3.7%/yr vs. 4.3% vs. 9.4% vs. 16.3%, p=0.035, Table 2, Figure 1). In dichotomous analysis, incidence of TE was significantly decreased when mean INR value was over 1.6 (18.6% vs. 4.0%, p<0.001). Also, incidence of major bleeding was significantly increased when mean INR value was over 2.6 (5.7% vs. 13.8%, p=0.006). Primary and (16.8%/yr vs. 5.9%/yr vs. 6.8%/yr vs. 9.6%/yr vs. 13.1%/yr, p=0.037) secondary net-clinical outcome (20.5%/yr vs. 6.7%/yr vs. 7.1%/yr vs. 10.8%/yr vs. 16.3%/yr, p=0.037) were significantly different among the 5 groups (Table 2). Kaplan-Meier estimation demonstrated that cumulative incidences of the TE (log-rank p<0.001; Figure 2A), major bleeding (log-rank p=0.035; Figure 2B), primary (log-rank p=0.037, Figure 2C) and secondary net-clinical outcome (log-rank p=0.003, Figure 2D) were significantly different among the 5 different INR groups. Cumulative incidence of TE was significantly higher in patients with INR <1.6. Cumulative incidences of major bleeding, primary net-clinical outcome and secondary net-clinical outcome were lowest in patient with INR 1.6–1.99 and INR 2.0–2.59. Because cumulative incidences of major bleeding, primary net-clinical outcome and secondary net-clinical outcome between the patients with INR 1.6–1.99 and INR 2.0–2.59 was almost similar, both groups were entered into dichotomous group analysis as one group.
Table 2
Clinical outcomes according to INR groups

Values are presented as number (%/yr).
INR = international normalized ratio.
*Primary net-clinical outcome was defined as the composite of new-onset stroke and major bleeding; †Secondary net-clinical outcome was defined as the composite of new-onset stroke, major bleeding and death; ‡p value by log-rank test; §p<0.01 by log-rank test, reference group as INR 1.6–1.99.
Figure 1
Adjusted HR for thromboembolism and major bleeding in relation to INR. HR of thromboembolism and major bleeding were analyzed by comparison with INR 1.6–1.99 and adjusted by CHA2DS2-VASc score, age, sex, previous history of hypertension, diabetes mellitus, myocardial infarction, stroke or transient ischemic stroke, heart failure, malignancy, and chronic kidney disease.
HR = hazard ratio; INR = international normalized ratio.
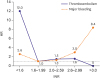
Figure 2
Kaplan-Meier estimation for the clinical outcomes according to mean INR groups. (A) Cumulative incidence of the thromboembolism according to 5 INR groups. (B) Cumulative incidence of the major bleeding according to 5 INR groups. (C) Cumulative incidence of the primary net-clinical outcome according to 5 INR groups. (D) Cumulative incidence of the secondary net-clinical outcome according to 5 INR groups.
INR = international normalized ratio.
Clinical outcomes according to international normalized ratio dichotomous groups
Baseline characteristics and clinical outcomes were analyzed by the dichotomous INR groups. There was no difference in gender, age, prevalence of hypertension, diabetes mellitus, smoking, previous history of malignancy, MI, TIA/stroke, and CKD between the patients with INR 1.6–2.6 and patients with INR <1.6 or >2.6. However, previous history of HF was more common in patients with INR 1.6–2.6. There was no difference in gender, age, prevalence of hypertension, diabetes mellitus, smoking, previous history of MI, HF, TIA/stroke, and CKD between the patients with INR 2.0–3.0 and patients with INR <2.0 or >3.0. However, previous history of malignancy was more common in patients with INR 2.0–3.0 (Supplementary Table 1). When patients were divided into the 2 groups as mean INR 1.6 to 2.6 and INR less than 1.6 or more than 2.6, patients with INR 1.6 to 2.6 had significantly lower incidence of TE (2.7%/yr vs. 6.0%/yr, log-rank p=0.022; Figure 3A), new-onset stroke (2.5%/yr vs. 6.0%, log-rank p=0.012), major bleeding (4.2%/yr vs. 9.6%/yr, log-rank p=0.006; Figure 3B), mortality (1.6%/yr vs. 4.2%/yr, log-rank p=0.029), primary net-clinical outcome (6.5%/yr vs. 12.6%/yr, log rank p=0.008; Figure 3C) and secondary net-clinical outcome (7.0%/yr vs. 14.9%/yr, log-rank p=0.001; Figure 3D) compared with patients with mean INR less than 1.6 or more than 2.6 (Table 3). When patients were divided into the 2 groups as mean INR 2.0 to 3.0 and INR less than 2.0 or more than 3.0, there was no difference in the incidence of TE, SE, new-onset stroke, embolic stroke, hemorrhagic stroke, major bleeding, mortality, primary net-clinical outcome and secondary net-clinical outcome (Figure 3, Table 3).
Figure 3
Kaplan-Meier estimation for the clinical outcomes according to dichotomous INR groups. (A) Cumulative incidence of the thromboembolism according to dichotomous INR groups. (B) Cumulative incidence of the major bleeding according to dichotomous INR groups. (C) Cumulative incidence of the primary net-clinical outcome according to dichotomous INR groups. (D) Cumulative incidence of the secondary net-clinical outcome according to dichotomous INR groups.
INR = international normalized ratio.
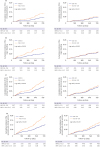
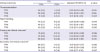
Table 3
Clinical outcomes according to INR dichotomous groups
Values are presented as number (%/yr).
CI = confidence interval; HR = hazard ratio; INR = international normalized ratio.
*Primary net-clinical outcome was defined as the composite of new-onset stroke and major bleeding; †Secondary net-clinical outcome was defined as the composite of new-onset stroke, major bleeding and death; ‡p value by log-rank test; §Each clinical outcome was adjusted by CHA2DS2-VASc score, age, sex, previous history of hypertension, diabetes mellitus, myocardial infarction, stroke or transient ischemic stroke, heart failure, malignancy, and chronic kidney disease.
Independent impact of INR intensity as 1.6–2.6 and 2.0–3.0 on the clinical outcomes were analyzed after co-variate adjustment in Cox model. Mean INR 1.6 to 2.6 was significantly associated with the reduced risk of TE (adjusted HR, 0.40; 95% confidence interval [CI], 0.19–0.85), new-onset stroke (HR, 0.36; 95% CI, 0.17–0.77), major bleeding (HR, 0.43; 95% CI, 0.23–0.81), mortality (HR, 0.35; 95% CI, 0.14–0.92), primary (HR, 0.50; 95% CI, 0.29–0.84) and secondary net-clinical outcome (HR, 0.45; 95% CI, 0.28–0.74). However, mean INR 2.0 to 3.0 was not associated with the risk reduction of TE, new-onset stroke, major bleeding, mortality, primary and secondary net-clinical outcome (Table 3).
Clinical outcomes according to therapeutic range
Clinical outcomes were analyzed by the 6 different TTR groups. By the analysis based on TTR1, there was no difference in the incidence of TE, SE, new-onset stroke, embolic stroke, hemorrhagic stroke, major bleeding, mortality, primary net-clinical outcome and secondary net-clinical outcome among the 6 different TTR groups. By the analysis based on TTR2 and TTR 3, there was no difference in the incidence of TE, SE, new-onset stroke, embolic stroke, hemorrhagic stroke, major bleeding, mortality and primary net-clinical outcome among the 6 different TTR groups. However, incidence of the secondary net-clinical outcome was significantly different among the 6 different TTR2 groups (9.3%/yr vs. 15.9%/yr vs. 7.5%/yr vs. 9.9%/yr vs. 7.6%/yr vs. 4.9%/yr, p=0.012) and TTR 3 groups (10.8%/yr vs. 12.5%/yr vs. 6.9%/yr vs. 8.6%/yr vs. 6.6%/yr vs. 3.8%/yr, p=0.031) (Supplementary Table 2).
Clinical outcomes according to therapeutic range dichotomous groups
Adjusted clinical outcomes were analyzed by the dichotomous TTR groups as 70%. All of 3 TTR system with ≥70% was not associated with the risk reduction of TE. However, all of TTR system with ≥70% was associated with the reduced risk of major bleeding (TTR1: HR, 0.36, 95% CI, 0.08–0.98; TTR2: HR, 0.43, 95% CI, 0.19–0.97; TTR3: HR, 0.32, 95% CI, 0.11–0.89). All of TTR system with ≥70% was associated with the reduced risk of primary net-clinical outcome (TTR1: HR, 0.20, 95% CI, 0.05–0.82; TTR2: HR, 0.53, 95% CI, 0.28–0.92; TTR3: HR, 0.40, 95% CI, 0.19–0.85). All of TTR system with ≥70% was associated with the reduced risk of secondary net-clinical outcome (TTR1: HR, 0.19, 95% CI, 0.05–0.77; TTR2: HR, 0.49, 95% CI, 0.28–0.88; TTR3: HR, 0.36, 95% CI, 0.17–0.76) (Table 4).
Table 4
Clinical outcomes according to the time in the TTR 70%
Each clinical outcome was adjusted by CHA2DS2-VASc score, age, sex, previous history of hypertension, diabetes mellitus, myocardial infarction, stroke or transient ischemic stroke, heart failure, malignancy, and chronic kidney disease. Values are presented as number (%/yr).
CI = confidence interval; HR = hazard ratio; TTR = therapeutic range.
*Primary net-clinical outcome was defined as the composite of new-onset stroke and major bleeding; †Secondary net-clinical outcome was defined as the composite of new-onset stroke, major bleeding and death.
Clinical outcomes according to combined anticoagulation intensity with international normalized ratio and therapeutic range
Clinical outcomes satisfying both INR and TTR or not was analyzed. Satisfied INR was defined as mean INR 1.6–2.6 or mean INR 2.0–3.0. Satisfied TTR was defined as TTR ≥70%. Combined anticoagulation intensity with mean INR 1.6–2.6 or mean INR 2.0–3.0 and TTR ≥70% was classified as satisfied anticoagulation intensity. If any of above criteria is not met, they were classified as non-satisfied anticoagulation intensity. Satisfying anticoagulation intensity with mean INR 1.6–2.6 and TTR ≥70% was associated with significantly reduced risk of major bleeding (2.6% vs. 6.1%, HR, 0.43, 95% CI, 0.19–0.96, p=0.039), primary (4.6% vs. 8.7%, HR, 0.53, 95% CI, 0.29–0.96, p=0.037) and secondary net-clinical outcomes (4.9% vs. 9.7%, HR, 0.51, 95% CI, 0.29–0.91, p=0.022). However, satisfying anticoagulation intensity with mean INR 1.6–2.6 and TTR ≥70% was not associated with the risk reduction of TE. Satisfying anticoagulation intensity with mean INR 2.0–3.0 and TTR ≥70% was associated with significantly reduced risk of primary (1.9% vs. 8.2%, HR, 0.20, 95% CI, 0.05–0.83, p=0.026) and secondary net-clinical outcomes (1.9% vs. 9.1%, HR, 0.19, 95% CI, 0.05–0.77, p=0.020). However, satisfying anticoagulation intensity with mean INR 2.0–3.0 and TTR ≥70% was not associated with the risk reduction of TE and major bleeding (Table 5).
Table 5
Clinical outcomes according to international normalized ratio (INR) dichotomous groups and time in the TTR

Each clinical outcome was adjusted by CHA2DS2-VASc score, age, sex, previous history of hypertension, diabetes mellitus, myocardial infarction, stroke or transient ischemic stroke, heart failure, malignancy, and chronic kidney disease. Values are presented as number (%/yr).
*Primary net-clinical outcome was defined as the composite of new-onset stroke and major bleeding; †Secondary net-clinical outcome was defined as the composite of new-onset stroke, major bleeding and death.
DISCUSSION
Optimal intensity of anticoagulation with warfarin has been recommended from clinical trials conducted in Caucasian population, and adopted for all ethnic groups without verification at different ethnic groups.12)13)14)15)16) There is only one recommendation with the intensity of anticoagulation with warfarin for Asian population, which recommends lower anticoagulation intensity of warfarin (INR 1.6–2.6).3) However, this recommendation was derived from clinical trials which used baseline or mean INR before and after index events for analysis, which could not reflect whole status of anticoagulation.17)18) J-RHYTHM registry, newly initiated in Japan is expected to identify optimal intensity of anticoagulation.19) Therefore, this recommendation needs consolidation with more data in Asian population. To overcome those pitfalls in Asian anticoagulation guideline with warfarin, we analyzed events rates according to mean INR values and TTR during 2-year follow-up to evaluate optimal intensity of anticoagulation with warfarin in Korean population.
Most guidelines suggest INR 2.0 to 3.0 as optimal anticoagulation intensity with warfarin in non-valvular AF patients. Lowest effective TTR of warfarin INR 2.0 need re-consideration. The European Atrial Fibrillation Trial Study (EAFT) group indicated no treatment effect with warfarin INR lower than 2.0.20) However, those trials did not consider sub-specific range of warfarin INR below 2.0. They compared events rate between INR 1.0 to 1.9 and INR above 2.0. The third Stroke Prevention in Atrial Fibrillation (SPAF III) trial analyzed efficacy of warfarin in sub-divided group below 2.0, and demonstrated that patients with INR 1.5 to 1.9 had lower TE events than patients with INR below 1.5.21) Also, fundamental studies consisting current recommendation evaluated efficacy and safety of low intensity anticoagulation with warfarin INR 1.2 to 1.5, both concluded that low-intensity warfarin is highly effective for the prevention of TE without an excess risk of major bleeding.13)16) Most of clinical trials conducted in Asia suggested lowest effective TTR of warfarin INR less than 2.0. Optimal lowest effective warfarin INR was 1.6 in Japanese trials, and 1.8 in Chinese and Hongkong trials.4)5)17)18) The present study also demonstrated consistent results with Asian studies, with lowest effective anticoagulation intensity with warfarin INR as 1.6. Therefore, lowest effective TTR of warfarin INR 2.0 should be reconsidered in Korean population.
Asians have inherited increased risk of major bleeding with double risk of intracranial hemorrhage after warfarin medication compared with Caucasian.6)8)9) It had been explained by the polymorphism of certain genes, cytochrome P450 complex subunit 2C9 (CYP2C9), vitamin K epoxide reductase complex subunit 1 (VKORC1) and gamma-glutamyl carboxylase (GGCX).22) Recently, genetic differences was found between Korean and Western AF patients through genome-wide association study, which is expected to explain increased risk of bleeding with warfarin in Korean AF patients.23) According to those studies, Korean AF patients appear to require lower intensity anticoagulation with warfarin.
Risk of major bleeding significantly increased with INR more than 2.6 in the present study. A prospective trial conducted in Japan demonstrated that average prothrombin time-INR more than 2.27 was an independent risk factor for major bleeding with warfarin medication.24) A retrospective study conducted in Hongkong revealed upper effective TTR of warfarin INR as 2.4.4) A J-RHYTHM registry analysis showed that risk of major bleeding was significantly increased when warfarin INR was over 2.6.25) Another J-RHYTHM registry analysis included 7,516 non-valvular AF patient also demonstrated that effective TTR of warfarin was INR 1.6 to 2.6, which reflect different point of view from Japanese AF medication guideline.26) Those results were consistent when the analysis was confined to patients older than 70-year-old. Also, subgroup analysis from J-RHYTHM registry consisted of 407 valvular AF patients, optimal anticoagulation range with warfarin was INR 1.6 to 2.6.27) However, major bleeding in patients with INR <1.6 was higher than patients with INR 1.6–1.99 or INR 2.0–2.59 in the present study. It is possible that patients with bleeding risk maintained low INR. Actually, patients with INR <2.0 had higher prevalence of malignancy (15.1% vs. 9.2%, p=0.019), gastrointestinal cancer (5.6% vs. 2.5%, p=0.036) without differences in the prevalence of hepatobiliary tract cancer, solid organ cancer, genitourinary cancer and hematologic malignancy. Therefore, all possible risk factors including malignancy, CKD as well as age, hypertension, diabetes mellitus, previous history of stroke were entered into logistric regression analysis. Nevertheless, major bleeding was still significantly lower in patients with INR 1.6–2.6 than INR <1.6 or >2.6.
Synthesis of all of above results conducted in Asia suggest optimal anticoagulation intensity with warfarin as INR 1.6 to 2.6, consistent with the result of the present study. However, above studies did not consider mean INR values and TTR, which reflect whole status and change of anticoagulation intensity.19)25)26)27) To overcome above pitfalls, we utilized mean INR values and TTR. Then, combined anticoagulation intensity composed of mean INR and TTR was evaluated. Although satisfying mean INR 1.6–2.6 and TTR ≥70% was better to predict major bleeding than satisfying mean INR 2.0–3.0 and TTR ≥70%, the other clinical outcomes including TE, primary and secondary net-clinical outcomes were not different between the 2 groups. Therefore, it is hard to conclude that mean INR 1.6–2.6 is better than 2.0–3.0, because combined anticoagulation intensity with TTR ≥70% was similar between the 2 groups. At most, the present study can suggest that mean INR 1.6–2.6 was not inferior to mean INR 2.0–3.0. Hopefully, nationwide multicenter multi-center, prospective study comparing low intensity warfarin (INR 1.6–2.6) and standard intensity warfarin (INR 2.0–3.0) is now ongoing. After completion of prospective study, we can know that low intensity warfarin can be potential alternative to standard intensity warfarin.
Some limitations of the present study need to be addressed. First, the present study was analyzed retrospectively. Also, sample size was relatively small, which limited statistical power among each INR groups. Therefore, it could not clearly conclude what is optimal anticoagulation intensity with warfarin in Korean population. The results of the present study only suggest that mean INR 1.6–2.6 was not inferior to mean INR 2.0–3.0 in Korean population. Nonetheless, no difference of baseline clinical characteristics among INR groups, co-variate adjustment and utilization of 3 different TTR values strengthened the result of the present study. To overcome inherited pitfalls of retrospective study design, prospective, randomized trial is ongoing in Korea including 22 representing centers. Second, time interval between each INR check was relatively long. It might influence accurate estimation of TTR.
In conclusions, mean INR 1.6–2.6 was better than mean INR 2.0–3.0 for the prevention of TE and major bleeding. TTR ≥70% was associated with the reduced risk of major bleeding, primary net-clinical outcome and secondary net-clinical outcome with no difference in the risk of TE. Combined anticoagulation intensity with INR 1.6–2.6 and TTR ≥70% had similar clinical outcomes to INR 2.0–3.0 and TTR ≥70% in Korean patients with non-valvular AF.
 XML Download