

 PDF
PDF ePub
ePub Citation
 Print
Print


With the increase in obesity, non-alcoholic fatty liver disease (NAFLD) has emerged as the most common liver disease and leading cause of cryptogenic cirrhosis worldwide.12 The prevalence of NAFLD is higher in subjects with subclinical and overt hypothyroidism.3 Thyroid hormones play an important role in energy expenditure, and thyroid dysfunction is associated with obesity.456 Overt hypothyroidism and subclinical hypothyroidism (SCH) are associated with obesity and a high body mass index (BMI).4 Even in the normal range of thyroid function, there are associations among thyroid function, BMI, and fat distribution.56
However, recent studies indicated that thyroid stimulating hormone (TSH) levels could change secondary to obesity.7 Steatosis can cause cellular dysfunction when it accumulates in the nonadipose tissues of subject with obesity. For example, lipid accumulation in pancreatic betacells can cause beta-cell dysfunction.8 One study suggested that thyroid dysfunction may be associated with thyroid follicular cell steatosis and interfollicular fat accumulation.9 Furthermore, obesity could influence the hypothalamus-pituitary-thyroid (HPT) axis.1011 TSH levels are elevated in obese subjects, and this is not accompanied by circulation thyroid antibody in most cases. They suggested that SCH may not indicate true hypothyroidism.12 Thus, the casual relationship between thyroid function and obesity is controversial, and few studies have assessed the relationship between thyroid function and obesity and steatosis.131415 Therefore, the aim of our study was to investigate the effect of obesity and/or the presence of NAFLD (as a marker of steatosis in non-adipose tissue) on thyroid function.
MATERIALS AND METHODS
Study design and subjects
This study included 451 subjects who underwent a medical checkup at the health promotion center of Gyeongsang National University Hospital between 2008 and 2017. Many people undergo comprehensive health check-ups and some proportion of these individuals have a medical check-up annually or biannually. Initial data were obtained from 593 individuals who participated in comprehensive health check-ups at least four times between January 2008 and December 2017. Data from the first visit served as baseline data, and 142 subjects were excluded for the following reasons, all of which were based on data obtained at the initial visit: 1) known thyroid disease or abnormal thyroid function test (TSH > 10 mIU/L; n = 31); 2) hepatitis B or C (n = 21); 3) excess alcohol intake (> 20 g/day) (n = 78); 4) cancer history (n = 14); and 5) BMI < 18.5 kg/m2 (n = 20). Ultimately, 451 subjects (mean age: 46.8 ± 8.8 years) were enrolled in the study.
Thyroid hormone and laboratory measurements
Data were collected via self-reported questionnaires, anthropometric examinations, and laboratory tests. The questionnaires included medical history, alcohol consumption, and smoking. Anthropometric data consisted of height and weight. BMI was calculated as weight in kilograms divided by height in meters squared. Blood samples were obtained after 8 hours of overnight fasting and were used to measure fasting plasma glucose (FPG), HbA1c, total cholesterol (TC), low-density lipoprotein-cholesterol (LDL-C), high-density lipoprotein-cholesterol (HDL-C), triglycerides, aspartate aminotransferase (AST), alanine aminotransferase (ALT), gamma-glutamyltransferase (rGT), albumin, creatinine, and thyroid function. Thyroid hormones, such as T3, TSH, and free T4 were measured using chemistry luminescence immunoassay with the same company equipment (Cobas series, Roche Diagnostic, Switzerland). A Cobas 8000 (Roche, Mannheim, Germany) was used to measure blood uric acid, TC, triglyceride, HDL-C, and LDL-C levels by using the enzymatic colorimetric test method.
Non-alcoholic fatty liver disease was defined as the presence of fatty liver disease, as determined by ultrasonography, in the absence of the following: hepatitis B or hepatitis C viral infection, excessive alcohol intake (> 20 g/day), other liver disease, and medications known to cause fatty liver disease. The 451 subjects were divided into four groups: control (n = 216), subjects with obese (n = 94), subjects with NAFLD (n = 48), and subjects with obese + NAFLD (n = 93). Obesity was defined as BMI ≥ 25 kg/m2.
Definition of subclinical hypothyroidism and hypothyroidism
Subclinical hypothyroidism was defined biochemically as normal serum free T4 in the presence of elevated TSH (> 4.2 mIU/L). Overt hypothyroidism was defined as elevated TSH, usually above 10 mIU/L, with subnormal free T4.
Statistical analyses
Data are expressed as means ± SD or medians (25th – 75th percentile). Metabolic risk factors and other clinical characteristics were compared between subjects with and without SCH after follow-up. Mann-Whitney tests were used to compare continuous variables and chi-square exact tests were used to detect differences between groups. Spearman's correlation analysis was used to generate correlation coefficients between TSH levels at follow-up and other factors. Multivariate Cox proportional hazard analysis was used to estimate hazard ratios (HRs) with 95% confidence intervals (CIs) for the presence of SCH after follow-up. The presence of SCH after follow-up was compared among the four groups using HRs for SCH, as estimated by Cox's proportional hazard analysis. The time scale for the analysis was the time since the basal examination until the onset of SCH after at least 4 years of follow-up or the last follow-up visit. Statistical analyses were performed using PASW 17.0 software (SPSS, Inc., Chicago, IL, USA), and P-values < 0.05 were considered statistically significant.
RESULTS
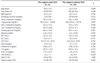
During the mean follow-up of approximately 7 years (6.8 ± 1.4 years), 42 of the 451 subjects (7.3%) had SCH after follow-up, but no subjects developed overt hypothyroidism. The baseline characteristics of subjects with and without SCH after follow-up are shown in Table 1. Subjects with SCH after follow-up had significantly higher baseline TSH levels than those with normal thyroid function. There was no significant difference in BMI or the presence of NAFLD between the two groups (Table 1).
In total, 141 of the 451 subjects (31.3%) were obese (BMI > 25 kg/m2), and 189 (41.9%) subjects had NAFLD at baseline. There was no difference between obese and non-obese subjects in baseline TSH levels (2.24 ± 0.1.39 vs. 2.01 ± 1.23, respectively, P = 0.081), free T4 levels (1.33 ± 0.22 vs. 1.32 ± 0.19 ng/d, P = 0.702), or T3 levels (111.37 ± 20.8 vs. 108.9 ± 23.2 ng/d, P = 0.255).
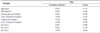
There was no difference between subjects with NAFLD and the control group in baseline TSH levels (2.14 ± 1.41 vs. 2.03 ± 1.19 mIU/L, respectively, P = 0.378), free T4 levels (1.32 ± 0.19 vs. 1.33 ± 0.20 ng/dL, P = 0.657), or T3 levels (110.95 ± 18.6 vs. 108.71 ± 24.9 ng/dL, P = 0.273). In addition, there was no correlation between TSH levels at final follow-up and age, BMI, TC, FPG, or liver enzymes (Table 2).
DISCUSSION
In this study, we investigated the effects of obesity and NAFLD on thyroid function and found that obese subjects with NAFLD had a higher risk of thyroid dysfunction than control individuals. Body composition is closely related to thyroid hormone. Thyroid hormones regulate basal metabolism and have an important role in lipid and glucose metabolism.16
Therefore, thyroid dysfunction is regarded as a cause of obesity and NAFLD.1718 Thyroid dysfunction is associated with changes in body weight and body composition. Hypothyroidism is associated with a higher BMI and SCH is linked to significant changes in body weight.15 Even in euthyroid subjects, free T4 is inversely correlated with BMI.56 However, studies describing thyroid dysfunction caused by obesity also have been reported. In one study, serum TSH levels were higher in obese patients compared with the control group.12 A study by Marzullo et al. reported that obese patients had lower free T3 levels and free T4 levels, and obesity increased susceptibility to autoimmune thyroid disease.13 However, the exact mechanism underlying the thyroid function alterations in obesity is unknown.
Several explanations for the increased TSH levels observed in obesity have been suggested. The first is that they are caused by high leptin levels, since the subjects with obesity have a high leptin level and leptin stimulates pituitary TSH secretion.11
The second explanation is that they are due to increased deiodinase activity, serving as a defense mechanism in obese subjects by counteracting fat accumulation via increased energy expenditure.19 Another theory is that systemically increased adiposity is associated with steatosis in thyroid follicular cells, which may cause or influence the development of primary thyroid failure, since thyroid steatosis occurred in obese euthyroid patients.9 However, little is known about the effects of obesity on future thyroid function. Thus, we hypothesized that obesity or NAFLD at baseline may be associated with future thyroid dysfunction. In our study, there was no difference in free T4 or T3 levels at baseline between obese and non-obese subjects, unlike the study by Marzullo et al.13 The average BMI of the subjects in Marzullo et al (42.9 kg/m2) was different to that in the current study (26.5 kg/m2), which may explain the different results.
In another study, obese subjects had moderately increased TSH levels without any thyroid disease.12 In the current study, there was no significant difference in TSH levels between the nonobese and obese groups (2.01 ± 1.24 vs. 2.24 ± 1.39, respectively; P = 0.097).
A few studies have investigated thyroid function and NAFLD. Some studies reported that TSH levels are higher in subjects with NAFLD, whereas others reported no association between TSH and NAFLD.1718 The current study also showed that there was no difference in TSH levels between subjects with NAFLD and the control group. Furthermore, BMI and the presence of NAFLD at baseline were not related to future thyroid dysfunction (Tables 3, 4). However, a higher baseline TSH was related to the development of future thyroid dysfunction. When we divided the subjects into four groups according to obesity and the presence of NAFLD, obesity with NAFLD was related to future thyroid dysfunction (Table 5). A higher baseline TSH was also related to the development of future thyroid dysfunction.
Our study had several limitations. First, all of our subjects were volunteers undergoing a comprehensive health examination. Thus, they do not represent the general population. The prevalence of obesity in the study population was 31.3% and the prevalence of NAFLD was 41.9%, both of which are higher than reported in the general population. Second, we included subjects with TSH levels < 10 mIU/L because the prevalence of thyroid dysfunction was very low when we included only patients with TSH < 4.2 mIU/L after follow-up. So we included the subjects with TSH levels < 10 mIU/L and adjusted for baseline TSH in the multivariable Cox proportional hazard analysis, and the subjects with obese and NAFLD had a higher risk for the SCH than control subjects. Further studies are needed to evaluate the effects of obesity with ectopic steatosis on thyroid function. Third, we did not check for thyroglobulin antibody and thyroid peroxidase antibodies, which are associated with autoimmune thyroid disease. Finally, we could not demonstrate thyroid steatosis, and so we used NAFLD as marker of excessive lipid accumulation in non-adipose tissues.
In conclusion, this study showed that obese subjects with NAFLD at baseline was associated with thyroid dysfunction.


 XML Download