

 PDF
PDF ePub
ePub Citation
 Print
Print


Introduction
Most patients with diabetic nephropathy have hypertension (HTN). At the time of diagnosis of diabetes mellitus (DM), the prevalence of HTN is approximately 40%; however, in patients with diabetic nephropathy, it reaches 80–90%1). The coexistence of DM and HTN increases the risk of exacerbation of the existing kidney disease and is more likely to cause target organ damage23).
The relationship among proteinuria, blood pressure (BP), and the progression of kidney disease is well known. Several studies have suggested that BP increase is associated with proteinuria aggravation and that early control of elevated BP reduces proteinuria and inhibits the progression of kidney disease45). Uncontrolled HTN not only worsens proteinuria and reduces the glomerular filtration rate (GFR), but also induces endothelial dysfunction, resulting in stiffening of the blood vessels and, eventually, target organ damage67). Thus, well-controlled BP is important for preventing or delaying the development of retinopathy, neuropathy, cardiovascular disease, and kidney disease. Several studies have attempted to determine a target BP and an ideal method for BP monitoring control89).
Office or out-of-office BP measurement is usually used for BP monitoring. The prognostic role of office-recorded BP has limitations associated with white-coat HTN and the bias of the person measuring it1011). Ambulatory BP monitoring (ABPM) performed outside office premises could reflect the individual's BP profile in his/her usual daily environment, has less bias than other measuring methods, and has a much stronger prognostic role for target organ damage; this is why ABPM is mostly recommended for BP monitoring91213). However, it is not easily applicable to use in practice because of the discomfort of wearing the BP monitor all day, particularly at night, and the possibility of inaccurate recordings during activity914).
According to a previous study that we conducted, the APrODiTe study, the systolic BP (SBP) readings at specific time-points, i.e., at 7:00 AM and 9:30 PM, were the most associated with the 24-hour mean SBP (mSBP)15). In that study, we suggested that further research is needed to evaluate if the SBP readings at these time-points have comparable associations to the 24-hour mean BP. Subsequently, through a 1-year follow-up study, we investigated whether the SBP readings at these time-points are associated with deteriorating renal function and proteinuria progression.
Methods
1. Study design and population
The Assessment of Blood Pressure Control and Target Organ Damage in Patients with Chronic Kidney Disease (CKD) and Hypertension (APrODiTe)-2 was a longitudinal study that was conducted at four centers between May 2013 and October 2015. Ninety-six patients with diabetic CKD from the APrODiTe-1 study were included in this study. These patients met the following criteria: (1) provided informed consent; (2) were aged 20–75 years who were diagnosed with CKD stage 2 (estimated GFR (eGFR) <90mL/min/1.73m2 and/or urine protein-creatinine ratio (PCR) ≥30mg/dL; (3) were diagnosed with DM and were on medication; (4) had a minimum 6-month history of HTN(or ≥3 clinic visits) and had been using antihypertensive drugs for >3 months; and (5) exhibited good compliance with medication and had no changes in medication within 2 weeks before enrollment. Patients were excluded based on the following criteria: (1) acute kidney injury and hospitalization; (2) end-stage renal disease with dialysis and/or the kidney transplantation; (3) chronic diseases, such as uncontrolled arrhythmia, uncontrolled bronchial asthma/chronic obstructive pulmonary disease, or primary endocrinological diseases except DM; (4) pregnant/lactating women; and (5) night shift workers. Data collected in the APrODiTe-2 included ambulatory BP readings and, life style questionnaires, which included smoking status, alcohol intake, exercise status, prescribed drugs, and past medical history (including coronary artery disease, heart failure, and cerebrovascular disease).
2. ABPM
Twenty-four-hour ABPMs was performed using an oscillometric TM-2430 monitor (A&D Co. Ltd, Seoul, Korea). The monitor was programmed to record the BP every 30min. The BP readings were considered appropriate if the monitor was worn continuously for 24 hours and if there were ≥16 acceptable readings between 8 AM and 10 PM(daytime) and ≥12 acceptable readings between 10 PM and 8 AM(nighttime). ABPM was repeated 1 year after the enrollment.
3. Target organ damage
The primary outcomes were the renal function deterioration and sustained proteinuria. The former was defined as decrease in eGFR equal to or greater than 5 mL/min/1.73m2/year based on the Kidney Disease: Improving Global Outcomes guidelines16). The eGFR was calculated by the Modification of Diet in Renal Disease method17). Sustained proteinuria was defined as increased random urine PCR compared with the baseline value.
4. Statistical analysis
We used Student's t test and χ2 tests to compare the baseline characteristics of patients with the 1-year follow-up data. Random urine PCR was measured in the morning. The eGFR and PCR data were skewed and were therefore log-transformed. To analyze the associations among SBPs at each time-point, the 24-hour mSBP, and the primary outcomes, correlation, linear regression, and multiple logistic regression analyses were performed. Homoskedasticity and the normality of residuals were confirmed. A collinearity diagnosis was used to correct the relationship among the SBPs at each time-point and the 24-hour mSBP. Continuous variables are expressed as means±standard deviations, and categorical variables are expressed as n (%). The p-values were two-sided and were considered significant at p<0.05. The statistical analysis was performed using SPSS 19 (SPSS, Inc., Chicago, IL).
5. Ethics statement
The present study protocol was reviewed and approved by the Institutional Review Board of the National Medical Center (H-1302/027-003), the Seoul National University College of Medicine (H-1303-016-470), the Seoul National University Boramae Medical Center (20130214/16-2013-25/031), and the Hallym University Sacred Heart Hospital (2013-I030). Informed consent was obtained from all subjects prior to enrollement.
Results
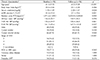
After a 1-year follow-up, the eGFR decreased (− 4.11 ±11.5mL/min/1.73m2/year, p=0.001) and the random urine PCR increased significantly (900.17±2,634.7mg/gCr/year, p=0.002). However, the SBP values at 7:00 AM and 9:30 PM, and the 24-hour mSBP showed no significant change (Table 1). The mean age of the 96 included patients was approximately 62 years, 70.8% of them were men, and the percentage of renin angiotensin aldosterone system(RAAS) inhibitor users decreased from 77.1% in the previous study to 70.8% in the current study (Table 1). When assessing the change in RAAS inhibitor use, 79.2% of patients continued to use this drug after 1 year. The SBP at 7:00 AM was associated with eGFR deterioration (odd ratio [OR]: 1.032; 95% confidence interval [CI]: 1.006–1.059; p=0.016), but not with sustained proteinuria. The SBP at 9:30 PM was not associated with any of the renal outcomes.
2. Association of the SBP at a certain time-point with eGFR deterioration
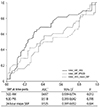
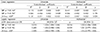
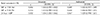
According to the correlation analysis, the SBP at 7:00 AM had a significant negative correlation with eGFR deterioration as a continuous value (r=−0.305, p=0.003); however, the SBP at 9:30 PM and the 24-hour mSBP did not show a significant correlation. In the univariate linear regression analysis, all SBP valuse (7:00 AM, 9:30 PM, and 24-hour mSBP) were associated with eGFR deterioration, but in the multivariate linear regression analysis, only the SBP at 7:00 AM and the 24-hour mSBP maintained the association (β=−0.007, p=0.011 and β=−0.007, p=0.024, respectively; Table 2). In a subgroup analysis of patients with and without eGFR reduction, the univariate logistic regression analysis showed a significant association between the SBP at 7:00 AM and the group with reduced eGFR (OR: 1.024; 95% CI: 1.005–1.044; p=0.015; Table 2). In the multivariate logistic regression analysis adjusted for age, sex, body mass index, smoking, alcohol intake, exercise, initial eGFR, initial proteinuria, RAAS inhibitor use, and dipper/non-dipper group, the SBP at 7:00 AM demonstrated a significant association with eGFR deterioration (OR: 1.032; 95% CI: 1.006–1.059; p=0.016). The 24-hours mSBP did not show any association in the univariate and multivariate logistic regression analyses. According to the receiver operating characteristic curve analysis, the SBP at 7:00 AM was superior to the other SBP values for eGFR deterioration (Fig. 1).
2. Association of the SBP at a certain time-point with sustained proteinuria
The SBP at 7:00 AM and the 24-hour mSBP were significantly correlated with sustained proteinuria in the correlation analysis (r=0.253, p=0.022 and r=0.423, p<0.001, respectively). These correlations persisted in the univariate and multivariate linear regression analyses (β=35.17, p=0.023 and β=41.13, p=0.032, respectively; Table 3). However, when logistic regression was used as a grouping based on the increased proteinuria, none of the SBP readings, including the 24-hour mSBP, showed any association with sustained proteinuria in the multivariate analysis (Table 3).
3. Association of the SBP with the renal outcomes
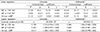
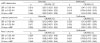
We evaluated the renal outcomes, including the groups with eGFR deterioration or sustained proteinuria, and analyzed their association with the SBPs at 7:00 AM and 9:30 PM and the 24-hour mSBP. The 24-hour mSBP was significantly associated with the renal outcomes in the univariate logistic regression analysis (OR: 1.034; 95% CI: 1.003–1.066; p=0.032). However, the multivariate logistic regression analysis did not show any association for any of the SBP values (Table 4).
4. Association between SBPs with the renal outcomes by CKD stage subgroups
We investigated whether the associations of the SBP at each time-point and the 24-hour mSBP with the eGFR deterioration and sustained proteinuria were influenced by the CKD stages. In patients with advanced CKD (stages 3, 4, and 5 without dialysis), the SBP at 7:00 AM showed a consistent association with eGFR deterioration in the multivariate logistic analyses (OR: 1.041; 95% CI: 1.010–1.073; p=0.010). For sustained proteinuria, only the 24-hour mSBP showed an association in the multivariate analyses (OR: 1.037; 95% CI: 1.002–1.073; p=0.036; Table 5). The SBP at 7:00 AM had a significant association in the univariate but not in the multivariate analysis. Patients with early stage CKD were not included in the multivariate analyses because of the small number of patients (Supplement Table 1).
Discussion
The aim of this study was to determine whether renal outcomes could be associated with the SBPs at 7:00 AM and 9:30 PM as with the 24-hour mSBP in patients with diabetic CKD. We selected patients with DM among those with CKD because DM itself affects proteinuria and renal function. Therefore, in these patients we could evaluate the association between the SBPs and renal outcomes independently, regardless of the underlying disease. In our study, we analyzed with only SBP. The diastolic BP was not significantly correlated with any outcome and patients with CKD are known to have a higher incidence of isolated systolic HTN; thus, we used only the SBP values1819).
The 24-hour mBP has been the best BP monitoring method and predictor of organ damage2021). Many studies have investigated whether home-measured and clinic-measured BP can also predict organ damage2223). However, there are controversies regarding the proper time to measure BP. Therefore, our study was planned to evaluate whether the SBP values (7 AM, 9:30 PM) from the prior study, which were mostly associated with the 24-hour mSBP and can be easily measured at home, show similar association to organ damage as that of the 24-hour mSBP.
The results showed that the SBP at night (9:30 PM) was not associated with any outcome. In contrast, the higher was the SBP at morning (7:00 AM), the lower was the eGFR. The 24-hour mSBP showed unmatched results for an association with eGFR deterioration (linear and logistic regression). This unmatched result seemed to be driven by the small number of patients. The association of the SBP at 7:00 AM and the 24-hour mSBP with sustained proteinuria showed unmatched results in the linear and logistic regression. This phenomenon could be due to the wide-variable proteinuria values and the small number of patients. Thus, we focused on the relationship between the SBP at 7:00 AM and eGFR deterioration, which showed a consistently significant association. This association could be explained with the concept of morning surge. There have been several studies wherein the morning BP was reported to affect the sympathetic tone or vascular disease more than the night BP. As a circadian rhythm, the BP rising for 2 hours after waking up in the morning is called morning surge, when the BP is higher than that in other time-periods. This occurs both in healthy and individuals with HTN and a higher morning surge contributes to the organ damage. The increasing morning BP increases the risk of micro- and macrovascular complications, particularly nephropathy in patients with DM, and could trigger cerebro-cardiovascular disease by activating the alpha-adrenergic sympathetic nervous system242526). The morning surge increases the sympathetic tone, exacerbates neuroendocrine and autonomic neuropathy, and ultimately causes glomerular hyperfiltration, hypercoagulability, hypo-fibrinolysis, and micro- and macrovascular disease272829).
In the process of measuring BP, there could be several factors that affect the mean value of the 24-hour SBP (work, exercise, emotion, etc). However, the SBP at 7:00 AM was measured in a similar environment because the night workers were excluded, and the sleeping time was similar. Thus, the authors opine that it was not coincidence that the SBP at 7:00 AM was correlated with the renal function within the concept of morning surge because the circadian variability could affect organ damage. And, between the groups with eGFR deterioration or not, the difference of 7:00 AM was only significant than other variables (Supplement Table 2). Consequently, we hypothesized that the SBP at 7:00 AM, which is the time when most people wake up and the morning surge is maintained, could be associated with eGFR deterioration as the 24-hour mSBP. In patients at late CKD stages, the association between the SBP at 7:00 AM and eGFR deterioration was significant. In advanced CKD, the activation of endothelial dysfunction, oxidative stress, vascular damage, and RAAS was more common and vascular disease occurred more often, suggesting that the SBP at 7:00 AM in patients with late-stage CKD is more relevant than that in patients with early-stage CKD63031).
The strength of our study can be found in the concept of home BP measurement. Besides the 24-hour mSBP, the SBP at a specific time-point (7:00 AM) of the day, which can be easily measured at home, is also associated with eGFR deterioration. There are studies that suggest that home BP measurement has a predictive value for organ damage; however, they do not provide any specific time-point for BP measurement1832). In this regard, this study is the first to show a specific time-point for measuring BP, and the association of this time-point SBP with renal dysfunction was not inferior to that of the 24-our mSBP.
This study has several limitations. First, the number of patients was small. Second, ABPM was performed only twice, at the study start and after 1 year. It should have been repeated 2–3 times and analyzed with the average value obtained. Third, the urine sample for proteinuria was not a collection sample during 24-hours. The first morning urine should be collected for spot urine sample; however, the sample was collected during patients' visit to the clinic. There is likely to be a variation in proteinuria values because the urine samples at baseline and at follow-up were collected only once. Furthermore, this study targeted only patients with diabetic CKD. It is necessary to evaluate whether the same result can be achieved in all patients with CKD in a better-planned study.
Although the SBP at 7:00 AM was found to be associated with renal dysfunction, there is a logical leap to evaluate the renal outcome by replacing the 24-hour mSBP, which is a well-known predictive factor, with the SBP at 7:00 AM. We only suggested that the SBP at a specific time-point was related with renal dysfunction, besides the 24-hour mSBP. A better-organized study is needed to determine whether or not the SBP at 7:00 AM is less predictive than the 24-hour mSBP for the renal outcome.
In conclusion, this study showed a persistent and significant association between the SBP at 7:00 AM and eGFR deterioration, particularly in patients with advanced CKD but not in those with early-stage CKD.
 XML Download