

 PDF
PDF ePub
ePub Citation
 Print
Print


 , Mi-Na Kim21
Abstract
Background
Methods
Results
Figures and Tables
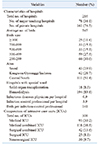
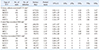
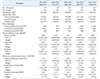
Table 1
Characteristics of hospitals and intensive care units participated in KONIS from July 2017 through June 2018
![]()
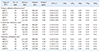
Table 2
Pooled means of healthcare-associated infection rates, by number of hospital beds, July 2017 through June 2018
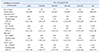
*Pooled mean=(No. of UTIs, BSIs, or PNEUs / No. of patient-days)×1,000; †Pooled mean=(No. of UTIs / No. of patient-days)×1,000; ‡Pooled mean=(No. of BSIs / No. of patient-days)×1,000; §Pooled mean=(No. of PNEUs / No. of patient-days)×1,000.
Abbreviations: UTI, urinary tract infection; BSI, bloodstream infection; PNEU, pneumonia; CI, confidence interval.
![]()
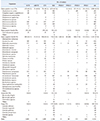
Table 3
Pooled means and percentiles of the device-associated infection rates, by number of hospital beds, July 2017 through June 2018
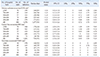
*Pooled mean=(No. of urinary catheter-associated UTIs / No. of urinary catheter-days)×1,000; †Pooled mean=(No. of central line-associated BSIs / No. of central line-days)×1,000; ‡Pooled mean=(No. of ventilator-associated PNEUs / No. of ventilator-days)×1,000.
Abbreviations: UTI, urinary tract infection; BSI, bloodstream infection; PNEU, pneumonia; CI, confidence interval.
![]()
Table 4
Pooled means and percentiles of the distribution of device-utilization ratios, by number of hospital beds, July 2017 through June 2018
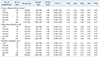
*Pooled mean=(No. of urinary catheter-days / No. of patient-days); †Pooled mean=(No. of central line-days / No. of patient-days); ‡Pooled mean=(No. of ventilator-days / No. of patient-days).
Abbreviations: UTI, urinary tract infection; BSI, bloodstream infection; PNEU, pneumonia; CI, confidence interval.
![]()
Table 5
Pooled means and percentiles of the distribution of device-associated infection rates, by type of ICU, July 2017 through June 2018
*Pooled mean=(No. of urinary catheter-associated UTIs / No. of urinary catheter-days)×1,000; †Pooled mean=(No. of central line-associated BSIs / No. of central line-days)×1,000; ‡Pooled mean=(No. of ventilator-associated PNEUs / No. of ventilator-days)×1,000.
Abbreviations: ICU, intensive care unit; MICU, medical ICU; MCICU, medical combined ICU; SCICU, surgical combined ICU; SICU, surgical ICU; NSICU, neurosurgical ICU; UTI, urinary tract infection; BSI, bloodstream infection; PNEU, pneumonia; CI, confidence interval.
![]()
Table 6
Pooled means and percentiles of the distribution of device-utilization ratios, by type of ICU, July 2017 through June 2018
*Pooled mean=(No. of urinary catheter-days / No. of patient-days); †Pooled mean=(No. of central line-days / No. of patient-days); ‡Pooled mean=(No. of ventilator-days / No. of patient-days).
Abbreviations: ICU, intensive care unit; MICU, medical ICU; MCICU, medical combined ICU; SCICU, surgical combined ICU; SICU, surgical ICU; NSICU, neurosurgical ICU; UTI, urinary tract infection; BSI, bloodstream infection; PNEU, pneumonia; CI, confidence interval.
![]()
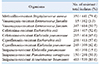
Table 7
Number (%) of microorganisms isolated from clinical specimens of patients with nosocomial infections
![]()
 XML Download