

 PDF
PDF ePub
ePub Citation
 Print
Print


INTRODUCTION
During the last decade, CT has evolved from a morphologic modality for assessing coronary arteries to a functional modality for evaluating myocardial perfusion (123). There are currently two approaches in myocardial CT perfusion imaging (CTP)-static and dynamic. Static CTP, which evaluates contrast distribution at a single time point, is easy to implement but limited in its ability to quantify myocardial blood flow (MBF) (45). Dynamic CTP, on the other hand, allows full quantification of MBF and has shown promise in accurately detecting hemodynamically significant coronary artery stenosis (678910). However, dynamic CTP techniques involve the acquisition of multiple consecutive phases and are therefore associated with higher radiation doses than are other CT scan techniques (11). Second-generation dual-source CT (2nd-DSCT) allows dynamic CTP to be performed at 80 kV with a mean effective dose of 6 mSv (12). However, coverage of the left ventricular (LV) myocardium is often incomplete under the available scan length of 7.3 cm (10).
Third-generation dual-source CT (3rd-DSCT) offers 10.5 cm of coverage, which is favorable in terms of myocardial coverage. However, it remains unclear whether 10.5 cm is sufficient to cover the entire LV myocardium. Moreover, the increased coverage results in increased radiation exposure if other conditions are kept the same. A previous phantom study of a simulated obese patient showed that 3rd-DSCT could perform coronary CT angiography (CCTA) at 70–80 kV without compromising image quality, as the system allowed a maximum tube current of 1300 mA at 70 kV (13). In comparison to the use of higher tube voltages, this approach can be expected to reduce the radiation dose in dynamic CTP at a maintained contrast-to-noise ratio (CNR) because iodinated contrast media show higher attenuation levels at lower X-ray tube voltages owing to a higher photoelectric effect and lesser Compton scattering (141516).
The purpose of this study was to compare the image quality, estimated MBF, and radiation dose of dynamic CTP between 2nd-DSCT and 3rd-DSCT and to evaluate whether the 10.5-cm z-axis coverage was adequate for dynamic CTP.
MATERIALS AND METHODS
Subjects
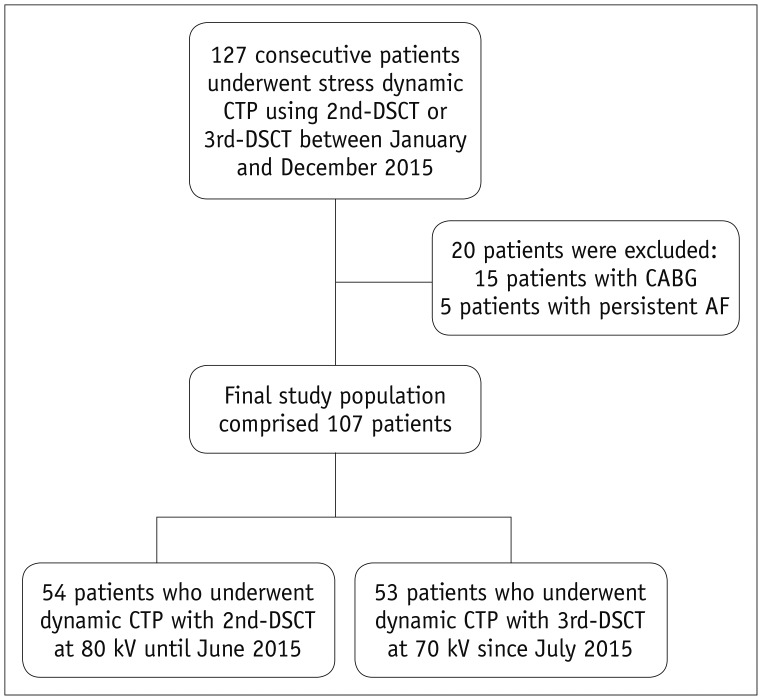
This study was approved by the Institutional Review Board, and written informed consent for participation in the study was given by each patient. This was a retrospective analysis of a prospectively registered cohort at a single center. Using the cardiac CT registry at our institution (26), we identified a total of 127 patients who had undergone stress dynamic CT using 2nd-DSCT (SOMATOM Definition Flash, Siemens Healthineers, Forchheim, Germany) or 3rd-DSCT (SOMATOM Force, Siemens Healthineers) between January and December 2015. The comprehensive CT protocol was indicated for patients who were referred for CCTA with known or suspected coronary artery disease. Patients with impaired renal function (estimated glomerular filtration rate < 30 mL/min/1.73 m2 body surface area), known allergy to iodinated contrast agent, or contraindications for adenosine were excluded from participation in the CT protocol.
Since the validity of MBF quantification in the presence of coronary artery bypass graft or persistent atrial fibrillation was unknown, patients with coronary arterial bypass graft (n = 15) and those with persistent atrial fibrillation (n = 5) were also excluded. Thus, the final study population consisted of 107 patients. Scans until June 2015 were performed with 2nd-DSCT at 80 kV (n = 54), and those since July 2015 have been performed with 3rd-DSCT at 70 kV (n = 53) (Fig. 1).
CT Protocol
The CT protocol consisted of stress dynamic CTP, followed by CCTA and delayed enhancement CT. Dynamic CTP was performed with a bolus injection of 40 mL of iopamidol (flow rate, 5 mL/s) with an iodine concentration of 370 mgI/mL (Iopamiron 370; Bayer-Schering Pharma, Berlin, Germany) followed by 20 mL of saline (flow rate, 5 mL/s). After administering adenosine triphosphate (Adetphos-L, Kowa, Nagoya, Japan) at 0.16 mg/kg/min for 3 minutes, dynamic datasets were acquired for 30 seconds in the electrocardiographically triggered mode, with the table moving forward and backward between the two positions (i.e., “shuttle mode”) (10). The z-axis coverage of 2nd-DSCT and 3rd-DSCT was 73 mm and 105 mm, respectively. For heart rates ≤ 63 beats/min, the two table positions were imaged in consecutive heartbeats. For heart rates > 63 beats/min, the other volume was covered every second heartbeat. Data were acquired at end-systole (250 ms after the R peak) with tube voltages of 80 kV and 70 kV with 2nd- and 3rd-DSCT, respectively. Tube current was determined using automatic tube current modulation (ATCM) with a quality reference of 350 mAs/rot at 120 kV for 2nd-DSCT and 300 mAs/rot at 80 kV for 3rd-DSCT, in accordance with the recommendations from the vendor.
Ten minutes after dynamic stress CTP, standard prospective CCTA covering the end-systole (250 ms after the R peak) to mid-diastole was performed at rest with the injection of 0.84 mL/kg of contrast medium over 12 seconds. Tube voltage was 2 × 100 kV or 80 kV in 2nd-DSCT and 2 × 80 kV or 70 kV, and tube current was determined using the automatic exposure control system with a quality reference of 300 mAs/rot at 120 kV in 3rd-DSCT and 350 mAs/rot at 120 kV in 2nd-DSCT. Gantry rotation time was 0.28 seconds in 2nd-DSCT and 0.25 seconds in 3rd-DSCT. Seven minutes after CCTA, end-systolic delayed-phase images were acquired without administration of any additional contrast medium by using electrocardiography-triggered axial scans at two alternating table positions (1718).
CT Data Reconstruction and Image Post-Processing
All CCTA images were reconstructed with a medium soft convolution kernel (Bv40) by using iterative reconstruction (Advanced Modeled Iterative Reconstruction level 3). Dynamic CTP images and delayed-phase images were reconstructed in the axial plane with 3-mm slice thickness and 2-mm overlap with a medium sharp convolution kernel (Qr40 with 3rd-DSCT and B23 with 2nd-DSCT) without using iterative reconstruction because the iterative reconstruction technology is currently not compatible with the cardiac shuttle mode. The axial dynamic perfusion images were then processed using syngo.CT Myocardial Perfusion (Siemens Healthineers). As previously described (19), MBF was estimated using a dedicated parametric deconvolution technique based on a 2-compartment model of intra- and extravascular spaces to fit the time-attenuation curves using Volume Perfusion software (19). The algorithm then generated an MBF map with 3-mm thickness and 2-mm overlap by applying the maximum slope approach onto a model curve fit for every voxel.
Image Analysis
To measure the degree of contrast enhancement and image noise, a 5.0-cm2 region of interest (ROI) was placed in the LV cavity on the axial dynamic CTP datasets with 5-mm slice thickness (11). Maximal enhancement was shown as the mean CT attenuation (in Hounsfield units [HU]) within the ROI at the time of peak LV enhancement. Image noise was measured as the standard deviation (SD) of CT attenuation within the ROI in the LV cavity on the first phase of dynamic CT images before the arrival of contrast medium. We also determined the CNR as follows (12):
The MBF map (3-mm thickness) obtained using Volume Perfusion software was analyzed using in-house software written on Matlab (R2017a, Mathworks, Inc., Natick, MA, USA) to obtain mean MBF values in 16 segments (17 American Heart Association segments except for the apex). MBF in the non-ischemic myocardium was defined as the average MBF of the top three segments (12). Ischemic myocardium was defined as a segment with mean MBF value 75% or less of the highest MBF value within the 16 segments on the MBF map (2), and the minimal MBF of the ischemic segments was used to represent the MBF of ischemic myocardium of the patient.
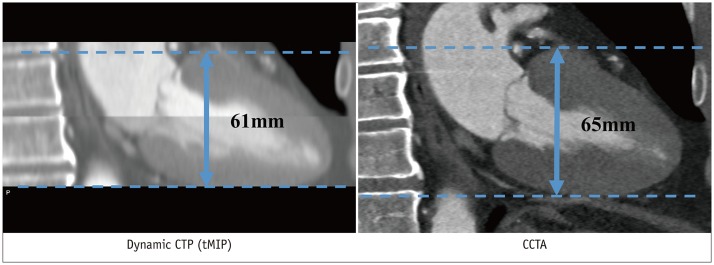
The z-axis scan length required to cover the entire LV myocardium during end-systole was measured on CCTA using the multi-planar reconstruction function. Z-axis scan coverage actually obtained by stress CTP was measured on a time maximum intensity projection, which is a by-product of MBF quantification, by using Volume Perfusion software, reflecting the maximum value for the time phase direction from the dynamic volume data; next, the percentage of z-axis coverage by dynamic CTP was calculated (Fig. 2). When 50% or more of a segment was out of the scan range, the segment was counted as a missing segment and excluded from calculation of global MBF.
Dose Estimation
Effective radiation doses were estimated by multiplying the dose-length product reported by the device by a conversion factor of 0.017 mSv/mGy·cm (20). The volumetric CT dose index (CTDIvol) was recorded for each study as reported by the scanner based on a 32-cm phantom.
Statistical Analysis
Continuous variables are expressed as the mean and SD, while categorical variables are expressed as proportions. Student's t test was used to assess differences in continuous variables after examining the normality of the data. The chi-squared test was used to assess differences in proportion between categorical variables. Values of p < 0.05 were considered indicative of statistical significance. Absolute MBF values in 2nd-DSCT and 3rd-DSCT were compared in patients after propensity score matching. The propensity score was estimated from age, gender, hypertension, dyslipidemia, diabetes mellitus, smoking, body mass index (BMI), history of myocardial infarction, and percutaneous coronary intervention. We selected pairs of patients in the two groups (1:1 matching) using a nearest-neighbor matching algorithm within a caliper of 0.25 SD of the propensity score. This scoring and matching were performed after exclusion of patients with transmural infarction (n = 16) and those with non-ischemic cardiomyopathy (n = 4). Propensity score matching was performed using the SPSS statistical package (version 23.0, IBM Corp., Armonk, NY, USA). All the other statistical analyses were performed using JMP version 10 software (SAS Institute Inc., Cary, NC, USA).
RESULTS
Subject Characteristics
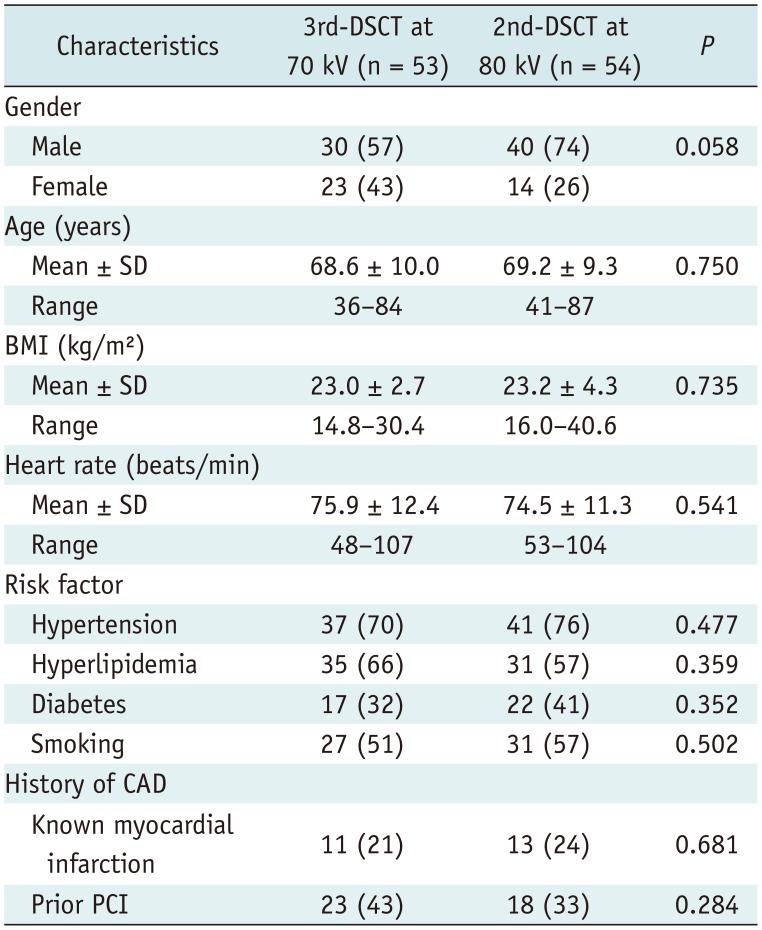
Subject characteristics are summarized in Table 1. No intergroup differences were observed with regard to gender, age, BMI, heart rate, risk factors, or medical history.
Image Quality, MBF and Myocardial Coverage
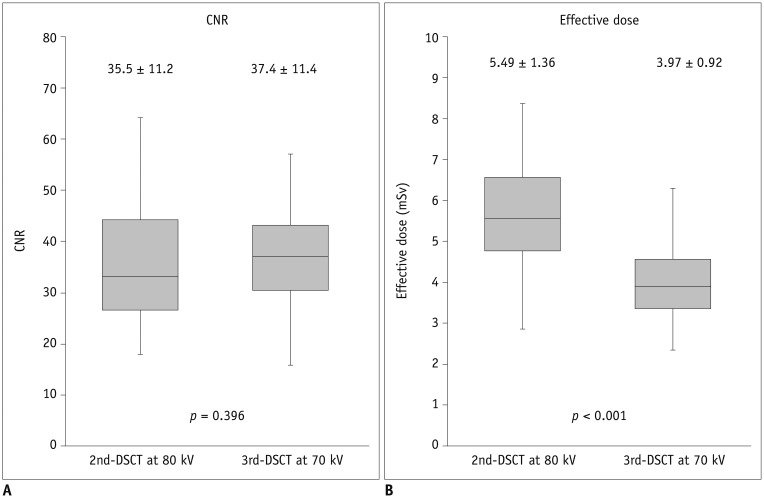
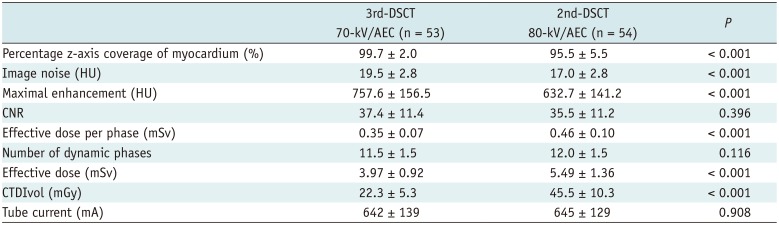
Mean image noise in the left ventricle before the arrival of the contrast bolus was significantly higher with 3rd-DSCT at 70 kV (19.5 ± 2.8 HU) than with 2nd-DSCT at 80 kV (17.0 ± 2.8 HU, p < 0.001). However, no difference in CNR was seen between 3rd-DSCT at 70 kV (37.4 ± 11.4) and 2nd-DSCT at 80 kV (35.5 ± 11.2, p = 0.396) due to the higher maximal enhancement with 3rd-DSCT at 70 kV (757.6 ± 156.5 HU) compared to that with 2nd-DSCT at 80 kV (632.7 ± 141.2 HU, p < 0.001) (Fig. 3A).
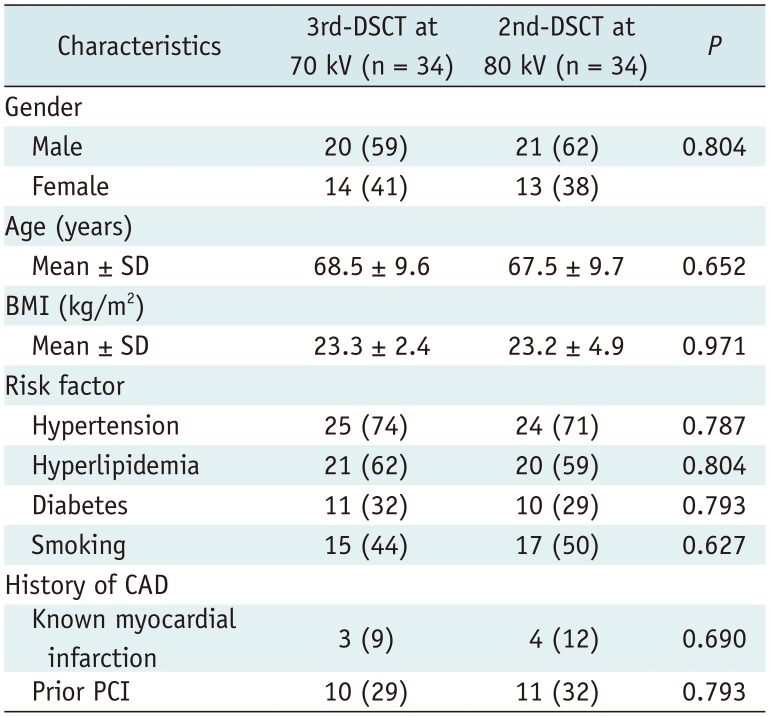
Propensity score matching yielded a total of 34 matched pairs. In these matched cohorts, there was no significant difference in any clinical factors between 3rd-DSCT and 2nd-DSCT (Table 2). Among the matched pairs, 11 patients who underwent 3rd-DSCT and 12 patients who underwent 2nd-DSCT had ischemic segments (p = 0.798). There was no significant difference between 3rd-DSCT and 2nd-DSCT in the MBF of non-ischemic (146.2 ± 26.5 vs. 157.5 ± 34.9 mL/min/100 g, p = 0.137) and ischemic myocardium (92.7 ± 21.1 vs. 90.9 ± 29.7 mL/min/100 g, p = 0.876).
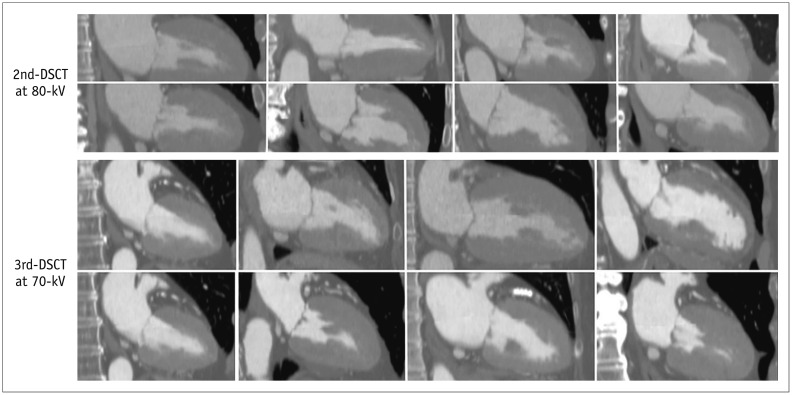
The z-axis coverage required to cover the LV myocardium measured on end-systolic CCTA was 61.6 ± 7.1 mm (range: 48–81 mm) and 62.9 ± 7.2 mm (range: 48–76 mm) in patients scanned using 3rd-DSCT and 2nd-DSCT, respectively (p = 0.349), while the z-axis length of the LV myocardium actually covered by stress dynamic CTP was 61.4 ± 7.1 mm and 59.7 ± 4.6 mm, respectively (p = 0.150). Percentage z-axis coverage of the LV myocardium was significantly higher with 3rd-DSCT (99.7 ± 2.0%) than with 2nd-DSCT (95.5 ± 5.5%, p < 0.001). Perfusion scans in 8 consecutive patients using 2nd-DSCT and 3rd-DSCT are presented in Figure 4 for comparisons of the z-axis coverage.
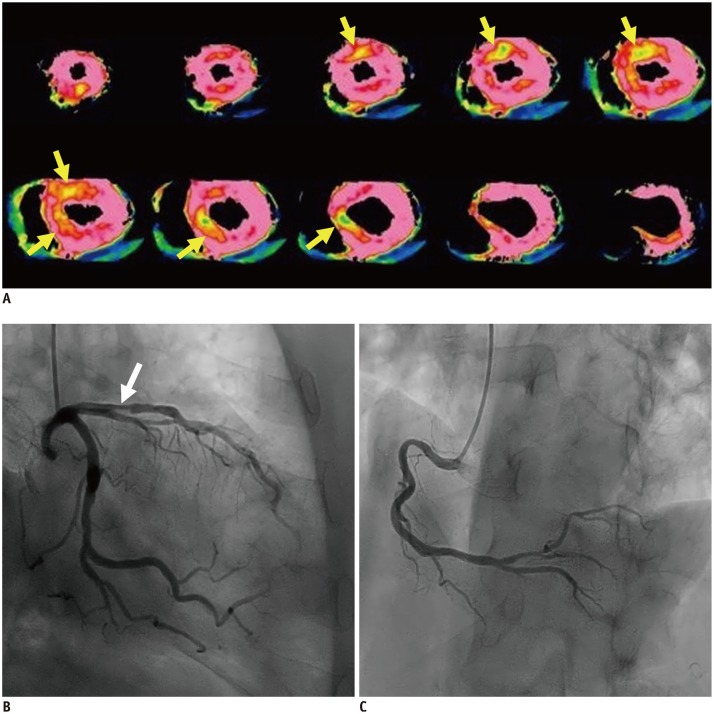
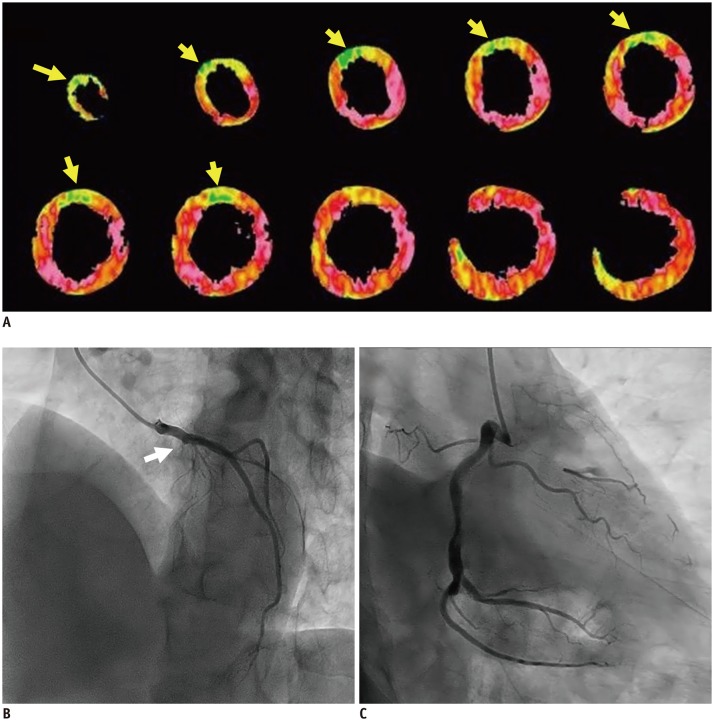
The z-axis coverage of stress CTP using 2nd-DSCT was incomplete (< 100%) in 56% of the patients (30 of 54), with partial coverage of either the anterior wall (n = 9), inferior wall (n = 10), or both (n = 11), while incomplete coverage was seen with 3rd-DSCT in only 1 patient (1/53, 1.9%, p < 0.001), involving partial coverage of the anterior wall due to difficulty in breath-holding. The number of missing segments (50% or more of the segment is outside the z-axis scan length) was 35 in 21 patients (4%, 35/864) scanned with 2nd-DSCT and 2 in 1 patient (0.2%, 2/848, p < 0.001) scanned with 3rd-DSCT. The number of missing segments per patient in 2nd-DSCT was 3 in 4 patients, 2 in 6 patients, and 1 in 11 patients. Representative dynamic CTP images with 2nd-DSCT and 3rd-DSCT are presented in Figures 5 and 6, respectively.
Radiation Dose
The number of dynamic phases did not differ significantly between 3rd-DSCT (11.5 ± 1.4) and 2nd-DSCT (12.0 ± 1.5, p = 0.116). Mean radiation dose per phase was significantly reduced with 3rd-DSCT at 70 kV (0.35 ± 0.07 mSv) in comparison with that at 2nd-DSCT at 80 kV (0.46 ± 0.10 mSv, p < 0.001). Similar results were observed for the effective dose of the entire CTP (mean, 3.97 ± 0.92 vs. 5.49 ± 1.36 mSv, respectively; p < 0.001) (Fig. 3B). On average, the effective radiation dose with 3rd-DSCT was 27.6% lower than that with 2nd-DSCT. Mean CTDIvol was 22.3 ± 5.3 mGy and 45.5 ± 10.3 mGy, respectively, for patients imaged with 3rd-DSCT at 70 kV and 2nd-DSCT at 80 kV (p < 0.001). Mean tube currents using 3rd-DSCT (642 ± 139 mA) and 2nd-DSCT (645 ± 129 mA) did not differ significantly (p = 0.908). Maximum tube current was 976 mA and 771 mA for 3rd-DSCT and 2nd-DSCT, respectively. The results are summarized in Table 3. The total radiation dose of CT examination, including CCTA and delayed enhancement, was 8.66 ± 2.52 mSv and 11.65 ± 2.29 mSv for 3rd-DSCT and 2nd-DSCT, respectively.
DISCUSSION
This study demonstrated that: 1) the z-axis coverage of 10.5 cm in 3rd-DSCT was sufficient to evaluate perfusion of the entire LV myocardium by dynamic myocardial CTP, while myocardial coverage was incomplete in 56% of patients with the coverage available in 2nd-DSCT (7.3 cm); and 2) dynamic CTP at 70 kV using 3rd-DSCT allows for a nearly 30% reduction in radiation dose despite the 50% widening of the z-axis coverage in comparison to CTP at 80 kV using 2nd-DSCT, without compromising image quality.
Dynamic CTP allows noninvasive quantification of MBF from the time-attenuation curves of both the blood pool and the myocardium, independent of the optimal selection of the data acquisition time point, and may thus allow more precise identification of the hemodynamic relevance of luminal stenosis in comparison with static CTP (10). One of the limitations of dynamic CTP has been the limited scan length along the z-axis, which may result in incomplete coverage of the LV myocardium. This study systematically evaluated whether the z-axis coverage of LV myocardium of 2nd-DSCT (7.3 cm) or 3rd-DSCT (10.5 cm) was sufficient for whole-heart dynamic CTP. A previous study reported that approximately one-third of CTP procedures performed using 2nd-DSCT resulted in incomplete coverage under the available scan length of 7.3 cm (10). We found that incomplete coverage was more frequent (involving > 50% of examinations) in 2nd-DSCT, although the risk of missing 3 segments was still low (4/54, 7.4%). With 3rd-DSCT, myocardial coverage was almost always complete, with only 1 case missing 2 segments due to difficulty in breath-holding. Although wide-detector CT with scan lengths up to 16 cm offers clear advantages in z-axis coverage (21), 10.5 cm seems sufficient to cover the entire LV myocardium in most patients, as demonstrated from the current results, and may be good enough to cover the entire coronary artery tree, potentially eliminating the need for separate acquisition of CCTA (22).
For dose reduction of dynamic CTP in this study, we used a combination of low tube voltage and ATCM. Lowering tube potential is a well-recognized strategy to reduce radiation, because radiation doses vary approximately with the square of tube voltage. Diagnostic image quality can be maintained despite the higher image noise at lower tube potentials due to the higher attenuation of iodine at low photon energies, thus increasing intravascular contrast (13). Fujita et al. (12) demonstrated that dynamic CTP imaging using 2nd-DSCT with 80 kV/370 mAs instead of 100 kV/300 mAs was associated with a 40% reduction in mean radiation dose. ATCM allows maintenance of constant image quality with reduced radiation exposure by estimating optimal tube current values from topogram data. Moreover, the tube current is fine-tuned according to the actual attenuation measured 180° earlier in the tube rotation, adjusting to the dynamic change of attenuation characteristics over time during the first-pass of contrast medium through the heart (23). Kim et al. (11) found that the use of ATCM resulted in a reduction in the mean effective radiation dose in comparison with a fixed tube current, while still providing diagnostically acceptable images.
In the current study, an even lower tube voltage (70 kV) was used together with ATCM to avoid the radiation increase inherent in wider coverage, successfully reducing radiation exposure by 30% compared to 80 kV with ATCM (3.97 ± 0.92 mSv vs. 5.49 ± 1.36 mSv, respectively). Although the image noise was always higher at 70 kV, as expected, CNR was maintained due to the higher contrast enhancement.
Some limitations must be considered when interpreting the results from the present study. First, BMI in most of the patient population was < 25 kg/m2. The applicability of 70 kV for overweight or obese patients remains unclear. However, the X-ray tube for 3rd-DSCT systems allows dynamic CTP with a maximum tube current of 1300 mA at a low-kV range (70, 80, or 90 kV) (1314), much higher than the maximum tube current actually emitted for dynamic CTP in 3rd-DSCT (976 mA) in our study population. Second, MBF values were not validated against a gold standard such 15O-H2O positron emission tomography in our study. A linear correlation between CT-derived MBF measurements and microsphere-derived MBF has been demonstrated in a porcine animal model at 100 kV (24). Theoretically, the use of 70 kV or 80 kV instead of 100 kV would not affect the quantification obtained with this technique, since the linear relationship between contrast concentration and attenuation would not be compromised with a lower tube voltage. Nonetheless, the similar estimated MBF values between 70 kV and 80 kV after propensity score matching in our study do not guarantee a homogenous quantification performance because MBF quantification can be largely affected by the physiologic response to adenosine. Lastly, we did not evaluate the incidence of artifacts such as beam-hardening, scatter, and motion on dynamic CTP with 2nd- and 3rd-DSCT.
In conclusion, the z-axis coverage of 10.5 cm in dynamic CTP was sufficient to cover the entire LV myocardium in most patients. Despite this increased coverage, dynamic CTP was successfully performed with a mean effective dose of only 3.97 mSv without compromising image quality or MBF quantification.
 XML Download