

 PDF
PDF ePub
ePub Citation
 Print
Print


INTRODUCTION
In Although childhood obesity has long been an important health issue, its prevalence has been increasing. According to a recent report, the prevalence of obesity in school-age children in Korea increased from 8.4% in 2008 to 14.3% in 2016 [1]. Moreover, childhood obesity may accompany various complications, including hyperinsulinemia, hypertension, metabolic syndrome, and nonalcoholic fatty liver disease (NAFLD) [2]. The increase in childhood obesity and its complications should be considered a severe problem as it can lead to obesity and cardiovascular complications in adulthood [3].
In addition, childhood obesity can influence height-growth patterns of children and adolescents [4]. According to several studies [45], obese children may present with accelerated skeletal maturation and advanced bone age that exceed their chronological age. Therefore, they are taller in stature and have higher height percentiles than children of normal weight during pre-puberty in the same age groups. However, during puberty, the height-growth velocity of obese children with advanced bone age gradually slowed, and their growth may stop earlier than children of normal weight in the same age group. As a result, their height percentile in adulthood could be lower than that of pre-puberty [56].
Previous studies have reported that advanced bone age was associated with body mass index (BMI) or various hormones, including sex hormones [4]. However, there have been few reports investigating advanced bone age in Korea. Furthermore, there are no reports analyzing the association between advanced bone age and the degree of obesity based on standard weight or clinical factors, including metabolic syndrome and the severity of NAFLD. The objective of our study was to evaluate the prevalence of advanced bone age in obese children and to recognize the correlation between advanced bone age and factors associated with childhood obesity.
Go to : 
MATERIALS AND METHODS
We enrolled overweight and obese children that visited the pediatric obesity clinic of Jeju National University Hospital from May to December 2015. Overweight was defined as a BMI ≥85th percentile and <95th percentile, by sex and age. Obesity was defined as a BMI ≥95th percentile, by sex and age. A total of 232 children (aged 6–15 years) were included in the study. Patients with underlying diseases that cause secondary obesity, such as congenital disease, endocrine diseases, and other diseases requiring medication were excluded.
From the medical records, factors associated with childhood obesity, including anthropometric and laboratory data, metabolic syndrome, and the degree of NAFLD, were collected. Anthropometric data included the percentiles of height, weight, weight for height, waist circumference, and systolic/diastolic blood pressure, according to the Korea National Growth Charts 2007 [7]. Hypertension was defined as a systolic or diastolic blood pressure ≥90th percentile, by sex and age. BMI was calculated as weight (kg) divided by height squared (m2) and assessed by the percentiles according to Korea National Growth Charts 2007. In addition, BMI z-score was obtained with the L (Box-Cox Power, lambda), M (Median), S (Coefficient of Variation) method, by sex and age, according to the Korea National Growth Charts 2007, which used the following formula: Z=((χM)L-1)/LS (L≠0), Z=log(χM)/S (L=0) [7]. The degree of obesity was defined as the percentage of the actual weight relative to the standard weight for that height by sex and divided into grades: overweight (10–20%), mild (20–30%), moderate (30–50%), and severe (≥50%) [8]. We classified the anthropometric data into each section according to the percentile, and divided children into the normal or advanced bone age groups in each percentile section. We analyzed the trends of the prevalence of advanced bone age according to the change in each percentile section.
[7]. The degree of obesity was defined as the percentage of the actual weight relative to the standard weight for that height by sex and divided into grades: overweight (10–20%), mild (20–30%), moderate (30–50%), and severe (≥50%) [8]. We classified the anthropometric data into each section according to the percentile, and divided children into the normal or advanced bone age groups in each percentile section. We analyzed the trends of the prevalence of advanced bone age according to the change in each percentile section.Laboratory data included the level of serum glucose, HbA1c, insulin, lipid panel, and liver function tests. Homeostatic model assessment-insulin resistance (HOMA-IR) was calculated [fasting serum insulin (μU/mL)×fasting plasma glucose (mmoL/L)/22.5] to estimate insulin resistance. Hyperinsulinemia was defined as a fasting serum insulin level of 20 μU/mL or above. Hypertriglyceridemia was defined as a fasting serum triglyceride level of 110 mg/dL or above. The degree of NAFLD was graded as no NAFLD, mild, moderate, and severe based on liver ultrasonography performed by one radiologist [9]. Metabolic syndrome was diagnosed when a patient had at least 3 of the following 6 conditions suggested by Lambert et al. [10]: 1) BMI ≥95th percentile, by sex and age; 2) blood pressure ≥90th percentile, by sex and age; and levels of 3) fasting serum triglyceride ≥110 mg/dL; 4) fasting high density lipoprotein (HDL) cholesterol ≤40 mg/dL; 5) fasting plasma glucose ≥110 mg/dL; and 6) fasting serum insulin ≥20 μU/mL. Although there are no consensus criteria for childhood metabolic syndrome, we chose the above criteria including a level of serum insulin which is a useful marker for insulin resistance [11].
Bone age was evaluated using an X-ray of the hand and wrist by one radiologist, according to the Tanner-Whitehouse III (TW3) method [12]. The mean bone age and standard deviation (SD) for the bone age of each child were measured. Advanced bone age was defined as patients who had a difference >2 SD between bone and chronological age. Children were divided into a normal or advanced bone age group. We compared the two groups and analyzed the prevalence of advanced bone age according to factors associated with childhood obesity.
Statistical analysis was performed using t-tests for continuous variables, chi-squared (χ2) tests for categorical variables and linear-by-linear association for trends using PASW Statistics for Windows, Version 18.0 (SPSS Inc., Chicago, IL, USA). A p-values<0.05 were considered statistically significant.
Go to :
RESULTS
Among 232 children, there were 183 (78.9%; 93 males and 90 females) in the normal bone age group and 49 (21.1%; 23 males and 26 females) in the advanced bone age group (Table 1). The mean age was 10.10±2.20 years and 10.11±2.03 years in the normal and advanced bone age groups, respectively. There was no significant difference in sex and age between groups.
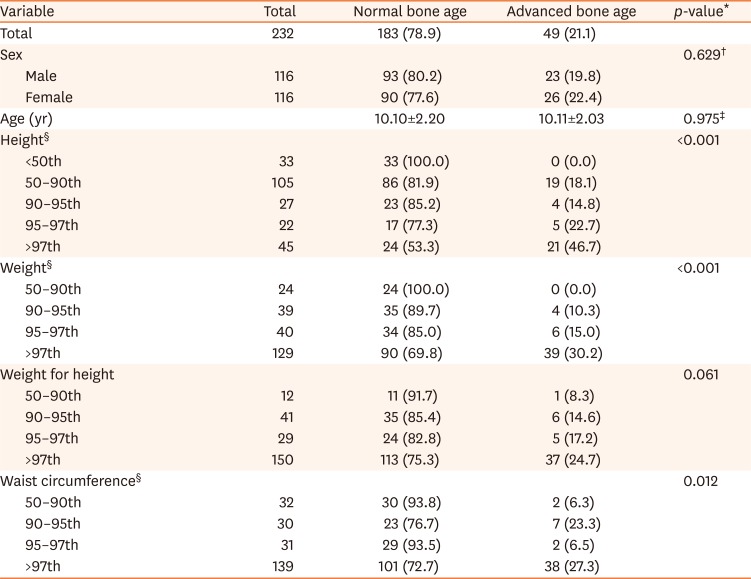
Table 1
The correlation between anthropometric data and bone age of obese children
Values are presented as number only, number (%), or mean±standard deviation.
*Linear-by-linear association for trend, †χ2 test, ‡t-test. §The rate of advanced bone age is increased as each parameter rises to a higher percentile.
![]()
We evaluated the correlation between anthropometric data and bone age of obese children (Table 1). As the percentile of height increased from below the 50th percentile to the 50–90th percentile, 90–95th percentile, 95–97th percentile, and 97th percentile or above, the prevalence of advanced bone age in each percentile section significantly increased from 0% to 18.1%, 14.8%, 22.7%, and 46.7%, respectively (p<0.001), while the prevalence of the normal bone age decreased. Similarly, as the percentile of weight and waist circumference increased, the prevalence of advanced bone age in each percentile section also significantly increased (0%, 10.3%, 15.0%, 30.2%, p<0.001; 6.3%, 23.3%, 6.5%, 27.3%, p=0.012, respectively) while the prevalence of normal bone age decreased. There was an increasing trend of the prevalence of advanced bone age, but not a significant association in the change of the percentile of weight for height (p=0.061).
Among the total children, the number of overweight and obese children was 37 (15.9%) and 195 (84.1%), respectively (Table 2). The percentage of children with a BMI ≥97th percentile was 71.6%. As the percentile of BMI increased from the 85–95th percentile to the 95–97th percentile, and 97th percentile or above, the prevalence of advanced bone age in each percentile section significantly increased from 5.4% to 20.7% and 24.7%, respectively (p=0.012), while the prevalence of normal bone age decreased. The BMI z-score was 2.10±0.46 and 2.43±0.52 in the normal and advanced bone age group, respectively (p<0.001). In addition, the prevalence of advanced bone age correlated with increases in obesity grade from overweight to mild, moderate, and severe, according to the degree of obesity based on the standard weight for height (p=0.047).
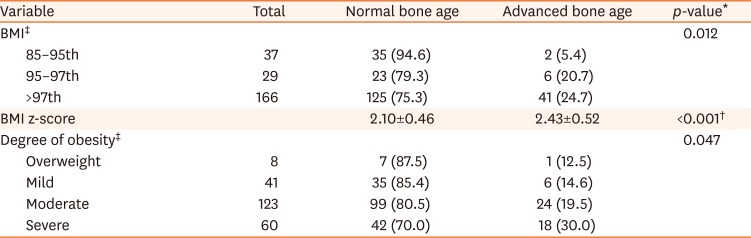
Table 2
The correlation between BMI/degree of obesity and bone age of obese children
Values are presented as number only, number (%), or mean±standard deviation.
BMI: body mass index.
*Linear-by-linear association for trend, †t-test. ‡The rate of advanced bone age is increased as each parameter rises to a higher percentile.
![]()
In laboratory data, there were several significant findings between the normal and advanced bone age groups (Table 3). Fasting serum insulin level was 18.65±12.33 μU/mL and 27.80±26.13 μU/mL in the normal and advanced bone age groups, respectively (p=0.034). HOMA-IR was 4.43±2.93 and 6.56±6.18 in the normal and advanced bone age groups, respectively (p=0.037). Compared to the normal bone age group, HDL-cholesterol level was lower in the advanced bone age group (48.95±10.50 mg/dL vs. 43.88±9.98 mg/dL; p=0.005). There was no significant difference in HbA1c, fasting serum glucose, triglyceride, and LDL-cholesterol levels.
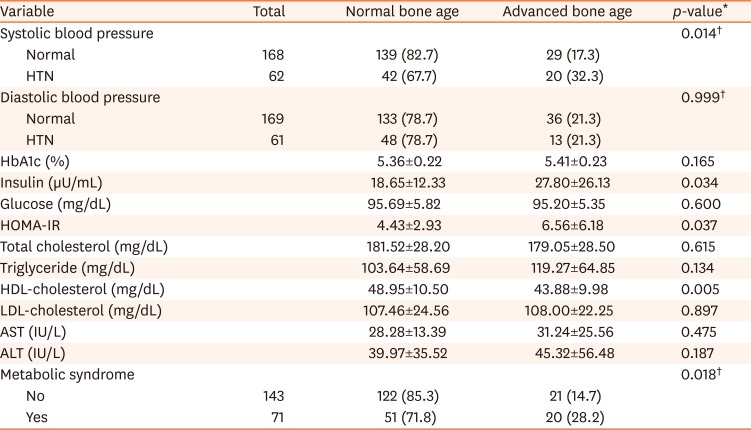
Table 3
The correlation between blood pressure/laboratory parameters and bone age of obese children
Values are presented as number only, number (%), or mean±standard deviation.
HTN: hypertension, HOMA-IR: homeostatic model assessment-insulin resistance, HDL: high density lipoprotein, LDL: low density lipoprotein, AST: aspartate aminotransferase, ALT: alanine aminotransferase.
*t-test, †χ2 test.
![]()
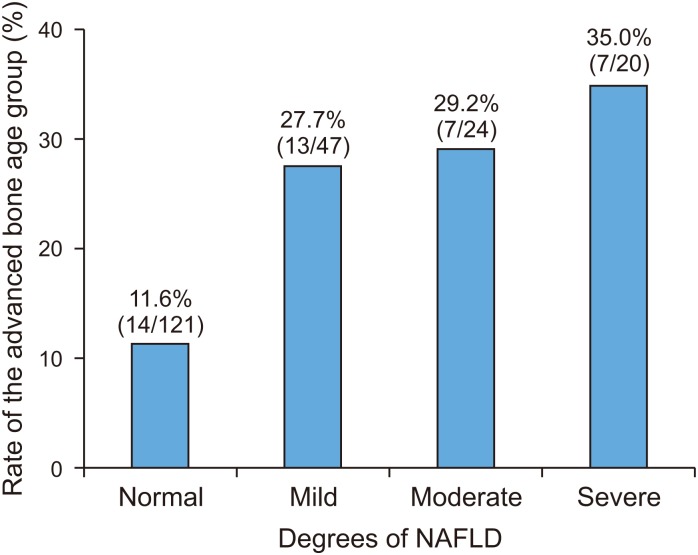
The prevalence of advanced bone age was higher in obese children with systolic hypertension than in those without systolic hypertension (32.3% vs. 17.3%, p=0.014; Table 3). The prevalence of advanced bone age was also higher in obese children with metabolic syndrome than in those without metabolic syndrome (28.2% vs. 14.7%; p=0.018). According to the degree of NAFLD, based on ultrasonography (no, mild, moderate, and severe), the prevalence of advanced bone age significantly increased from 11.6% to 27.7%, 29.2%, and 35.0%, respectively (p=0.002; Fig. 1).
Go to :
DISCUSSION
In our study, we defined advanced bone age as a difference >2 SD between bone and chronological age [12]. As skeletal maturation of children progresses differently according to sex and age, we determined a more specific definition than other studies of advanced bone age, using standard deviation. As a result, we found that the prevalence of advanced bone age was 21.1% in overweight and obese children with a BMI ≥85th percentile, by sex and age. Previous studies reported varying results about the prevalence of advanced bone age according to the inclusion criteria for subjects and the definition of advance bone age. Klein et al. [13] defined advanced bone age as a difference >2 SD between bone and chronological age, similar to our study. They reported that the prevalence of advanced bone age was 25% in obese children from 3 to 18 years of age [13]. In the study by Sopher et al. [14] with children 5 to 9 years, advanced bone age was calculated by dividing the bone age by chronological age (BA/CA). This study reported that the top tertile of BA/CA was 46.5% (20/43) for BMI ≥85th percentile and 8.7% (2/23) in normal weight. In Lee et al.'s study [15] of Korea, advanced bone age was defined as the difference more than 1 year between bone and chronological age. The prevalence of advanced bone age in obese children with BMI ≥95th percentile was 47.5%, which differed from the results of our study due to a different definition of the advanced bone age.
The prevalence of advanced bone age increased as height, weight, and waist circumference, by sex and age, increased to a higher percentile. Previous studies reported the association between height and advanced bone age [15]. A tall stature in obese children compared to normal weight peers is thought to result from early skeletal maturation. However, longitudinal studies [56] on growth patterns of obese children showed that although they have a tall stature during pre-puberty, their final adult height was similar to their anticipated heights (based on mid-parental height) like normal weight peers. In other words, the high height percentile of obese children during pre-puberty can decrease in adulthood. In addition, if childhood obesity accompanied precocious puberty, their final height may be shorter than their anticipated height [16]. We also observed that waist circumference correlated with advanced bone age. It has been known that dehydroepiandrosterone sulfate and leptin increased in obese children, especially centrally, and these hormones are associated with accelerated skeletal maturation [131417]. Since waist circumference reflects central obesity, it may be an important risk factor for advanced bone age.
Obesity is a condition of excessive fat accumulation. It can be diagnosed with BMI or the degree of obesity based on the standard weight [18]. BMI is considered the most representative method for diagnosing obesity and grading its severity. Also, it is known to be associated with body fat percentage and complications of obesity, such as metabolic syndrome and NAFLD [19]. In our study, the prevalence of advanced bone age increased as obesity (determined by BMI) increased in severity. The association between BMI and advanced bone age was also reported in previous studies [2021]. However, our study had the limitation of evaluating the correlation between advanced bone age and the severity of obesity by BMI as 71% of subjects were obese, with a BMI ≥97th percentile. Therefore, we conducted further analyses using other methods for obesity grading, BMI z-score and the degree of obesity based on standard weight. As a result, the value of the BMI z-score was higher in the advanced bone age group. In other words, the advanced bone age group had more obese children than the normal bone age group. The degree of obesity based on standard weight graded the severity of obesity into overweight (10–20%), mild (20–30%), moderate (30–50%), and severe (≥50%), which more finely defined the grade of obesity than BMI. We observed that the degree of obesity based on standard weight statistically correlated with advanced bone age. Therefore, we think that as the severity of obesity worsens, the bone age of obese children may be more advanced.
Interestingly, our study intended to evaluate the correlation between advanced bone age and the complications of obesity, but there were few studies regarding the association between advanced bone age and metabolic syndrome. We found that obese children with metabolic syndrome had a higher rate of advanced bone age than those without metabolic syndrome. More specifically, obese children with advanced bone age showed high levels of insulin and HOMA-IR. One in vitro study using mice suggested that insulin directly accelerates skeletal maturation by activating the insulin receptor at the growth plate [22]. Recent studies observed that obese children with hyperinsulinemia or insulin resistance had a more advanced bone age [1523]. Therefore, insulin is thought to be relevant to the advanced bone age in obese children. Similarly, we found that the severity of NAFLD associated with advanced bone age, which may be related to involvement of insulin in the pathophysiology of NAFLD [24]. In addition to insulin, the HDL-cholesterol level, another metabolic syndrome parameters, was a significantly lower in the advanced bone age group compared to the normal bone age group, which had not been previously reported. Moreover, in our study, obese children with hypertension had a higher rate of advanced bone age than those without hypertension. It has been reported that accelerated skeletal maturation in obese children may be an independent risk factor for hypertension, irrespective of BMI [25]. Therefore, hypertension in obese children can also be considered to be associated with advanced bone age.
There were limitations in our study. We did not measure sexual maturity and hormone levels, especially sex hormones, that were related to growth patterns, except insulin. Puberty is an important period of rapid growth, with increasing growth and sex hormones. Several studies reported that childhood obesity is associated with precocious or early puberty [2627] and particularly, early onset puberty influences skeletal maturation and height-growth in children [16]. Although our study showed that there was no significant difference in age between groups (10.10±2.20 years vs. 10.11±2.03 years), there was a possibility that the advanced bone age group included children with a higher sexual maturity for the same age. In addition, since we did not assess the final adult height of subjects, we could not observe whether advanced bone age of obese children actually influenced the final adult height.
In conclusion, the prevalence of advanced bone age was 21.1% in overweight and obese children. It was associated with increases in height, waist circumference, and severity of obesity. In addition, obese children had a higher prevalence of advanced bone age in those with metabolic syndrome, more severe degree of NAFLD, and hypertension. Although children with more severe degrees of obesity and complications of obesity may have tall statures and high height percentiles, their percentiles of adulthood height may ultimately decrease due to their tall stature being the result of abnormal advanced bone age. Therefore, it is important to examine the bone age of obese children, which may help with consultations for the clinical management of obesity.
Go to :
 XML Download