

 PDF
PDF Citation
 Print
Print


INTRODUCTION
Cancer is the leading cause of death in both humans and dogs. Currently, there is an increasing trend of cancer incidence in dogs. In many countries, the rates of morbidity and mortality due to cancer in dogs are higher than those in the past [1]. In Thailand, at the Veterinary Teaching Hospital, Faculty of Veterinary Medicine, Khon Kaen University, Khon Kaen, 1.5%–2.5% of dogs seen were diagnosed with cancer from 2006–2007. Through 2017, cancerous cases have increased by 4%–5% or more. Currently, tissue biopsy and histopathological slides are required for routine cancer diagnoses in dogs by skilled histopathologists. One major pathological factor in cancer is oxidative stress. The levels of serum malondialdehyde (MDA), a biomarker of oxidative stress, are significantly higher in cancer-bearing dogs than in clinically healthy dogs [2]. However, MDA values tend to vary among laboratories due to the use of different methods for MDA analyses [3]. Therefore, the diagnosis of cancer in dogs remains challenging because no definitive clinical biomarker exists. A non-invasive, rapid and inexpensive technique to identify early-stage cancer would be very helpful in the clinical diagnosis and treatment of cancer in dogs.
The Fourier transform infrared spectroscopic (FTIR) technique is a sensitive and replicable method for the diagnosis of several diseases, including cancer [4]. Many studies have reported that FTIR can be used to identify benign and malignant tumors in humans, including lung cancer [5], colon cancer [6] and cervical cancer [7]. Recently, FTIR was introduced as a diagnostic tool in dogs for diagnoses including canine atopic dermatitis [8] and canine liver cancer [9]. Attenuated total reflection (ATR), a sampling technique, is used in conjunction with FTIR to aid in the direct examination of solid or liquid samples without complex preparation. ATR-FTIR is used as a screening technique for both non-Hodgkin lymphoma and melanoma [10]. Based on infrared absorption due to the vibration of bound molecules, this technique provides information on changes in tissues via a characteristic spectral signature. Moreover, ATR-FTIR can be performed using a small amount of sample with limited sample pretreatment and without the use of additional reagents.
Herein, we evaluated ATR-FTIR for its potential to detect cancer in dogs as a helpful measure in clinical diagnosis. We report our attempt to utilize ATR-FTIR to screen for cancer in dogs and directly compare the abilities of this method with those of conventional methods to screen for cancer, including their uses for complete blood count, blood parasite and blood chemistry analyses. We present ATR-FTIR as a cancer screening method in dogs and discuss the advantages of utilizing this technology for this purpose.
MATERIALS AND METHODS
Animals
Dogs were registered in this study between June and December 2017 at the Veterinary Teaching Hospital, Faculty of Veterinary Medicine, Khon Kaen University, Khon Kaen, Thailand. We included 30 dogs with cancer (16 males and 14 females; average age, 5.97 years; range, 2–9 years). Regarding the inclusion criteria, cancer-bearing dogs had to have been diagnosed by a histopathological test. The types of cancer were classified by the evaluation of histopathological slides from a tissue biopsy by histopathologists. Dogs receiving chemotherapy or surgery were excluded from the study. Forty clinically healthy dogs (17 males and 23 females; average age, 4.03 years; range, 2–8 years) with no blood or intestinal parasites and a normal physical examination at least six months before blood collection were included in this study. Owner consent was obtained for all participating dogs. This study was approved by the Animal Ethics Committee of Khon Kaen University based on the Ethics of Animal Experimentation of National Research Council of Thailand (record no. ACUC-KKU-18/2560, reference no. 0514.1.75/31).
Blood sample collection and serum sample preparation
Three milliliters of blood were obtained from the cephalic vein and separated into two parts. One milliliter of blood was treated with ethylenediamine tetraacetic acid for complete blood count analysis and the presence of blood parasites. The remainder was centrifuged at 3,000 rpm at 4°C for 10 minutes, and serum samples were stored at −80°C until analysis.
Complete blood count, blood parasite and blood chemistry analyses
Packed cell volume, hemoglobin (Hb) levels, red blood cell (RBC) counts, and white blood cell (WBC) counts were measured using an automatic analyzer (Sysmex XT-2000iV, USA). Dried blood smears were stained with Wright-Giemsa and microscopically examined for parasitic detection using an oil immersion lens. Creatinine and alanine aminotransferase (ALT) were assayed using an automatic blood chemistry analyzer (Olympus AU400, USA).
ATR-FTIR analysis of serum samples
Serum samples were thawed at room temperature and centrifuged at 3,000 rpm for 10 minutes. Next, 5 µL of serum was placed onto a sample holder and dried for 10 minutes before analysis. FTIR spectra were collected in triplicate using an ATR-FTIR spectrometer (Agilent technologies, Model 4500 series FTIR, Malaysia) in absorbance mode. Spectra were obtained in the range of 4,000–650 cm−1 and at a 4 cm−1 spectral resolution with 32 co-added scans. Dried serum film was removed from the crystal using absolute ethanol before the next sample was measured.
FTIR data processing and analysis
All spectra were preprocessed by second derivatives with nine smoothing points and extended multiplicative signal correction (EMSC). For discrimination between the healthy control and cancer-bearing groups, principal component analysis (PCA) was performed on pre-processed spectra. Three spectral regions, including the fingerprint (1,800–900 cm−1), without amine (1,350–900 cm−1) and C-H (3,000–2,800 cm−1), were analyzed.
The leave-one-out cross validation technique and partial least squares (PLSs) regression analysis were used to predict normal and cancer spectra. Seventy models and 70 prediction groups were defined. Second derivatives with nine smoothing points and EMSC of the spectra were also preprocessed before analysis by PLS. Only the fingerprint (1,800–900 cm−1) was analyzed. Unscrambler 10.5 software (CAMO Software AS, Norway) was used for both PCA and PLS.
Statistical analysis
The normality of continuous data was assessed using graphical displays and the Shapiro-Wilk test. Data that met parametric assumptions, non-parametric data, and categorical data were analyzed by the independent sample t-test, Mann-Whitney U test and Pearson χ2 test, respectively. Data with normal distributions are reported as the means ± standard deviation (SD), but those without normal distribution are reported as medians (interquartile range). All statistical analyses were performed by statistical software (SPSS version 17; SPSS Inc., USA), and p values < 0.05 were considered significant.
RESULTS
Of 106 dogs, 60 were identified as having cancer, and 46 were identified as being clinically healthy. Thirty of the dogs with cancer and six clinically healthy dogs were excluded from the study, as they did not meet the inclusion criteria. Therefore, 30 dogs with cancer and 40 clinically healthy dogs were included in this study.
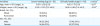
The demographic characteristics of the cancerous and clinically healthy dogs are shown in Table 1. The average age of the cancer-bearing dogs was significantly higher than that of the clinically healthy dogs (mean ± SD, 5.96 ± 2.28 years vs. 4.02 ± 1.71 years, respectively; p < 0.01); however, there was no significant difference in the body weights between the groups (p = 0.147). The proportion of pure breeds in the cancer-bearing group was greater than that in the clinically healthy group (18/30 or 60% vs. 14/40 or 35%, respectively). In cancer-bearing dogs, the pure breeds were Golden Retriever (4), Thai Ridgeback (3), Pit Bull (2), Labrador Retriever (2), Siberian Husky (2), Poodle (2), Shih Tzu (1), German Shepherd (1), and Bangkaew (1). In the clinically healthy dogs, the pure breeds were Golden Retriever (4), Thai Ridgeback (2), Siberian Husky (2), Pug (2), Jack Russell Terrier (1), Poodle (1), Bangkaew (1) and Great Pyrenees (1). Although 9 types of cancer were identified in this study, the three most common were malignant transmissible venereal tumors (30%), mast cell tumors (20%), and lymphoma (13.33%) (Table 2). Clinical staging was also reported according to Owen [11].
Table 1
Demographic characteristics of cancer-bearing and clinically healthy dogs
![]()
Table 2
Numbers and percentages of dogs classified with different cancer types and clinical staging
| Cancer types | No. of dogs (%) | Clinical staging [11] (No.) |
|---|---|---|
| Malignant transmissible venereal tumor | 9 (30) | T1N1M0 (2), T2N0M0 (2), |
| T2N1M0 (1), T3N0M0 (3) | ||
| T3N1M0 (1) | ||
| Mast cell tumor | 6 (20) | Stage 2 (3), Stage 3 (2), Stage 4 (1) |
| Lymphoma | 4 (13.33) | Stage 2 (2), Stage 4 (2) |
| Mammary gland carcinoma | 3 (10) | T3N0M0 (2), T3N1M0 (1) |
| Adenocarcinoma | 2 (6.67) | T3N0M0 (1), T3N1M0 (1) |
| Hemangiosarcoma | 2 (6.67) | T2N0M0 (1), T3N0M0 (1) |
| Squamous cell carcinoma | 2 (6.67) | T3N0M0 (2) |
| Osteosarcoma | 1 (3.33) | N1M1 (1) |
| Fibrosarcoma | 1 (3.33) | T3N0M0 (1) |
![]()
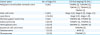
The clinicopathologic profiles of the cancer-bearing and clinically healthy groups are shown in Table 3 [1213]. The mean RBC counts, Hb levels, WBC counts and platelet counts in both groups were within the normal reference ranges. However, the RBC counts, Hb levels and WBC counts were significantly lower in cancer-bearing dogs than in clinically healthy dogs (p < 0.01, p < 0.01 and p = 0.03, respectively), whereas no significant differences in the mean platelet counts were observed between the clinically healthy and cancerous dogs (p = 0.06). No blood parasites were found in either group, and the creatinine and ALT levels were within normal ranges and not significantly different between the two groups (p = 0.59 and p = 0.06, respectively).
Table 3
Clinical pathological profiles of cancer-bearing and clinically healthy dogs (mean ± standard deviation)

RBC, red blood cell count; MCV, mean corpuscular volume; MCHC, mean corpuscular hemoglobin concentration.
WBC, white blood cell count; ALT, alanine transaminase.
![]()
The average FTIR spectra of air-dried serum samples extracted from the normal (n = 40) and cancer (n = 30) groups in the fingerprint region (1,800–900 cm−1) are shown in Fig. 1A. Serum spectra are a superposition of overall macromolecule spectra, including glycogen, lipid, DNA, RNA, and protein found in serum. Proteins, including the amide I peak at 1,631 cm−1, exhibit the strongest bands in the spectra depending on the secondary structure of the protein. The position of this band is sensitive to the secondary structure of proteins. This position appears at 1,665 cm−1 for random coils and β-turns, 1,650 to 1,655 cm−1 for α-helical structures, and at 1,635 cm−1 for β-sheet structures. The second strongest band is assigned to amide II from proteins at 1,544 cm−1. The amide III band manifests at 1,305 cm−1 and originates principally from NH2 bending vibrations coupled to CH2 deformations of aliphatic amino acids. The lipid phosphate band (PO2) is found in the region 1,215–1,245 cm−1 due to the symmetric P-O stretching vibration. The spectral region 1,240–920 cm−1 predominantly originates from the C-O stretching vibration. Absorption peaks at 1,180, 1,165, 1,130, 1,040 cm−1 are attributed to different C=O stretching vibrations of C-O-H and C-O-C bands. The weak absorption band in the region 955–960 cm−1 is assigned to P-O symmetric stretching of the phosphate band of proteins [14]. Fig. 1B shows second-derivative spectrum of air-dried serum samples of clinically healthy (blue line) and cancer-bearing dogs (red line). The differences between these two groups were observed at 1,629 and 1,690 cm−1 which represent amide I peak and C=O stretching, respectively.
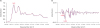 | Fig. 1(A) Average Fourier transform infrared spectroscopic spectra of the normal and cancer groups. (B) Secondary derivative spectra. Blue line and red line represent clinically healthy and cancer-bearing groups, respectively.
|
In our study, the fingerprint region (1,800–900 cm−1) was selected for unsupervised multivariate analysis. Spectral data were analyzed using second derivative spectra of the data after performing vector normalization and mean centering. PCA was performed on the pre-processed spectra, giving an unsupervised classification from which the loadings could be interpreted. In our study, PCA was applied to distinguish subtle differences in the FTIR spectra of clinically healthy and cancer-bearing dogs. Fig. 2A shows a PCA score plot displaying the separation between the normal group (blue) and cancer-bearing group (red). Principle component 1 (PC1) on the x-axis represents the good separation between clinically healthy and cancer spectra. The major peaks from PC1 show that the amide I, amide II and C-O stretch (DNA/RNA) bands are responsible for the separation between non-cancer and low-grade cancer from high-grade cancer PCA data points. Fig. 2B shows the loadings of PC1. The major spectral peaks and proposed biomolecular assignments responsible for PC1 loadings are at wavenumbers 1,690 cm−1 (nucleic acids), 1,631 cm−1 (amide I), 1,629 cm−1 (amide I), 1,664 cm−1 (C=O of cytosine or uracil), 1,555 cm−1 (ring base), 1,514 cm−1 (stretching [C=C]), 1,733 cm−1 (carbonyl peak), 1,698 cm−1 (C2=O of guanine or N-H thymine), 1,648 cm−1 (amide I), and 1,543 cm−1 (amide II) [141516]
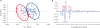 | Fig. 2Principal component analysis results in the fingerprint region (1,800–900 cm−1) for discrimination of the normal group (blue) and cancer group (red). (A) Score plot of PC1 vs. PC3. (B) Loadings of PC1.PC, principle component.
|
Accordingly, we applied PLS regression for calibration and leave-one-out cross validation. The prediction model was calculated from a validation set using the averaged spectra of each dog with the leave-one-out methodology. PLS results (Fig. 3) in the fingerprint region (1,800–900 cm−1) for predictions in the clinically healthy (blue) and cancer-bearing (red) groups were obtained, with (A) a score plot of factor 1 and factor 2, (B) regression coefficients of PC1, (C) explained variance and (D) predicted vs. reference comparisons. The prediction results for the normal and cancer groups are shown in Table 4 with a sensitivity and specificity of 76.7% and 87.5%, respectively.
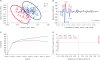 | Fig. 3Partial least squares results in the fingerprint region (1,800–900 cm−1) for prediction of the normal group (blue) and cancer group (red). (A) Score plot of factor 1 and factor 2. (B) Regression coefficients of principle component 1. (C) Explained variance. (D) Predicted vs. reference.
|
Table 4
Prediction results for the normal and cancer groups


The formula calculation shows sensitivity and specificity of 76.7% and 87.5%, respectively.
TP, true positive, FN, false negative, TN, true negative, FP, false positive.
![]()
The PLS regression plot shows amide I shifting to an increasing wavenumber at 1,652 cm−1 in the cancer group. Additionally, this non-response group exhibited the amide II at 1,542 cm−1 and symmetric stretching PO2− and symmetric PO2− stretching modes at 1,226 cm−1 and 1,085 cm−1, respectively, of nucleic acid bands. Therefore, these results suggest that the FTIR spectra of dog serum can be used for cancer diagnoses.
DISCUSSION
In this study, the RBC counts and Hb levels in cancer-bearing dogs were lower than those in clinically healthy dogs, although the levels in both groups remained within the normal range. As anemia is one of the most common paraneoplastic syndromes [17], we assume that cancer-bearing dogs have a tendency toward anemia. In the present study, the blood samples were centrifuged to removed RBC and Hb. The supernatants, that were serum samples, were collected for ATR-FTIR. Therefore, RBC and Hb were not affected ATR-FTIR spectrum. In contrast, the WBC counts in cancer-bearing dogs were higher than those in clinically healthy dogs, which may have been due to inflammation, tissue damage, and concurrent infections [181920]
In this effort to assess the biochemical differences between clinically healthy dogs and cancer-bearing dogs, ATR-FTIR was applied to distinguish spectroscopic patterns in sera from dogs with and without cancer. The FTIR spectral signatures from the two groups were obtained by the application of multivariate analysis and PCA. The results of the present study show that ATR-FTIR in combination with chemometrics is a promising technique for cancer screening using dog serum. The differences between the ATR-FTIR spectra of serum samples representing clinically healthy (n = 40) and cancer-bearing (n = 30) dogs were remarkable. Significant differences in the infrared absorption patterns of serum samples were detected between samples from the cancer-bearing and control animals. This difference between control and cancerous dogs was observed based on changes in the peak positions of the absorption of main proteins, carbohydrates and nucleic acids in the serum, which agreed with the clinical test results. These alterations in overall biomolecules in serum lead to the altered identities of spectral markers. The intensities and positions of amide I and amide II bands, determined by backbone confirmation of the hydrogen bonding pattern, change in response to malignancies. Based on the spectral data, our findings appear to be consistent with several previous reports on human cancer detection using FTIR spectroscopic techniques [2122].
We report the use of ATR-FTIR spectral data combined with a PLS regression analysis for screening healthy and cancer-bearing dog serum, displaying average sensitivities and specificities of 76.7% and 87.5% respectively. The data show a small number of false positive (n = 5) and false negative (n = 7), whereas there are a large number of true positive (n = 23) and true negative (n = 35). The high negative predictive value (83.3%) and positive predictive value (82.1%) were also obtained. These findings suggest that in the present study, ATR-FTIR method may serve as a potential screening method, and may be developed to be a diagnostic tool for differentiating clinical healthy from cancer-bearing dogs. The prospective study with a large sample size should be further studied.
Compared to other applications of ATR-FTIR on body fluids from animals, synovial fluid samples from horses with traumatic arthritis and joints with osteochondrosis that have been studied, significant differences in the infrared absorption patterns of synovial fluid samples were detected with higher accuracy [2324]. Synovial fluid samples were collected from a single tarsocrural joint of horses admitted for tarsocrural joint effusion, and radiographic evidence of osteochondrosis should provide more biomolecular markers than whole serum. The misclassification of certain cancerous spectra as controls may be attributed to variations in the cancer type and cancer severity. Nevertheless, the ability of this method to correctly identify control or cancerous serum (test specificity) in both validation sets clearly reveals the diagnostic potential for this classification algorithm in dogs.
To our knowledge, the present study is the first to use FTIR spectra from canine serum to represent biochemical fingerprints for the purpose of cancer screening in dogs. A study on larger sample size is necessary for future development and optimization of the specificity and sensitivity of this test for clinical use. Furthermore, the study of temporal variation in spectral marker signatures is important for cancer typing, sub-typing and assessing heterogeneity [10]. Future development and optimization of the specificity and sensitivity of this test for clinical use could be improved using spectral and prevalence data from a larger sample size. FTIR spectroscopy for IgG quantification in dog serum was applied and compared to the RID assay as the reference standard [2526]. Our study represents an attempt to qualify the overall spectral signature of cancer-bearing dog serum rather than focusing on an antibody, highlighting the direct and simple clinical application of ATR-FTIR.
In the present study, we demonstrate the use of the rapid and reliable FTIR spectroscopic technique for discrimination between healthy and cancer-bearing dog serum samples. The FTIR spectroscopic technique has a high potential to assist in rapid diagnoses; however, a number of limitations must be overcome before this technology can be introduced into the clinical laboratory. Developing diagnostic techniques for dogs with cancer using body fluid samples that can be collected with relatively low risks requires further research. The ATR-FTIR spectroscopic technique will support increased compliance rates for eligible population cancer screening and aid veterinarians' decisions to perform advanced histological examinations using biopsy.
In conclusion, we report a preliminary application of using ATR-FTIR to analyze sera from cancer-bearing and clinically healthy dogs. FTIR is a rapid, cheap and reagent-free method that requires very small serum sample volumes. FTIR is a promising screening tool to discriminate between sera from cancer-bearing and healthy dogs. ATR-FTIR has advanced to become the standard FTIR sampling technique, providing excellent data quality and high reproducibility. This study is the first ATR-FTIR spectra assay using canine serum samples which shows the clinical potential as a screening tool to discriminate between sera from cancer-bearing and healthy dogs. A large number of sample, to optimize specificity and sensitivity on cancer detection, are warranted.
 XML Download