

 PDF
PDF Citation
 Print
Print


INTRODUCTION
Bone fractures can heal through a direct or indirect process depending on fracture stability and the gaps between bone fragments [12]. Radiographic evaluation of fracture healing is based on the loss of sharpness of bone fragments at 1–2 weeks after injury and the detection of periosteal callus at 3–6 weeks after injury. Computed tomography provides fracture healing evaluation via callus measurement, and an increased callus area indicates a decrease in the deformation of bone [3]. Moreover, 3-dimensional computed tomography can be used to evaluate fracture line alignment and perform volumetric assessment of the area around the callus [3]. However, this application can be limited by the presence of artifacts related to metal implants and anesthesia or sedation for optimal positioning of the fracture site in practice.
Perfusion of the surrounding soft tissues and bone is critical to bone healing and has a decisive influence on therapy choice [45]. Immediately after fracture, a hematoma containing vascular endothelial growth factor is generated and an acute inflammatory response is initiated [26]. This process peaks within the first 24 h and ends after 7 days [2]. When normal bone healing fails, nonunion occurs. A nonunion may be classified as avascular or vascular based on the presence of blood perfusion of the fracture gap. Presence of a vascular nonunion has been correlated with a good outcome in a previous dynamic contrast-enhanced magnetic resonance imaging study [5].
An effective diagnostic modality should be able to estimate low-velocity, small-volume blood flow when evaluating vascularity during fracture healing. Doppler and power Doppler ultrasonography have been applied in the evaluation of vascularization during the bone healing process, and some authors have proposed vascularization as an indicator of fracture healing [78910]. In bone scintigraphy assessment, an activity index based on the isotope uptake ratio between fractured and normal bone is determined, which can be helpful in distinguishing normal fracture healing, delayed union, or atrophic nonunion [11]. In addition, intraosseous venography has been used to evaluate the neovascularization across the fracture line in a canine model [12].
The ultrasound contrast medium remains strictly within the blood vascular system and a contrast medium microbubble can be visualized in harmonic imaging by using contrast-enhanced ultrasonography (CEUS) [13]. CEUS can evaluate organ perfusion in real-time based on the bright signal formed by the contrast medium at a low mechanical index. In addition, CEUS allows assessment of tissue perfusion by measuring peak intensity (PI) and time to peak intensity (TPI) quantitatively based on examination of the time-intensity curve (TIC). CEUS has been used to evaluate components of the musculoskeletal system including muscle, tendon, joint, and muscle perfusion under various conditions including inflammatory myopathy, peripheral arterial disease, diabetes, cancer, cachexia, and transplanted free flaps [4141516171819]. To our knowledge, neovascularization and blood perfusion during fracture healing have not been investigated using CEUS. We hypothesized that perfusion of surrounding soft tissues can be used as an early indicator of hemodynamic changes during bone healing and that CEUS can detect neovascularization and blood perfusion during fracture healing earlier than that detected by power Doppler ultrasonography (power Doppler). The objectives of this study were to determine the applicability of CEUS for assessing neovascularization during fracture healing in a canine tibial osteotomy model and to compare the vascular signals on CEUS of the external skeletal fixation (ESF) and cast-applied groups.
MATERIALS AND METHODS
Animals
Six 3-year-old adult male beagles weighing 8.5–12.5 kg (mean 9.83 ± 1.19 kg) were used. The clinical state of every dog was determined using physical examination, systemic blood pressure, complete blood count, serum biochemistry, electrolytes, urinalysis, and radiography. The dogs were kept in individual cages and fed commercial dry food and water ad libitum. All protocols were approved by the Institutional Animal Care and Use Committee of Chonnam National University (CNU IACUC-YB-2013-65).
Experimental osteotomy
In all dogs, 3 mg/kg tramadol hydrochloric acid (Tramadol, Dongkwang Pham, Korea) and 20 mg/kg cefazolin sodium (Cefozol, Hankook Korus Pharm, Korea) were intravenously administered. After premedication with 0.01 mg/kg acepromazine maleate (Sedaject, Samu Median, Korea), anesthesia was induced with 6 mg/kg propofol (Pofol inj., Dongkook Co., Ltd., Korea) and maintained using isoflurane (Isoflurane, Rhodia Organique Fine Ltd., United Kingdom) through a tracheal tube. A simple transverse osteotomy was performed at the proximal third of the left tibial shaft using a sagittal blade (Core Sag Saw, Stryker, USA). A Type 1a ESF (SK Linear ESF System, IMEX Veterinary Inc., USA) was applied to three dogs (ESF group) and a splint and a fiberglass cast (Nemoa cast, T&L Medical Div., Korea) were applied to the remaining three dogs (Cast group). Exercise restriction and medication using 0.1–0.2 mg/kg meloxicam (Metacam, Boehringer Ingelheim Vetmedica, USA) per oral as well as 3 mg/kg tramadol and 20 mg/kg cefazolin intravenously for 7 days were applied in all dogs.
Bone healing evaluation
Diagnostic imaging studies were performed at 2-day intervals from the first day after tibial osteotomy to day 7, then at 3-day intervals to day 16, 4-day intervals to day 48, 1-week intervals to day 74, and 2-week intervals until a complete union was confirmed. Presence of a complete union was based on mediolateral and craniocaudal radiographs that showed cortical continuity and obliteration of the fracture line (Fig. 1) [20]. Radiographically, widening of the osteotomy gap, indistinct change of osteotomy end, soft tissue callus and mineralization, apposition and alignment of the fragments, and position of fixators were also evaluated. Ultrasonography was performed under general anesthesia with intramuscular injections of 1.5 mg/kg zolazepam/tiletamine (Zoletil, Virbac, France) and 0.03 mg/kg medetomidine (Domitor, Orion Corporation, Finland) after a fast of 24 h. Blood pressure was measured before and after anesthesia. Power Doppler and CEUS were performed using a 10 MHz linear transducer and a ProSound Alpha 7 system (Hitachi-Aloka, Japan). On lateral recumbency of the dog, the transducer was placed over the craniolateral plane of the proximal third of the left tibia with care taken to exclude the median saphenous vein from the scanning area [21]. Power Doppler examination was performed using a 7.27 MHz Doppler frequency, level 2 of a 6 level Doppler wall filter, a 1.2 kHz pulse repetition frequency, and a 3 cm image depth. Vascularization amounts in the surrounding soft tissue and vascular signal intensity were subjectively graded and assigned a score of 0–3 based on three images (Table 1) [10]. CEUS was performed with a 0.07 mechanical index, 3 cm depth, 15 Hz pulse repetition frequency, and a 64% gain. In each dog, 0.5 mL/dog (2.5 mg/dog) of contrast medium (SonoVue, Bracco Imaging, Italy) was injected as a single bolus into the cephalic vein via three-way stopcock and a 20 G intravenous catheter, immediately followed by the rapid injection of 5 mL of 0.9% saline solution. CEUS was completed within 2 h after opening of the contrast medium, which was shaken before each injection. Dynamic acquisition of the images was obtained at a rate of 15 frames per second for 110 sec following the beginning of the contrast medium injection. All dynamic cine loops were analyzed using integrated software (SOP-ALPHA7-14, Hitachi- Aloka), which displayed the acoustic intensity over time. Each region of interest (ROI) in a 1.1 mm × 2.9 mm arc shape was placed over the surrounding soft tissue as close as possible to the fracture line and the endosteal and periosteal callus, separately, to draw the TIC. When a subject's motion shifted the ROI, it was manually moved to the same location frame-by-frame. For quantitative analysis, the PI and TPI were determined from the TIC (Fig. 2). PI was measured with the greatest acoustic intensity and measured using a unit of a level. TPI was defined as the duration from arrival of contrast medium to the PI and measured using a unit of seconds. For quanlitative analysis, numbers of vascular signals in the surrounding soft tissue and inside the callus were graded and assigned a score of 0–3 using the same criterion applied to the power Doppler images and based on three images captured near the PI time.
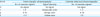
 | Fig. 1Schedule diagram for the diagnostic imaging intervals used to evaluate bone healing from osteotomy induction to complete union. The interval size between examination days is noted in each box.
|
Table 1
Qualitative analysis of power Doppler and contrast-enhanced ultrasonography in canine tibia fracture models
![]()
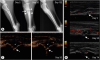
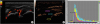 | Fig. 2Power Doppler ultrasonography (A) and contrast-enhanced ultrasonography in harmonic detection mode (B) of a cast-applied dog. ROI are placed over the surrounding soft tissue (pink), periosteal callus (blue), and endosteal callus (yellow). All ROI had typical time-dependent parabolic curves (C). The TPI was the time from arrival of contrast medium to the time of PI.ROI, region of interest; TPI, time to peak intensity; PI, peak intensity.
|
Statistical analysis
Statistical analyses were performed using the SPSS statistical program (IBM SPSS Statistics 21, IBM Corp., USA). The Kruskal-Wallis test was used to investigate differences in the TIC-derived parameters on the preoperative day. The differences in the mean number of vascular signals between CEUS and power Doppler, as well as between the two subject groups, were assessed by applying a repeated-measures analysis of variance. Values of p < 0.05 were considered significant for all analyses. Data are presented as mean ± standard deviation values.
RESULTS
One dog of the Cast group failed to achieve bone union and was excluded from the analysis. In the remaining 5 dogs, there were no side effects related to the surgery or the contrast agent. Complete healing was seen at days 74–81 after surgery in the three ESF-treated dogs and at day 132 in the 2 cast-applied dogs. The mean blood pressure of the 5 dogs was 152.07 ± 8.38 mmHg before anesthesia and 135.73 ± 13.74 mmHg after anesthesia and there was a significant difference.
The radiography, power Doppler, and CEUS results are summarized in Fig. 3 according to the time schedule. In all dogs, a sharp radiolucent line at the proximal tibia on radiographs and discontinuities of the hyperechoic cortical bone surface on ultrasonographs were visible immediately after tibial osteotomy. Power Doppler and CEUS revealed vascular signals present in soft tissue (Fig. 4). In the immediate postoperative phase, ultrasonography showed a hypoechoic or anechoic hematoma around the fracture line and the fracture line appeared as a clear discontinuity, whereas an increased vascular signal in the soft tissue was detected by both power Doppler and CEUS; moreover, the fracture line lost sharpness on the radiographs due to resorption at postoperative day 20 (Fig. 5).
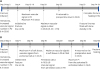 | Fig. 3Diagrams of diagnostic imaging observations from osteotomy induction to complete union in dogs with external skeletal fixation (A) and in cast-applied dogs (B).RG, radiography; PD, power Doppler ultrasonography; CEUS, contrast-enhanced ultrasonography; PI, peak intensity; US, ultrasonography.
|
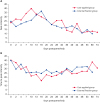
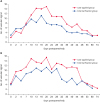 | Fig. 4Mean number of vascular signals in the surrounding soft tissue. (A) On power Doppler ultrasonography, a steep incline is visible during the first 2–13 postoperative days, with peak numbers observed at days 16 and 20 (cast-applied dogs, > 15; dogs with external fixation, 11.17 ± 0.62), after which the vascularization decreases gradually over the next few days. (B) On contrast-enhanced ultrasonography, a steep incline in signal numbers is visible during the first 2–10 days with peaks at day 20 in both groups (cast-applied dogs, > 15; dogs with external fixation, 11.33 ± 1.70), after which the vascularization decreases gradually over the next few days.
|
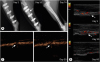 | Fig. 5Radiography (A) and power Doppler ultrasonography (B) capture images from the pre-injection of contrast agent (left). Peak intensity after contrast agent injection (right) on CEUS (C) of a dog with external fixation. The fracture line (arrows) is visible on radiography and ultrasonography on postoperative day 2. Resorption of the fracture line is seen at day 20 on radiography. At that time, CEUS shows peak vascularization. On power Doppler and CEUS, a marked increase in the number of vascular signals was seen at day 20, after which the vascularization decreased gradually. Bone healing was observed at day 60 on power Doppler and at day 74 on radiography.CEUS, contrast-enhanced ultrasonography.
|
The small hypoechoic area visible immediately after tibial osteotomy disappeared with increase in PI of the soft tissue on CEUS was higher than the preoperative value on subsequent ultrasonography in the ESF group (Fig. 6). PI peaked 38.83 ± 8.77 at 13–16 days after osteotomy and then gradually decreased and returned to the preoperative level at day 32. The subjectively evaluated vascular signals in the soft tissue peaked at postoperative day 16 (11.17 ± 0.62) on power Doppler and at day 20 (11.33 ± 1.70) on CEUS, then decreased. The fracture line showed a gradual hyperechoic change until a continuous sharply margined hyperechoic line was seen when complete union was achieved at postoperative days 74–81 on radiography.
 | Fig. 6Mean PI and mean TPI in the surrounding soft tissue on contrast-enhanced ultrasonography. (A) PI is at a peak at 13–16 days post-osteotomy then decreasing to the preoperative level at and after day 32. (B) TPI is seen to shorten during the early postoperative period and then gradually becomes longer in the following 24–32 days.PI, peak intensity; TPI, time to peak intensity.
|
In the cast-applied dog group, the echogenicity of the hematoma increased until an irregular hyperechoic callus was seen at postoperative day 16 on ultrasonography; a periosteal callus was detected on radiography at the same time (Fig. 7). CEUS revealed vascular signals from the periosteal callus from postoperative day 10 to day 48 and from the endosteal callus from day 13 to day 36. The PI from both calluses peaked between days 20 and 24 (mean intensity level of the periosteal callus, 24.04 ± 7.93; mean intensity level of the endosteal callus, 19.65 ± 0.60) (Table 2). Power Doppler revealed vascular signals in the periosteal callus, but not from the endosteal callus, only after the hyperechoic change at postoperative day 16. On CEUS, the PI of the soft tissue peaked (39.93 ± 4.94) on day 10 and then returned to the preoperative level at day 32. The number of vascular signals in the soft tissue peaked on day 20 in both power Doppler and CEUS results.
 | Fig. 7Radiography (A) and power Doppler (B) images from pre-injection (left) and peak intensity after contrast agent injection (right) on CEUS (C) of a cast-applied dog. The fracture line (arrows) is visible on radiography and ultrasonography. Resorption of the fracture line and marked periosteal callus (arrowheads) are seen at postoperative day 20 on radiography. Ultrasonography showed a hypoechoic or anechoic hematoma (asterisk) around the fracture line. On power Doppler and CEUS, a marked increase in the number of vascular signals is seen at day 20, after which the vascularization decreased until day 74. Complete healing was determined at day 74 on power Doppler and CEUS and at day 132 on radiography.CEUS, contrast-enhanced ultrasonography.
|
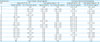
Table 2
TPI and PI level in periosteal and endosteal calluses of the cast-applied dog group by postoperative day

![]()
In the nonunion dog of the cast-applied group, periosteal callus was detected on radiography and ultrasonography at postoperative day 20. After that time, only a small amount of callus was observed, and there was no marked change of osteotomy line on radiography until day 48. On the other hand, subjective evaluated vascular signals in the soft tissue peaked at day 20 on power Doppler and CEUS, and higher levels of vascular signals (> 10) were detected by both modalities until postoperative day 48; results that differed from those of the other two dogs in the Cast group. In the nonunion dog, radiography revealed that the tibia fracture failed to form a union at day 60 after the osteotomy. TPI tended to be shorter in the early postoperative periods than that in the preoperative data and then became gradually longer in the following 24–32 days, becoming similar to that in the preoperative data. The vascular signal intensity scores on power Doppler images are presented in Table 3. Compared with the power Doppler results, the numbers of signals observed on CEUS were significantly higher in both groups and at each examined day (p < 0.001).
Table 3
Mean power Doppler and contrast-enhanced ultrasonography scores in each osteotomy group by postoperative day
Data presented as mean and standard deviation values.
ND, not done; ESF, external skeletal fixation.
![]()
DISCUSSION
In this study, a parabolically shaped TIC on CEUS was drawn for the surrounding soft tissue in all dogs and for the endosteal and periosteal calluses in the cast-applied dogs on each sampling day. Blood perfusion and neovascularization could be quantitatively and qualitatively analyzed during fracture healing on CEUS, whereas the power Doppler results only provided data suitable for qualitative analysis. Power Doppler has been applied to fracture healing based on its improved detectability of neovascularization compared with that of color Doppler ultrasonography [791022]. The timing to initiate vascular intensity on power Doppler ultrasonography has been reported as day 1 in a previous six canine ulnar fracture model study and as day 10 in previous canine and feline long bone fracture cases [910]. In this study, vascular signals from the soft tissue were initially detected on power Doppler and CEUS on day 2. However, the number of vascular signals on CEUS was greater than that on power Doppler images on the same day. CEUS is based on a harmonic technique [23] in which the backscattered contrast-enhanced signals from microbubbles are much greater than the other signals at the appropriate harmonic wavelength [13]. Therefore, a small vascular flow, which can be inconspicuous due to blooming artifacts on power Doppler ultrasonography, is detectable on CEUS [24]. Vascular signals in the endosteal callus, which were not seen on power Doppler in this study, were detected by CEUS.
In this study, markedly developed neovascularization and increased blood perfusion in the surrounding soft tissue was seen after the fracture line underwent a distinctive change on radiography. During that period, vascular signals in power Doppler and blood volume, quantitatively measured as PI, on CEUS were maximized in both groups. In addition, vascular signals from the periosteal callus were detected before mineralized callus was observed radiographically. Increased blood volume returned, approximately, to the preoperative level at postoperative day 32, regardless of the healing method.
Vascular signals in the soft tissue increased above the baseline at day 2, rapidly increased to a peak, then decreased gradually. Notably, more neovascularization was observed in the Cast group than in the ESF group at each examined day on both CEUS and power Doppler imaging. Vascular endothelial cells and perivascular mesenchymal cells provide the osteoprogenitor cells that differentiate into osteoblasts and create lamellar bone to achieve complete union during direct fracture healing [2]. In indirect fracture healing, vascular endothelial growth factor is considered a key regulator of vascular regeneration in endochondral fracture healing [25]. More vascularization and blood perfusion in the cast-applied dogs may be related to the greater inflammatory response and higher angiogenic cytokine secretion levels in that group [2].
One dog of the Cast group failed to accomplish fracture union. The fracture line was seen on radiography consistently until 60 days after the osteotomy. In the early phase, subjective vascular signals and radiographic results for the nonunion dog were consistent with the other two dogs of the Cast group. However, after postoperative day 20, vascular signals in the nonunion dog were not decreased, maintaining a high level, which was unlike that in the other cast-applied dogs. Thus, the outcome was considered as vascular nonunion. If power Doppler and CEUS were applied to a fracture without implants over time in the nonunion dog, vascular signals would decrease and an avascular nonunion (atrophic nonunion) may be observed. Power Doppler has been applied to vascular nonunion fracture in a previous canine study and abundant vascular signals were visible from the fracture gap [22]. Neovascularization in the endosteal and periosteal calluses was more marked with CEUS than with power Doppler in the present study. Thus, we believe that a vascularized nonunion can be distinguished from an avascular nonunion with CEUS simply and easily; however, to verify that suggestion, results from further clinical case studies are needed.
In the present study, power Doppler and CEUS were performed under general anesthesia in dogs. Mean blood pressures under anesthesia were significantly different from those in the pre-anesthetic state. Thus, the vasodilatory effect of anesthesia may have influenced the TIC values; moreover, blood velocity and volume could differ from those of subjects that are awake [262728].
Although the results of this study should be confirmed in a larger population animal study as well as in human clinical study, CEUS is expected to be an excellent modality for monitoring fracture healing. In particular, this modality was more sensitive than power Doppler ultrasonography for detecting neovascularization in the surrounding soft tissue and associated callus.
 XML Download