

 PDF
PDF ePub
ePub Citation
 Print
Print


INTRODUCTION
The main etiology of the periodontal disease is the plaque which leads to the host-microbial interactions and can cause the destruction of the periodontal ligament and alveolar bone. This destruction results from the recruitment of the host cells [1]. Some of the biomarkers act as a diagnostic indicator of present and future periodontal disease by measuring the substances in body fluids that correlate with the level of disease activity and tissue destruction. A biomarker is a feature or facet that can be used to measure the progress of disease or the effects of treatment [2].
Neopterin is a catabolic product of guanosine triphosphate and belongs to the chemical group pteridines. It is synthesized by human macrophages upon stimulation with the cytokine interferon-gamma and is indicative of a pro-inflammatory immune status. Thus it serves as a marker of cellular immune system activation [3]. Neopterin concentration increases with increasing severity of periodontal disease in diverse body fluids like urine, saliva, and plasma. Hence neopterin can be considered as an important inflammatory marker in periodontal disease as well as other systemic diseases. It is important to recognize the inflammatory changes well in advance so that preventive measures can be taken in the early stages. It has been found that non-surgical periodontal therapy (NSPT) reduces the inflammatory burden and restores the health of the periodontium and systemic health [4]. Even though pre- and postmenopause both are inflammatory in nature, literature is saying that more serious imperilment changes occurs in postmenopause. In this study an attempt was made to catch a glimpse of the inflammation decline by measuring neopterin levels and its response to NSPT in pre- and postmenopausal women.
Go to : 
MATERIALS AND METHODS
Total thirty female patients who were meeting the selection criteria between 40 and 60 years of age were included in this study. All of them were explained about the study design and the written informed consent was obtained before the procedure was carried out. This study was approved by the institutional ethical committee (Reg. No.- ECR/267/Indt/AP/2016). This study was also registered under clinical trial (https://clinicaltrials.gov; the reg no is NCT02357745). According to 1999 American Academy of Periodontology (AAP) classification periodontitis patients were recruited in the study [5]. All the subjects were examined by gynecologist. Depending on the menstrual history, all the patients were divided into two groups with each group comprising of 15 individuals; Group I: 15 premenopausal women with chronic periodontitis, Group II: 15 postmenopausal women with chronic periodontitis.
Inclusion criteria: 1) Patients suffering from chronic moderate periodontitis ≥ 4 mm pocket depth or ≥ 3 mm loss of attachment. 2) Patients should have at least 15 natural teeth remaining. 3) Nonsmokers. 4) Systemically healthy from past 6 months. Exclusion criteria: 1) Present or past smokers. 2) With gross oral pathology or tumors. 3) Patients on long-term steroid medication and if using any other medications for any other systemic diseases. 4) Undergoing hormone replacement therapy. 5) Patients underwent any dental treatment for past 6 months. 6) Any systemic disorders or any medications that affect the periodontal status were excluded from the study.
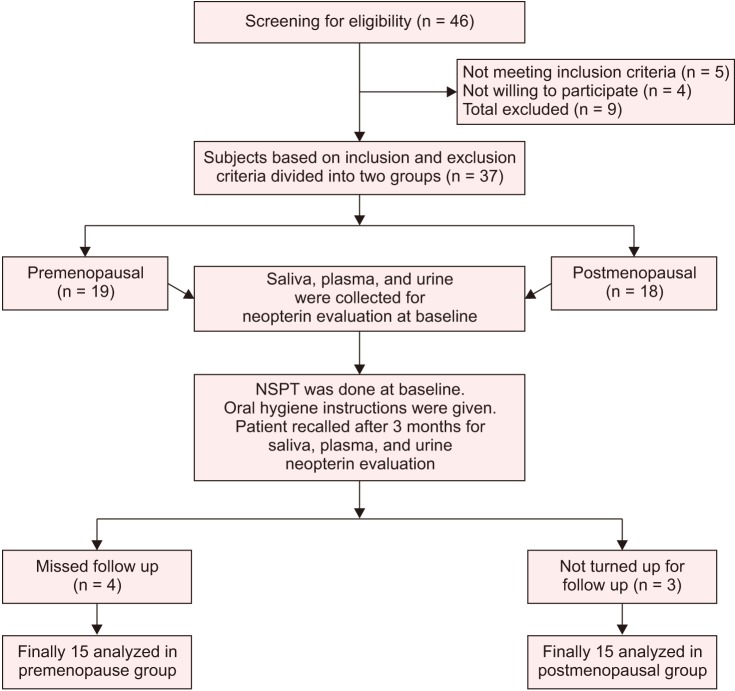
Total thirty patients were examined and samples collected at baseline and at 3 months intervals after NSPT to assess the neopterin values, patient selection criteria explained in (Fig. 1). Strict instructions were given not to rinse with mouthwash on the day of sample collection.
Sample collection and preparation
Plasma, saliva, and urine samples from the patients were collected for detection of the neopterin levels at baseline and 3 months after the treatment. All the collected samples were kept away from direct light, and stored at −20℃ until assayed.
Plasma
Five mL of peripheral venous blood was drawn from brachial plexus through vein puncture method. Whole blood was collected in purple topped cover tubules (EDTA tubes, 4 mL; CML Biotech (P) Ltd., Kerala, India). Obtained by centrifuging at 3000 × g for 10 minutes in a centrifuge (R-4C; REMI Laboratory Instruments, Mumbai, India), immediately liquid component, plasma was transferred into a clean polypropylene tube (Ria Vials; Tesca Technologies Pvt. Ltd., Jaipur, India) using a Pasteur pipette (Ajosha Bio Teknik Pvt. Ltd., Mumbai, India). These tubes were stored at −20℃ until used.
Saliva
One milliliter of whole saliva sample was collected by unstimulated passive drool in a sterile disposable plastic container (Polypropylene tubes, 0–15 mi; Thermo Fisher Scientific, Waltham, MA, USA). The patients were asked to collect saliva in their mouth by avoiding swallowing until a small amount of saliva was collected. Then the patients tilted their head forward allowing the saliva to drool passively. Patients were instructed not to brush or eat 8 hours before collection of the samples and strictly instructed not to use any mouth rinses. No dental examination was carried out 48 hours prior to saliva collection. Samples were centrifuged to get clear saliva.
Biochemical analysis
Immunological assay
Done with Neopterin ELISA Kit (Alpha Diagnostic Intl, San Antonio, TX, USA) for neopterin estimation, each sample was centrifuged at 10,600 ×g for 10 minutes at 4℃. Two hundred µL ethanol was added to 100 µL of sample to precipitate the proteins and vortexes for 1 minute. The supernatant in each sample was collected for estimation after centrifugation.
The observations recorded were subjected to statistical analysis using IBM SPSS version 21 software (IBM Co., Armonk, NY, USA). Intergroup comparison and percentage decrement was done by using independent sample t test and intra group comparison was done by paired t test. P value < 0.05 is considered as statistically significant.
Go to :
RESULTS
When compared premenopausal group, all the parameters showed a statistically significant reduction from baseline to 3 months after treatment. Urine neopterin levels have reduced from 304.91 ± 60.92 µmol/mol to 265.57 ± 54.57 µmol/mol. The saliva neopterin levels have reduced from 13.63 ± 1.55 nmol/L to 6.69 ± 1.24 nmol/L. The plasma neopterin levels have reduced from 11.72 ± 1.51 nmol/L to 6.95 ± 0.95 nmol/L from baseline to 3 months after treatment (Table 1).
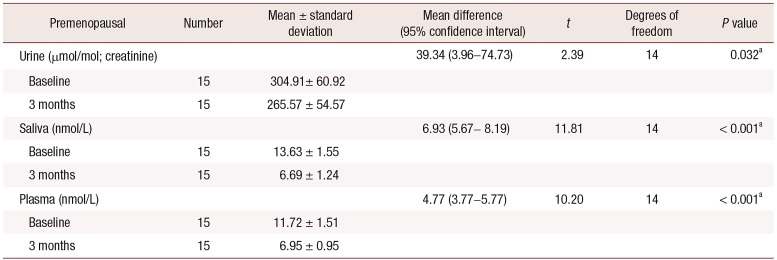
Table 1
Comparison of the premenopausal group at baseline and 3 months
![]()
Even in the postmenopausal group statistically significant reduction from baseline to 3 months was seen. The urine neopterin levels have reduced from 391.22 ± 61.98 µmol/mol to 290.45 ± 52.48 µmol/mol. The saliva neopterin levels have reduced from 15.61 ± 1.83 nmol/L to 7.05 ± 1.41 nmol/L. The plasma neopterin levels have reduced from 13.52 ± 2.51 nmol/L to 7.23 ± 1.09 nmol/L (Table 2). When compared these values in between two groups, at baseline neopterin levels was shown a statistically significant reduction. The P values of urine, saliva, and plasma were 0.001, 0.003, and 0.02, respectively (Table 3). At the same time, when these values were correlated in between two groups at 3 months after NSPT showed insignificant results (Table 4).
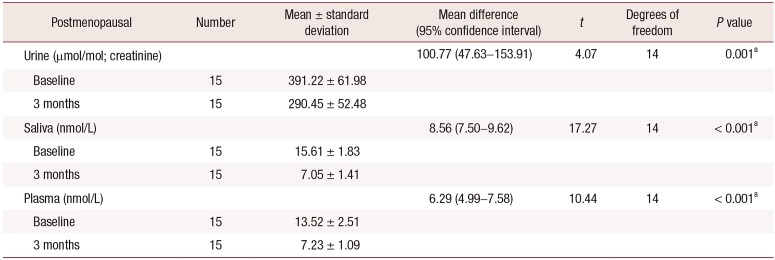
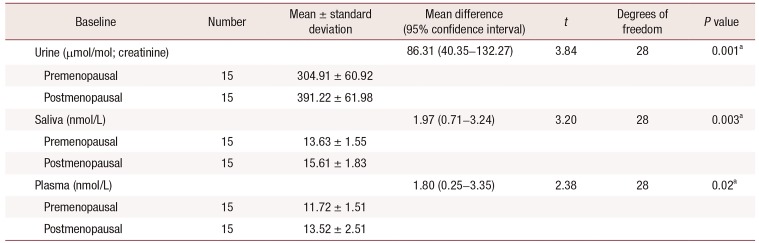
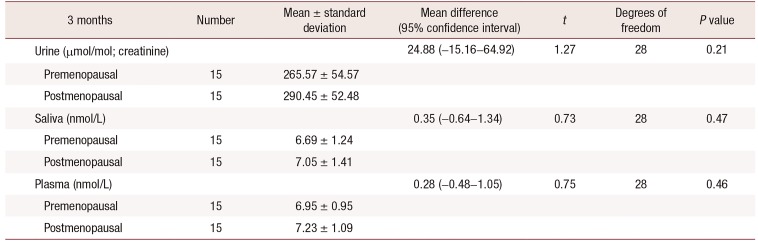
Table 2
Comparison of the postmenopausal group at baseline and 3 months
![]()
Table 3
Comparison between two groups at baseline
![]()
Table 4
Comparison between two groups at 3 months
![]()
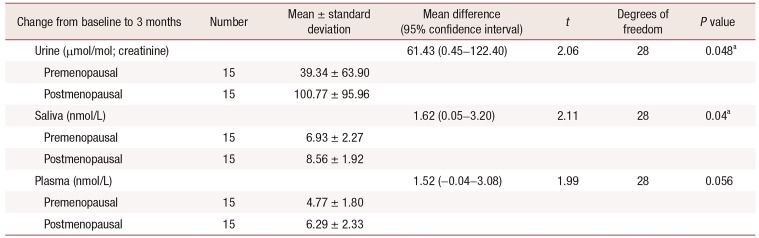
The intergroup comparison of these values from baseline to 3 months showed that the differences in the levels of neopterin between urine and saliva were statistically significant (P value < 0.05), urine (P = 0.048) and saliva (P = 0.04), whereas plasma neopterin levels were not statistically significant (Table 5, Fig. 2).
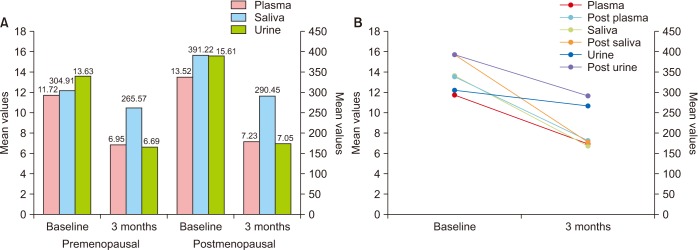 | Fig. 2Comparison of all parameters in both the groups at baseline and 3 months. (A) Neopterin values. (B) Neopterin: pre- and postmenopausal.
|
Table 5
Intergroup comparison of change from baseline to 3 months
![]()
Go to :
DISCUSSION
Periodontitis crop ups when the plaque microorganisms interact with the host defense mechanism. Majority of infiltrating contains mononuclear cells, mainly transmigrated mononuclear phagocytes and lymphocytes [6]. In established periodontitis lesions, the major tissue destruction results from the recruitment of host defense cells via activation of monocytes/macrophages, fibroblasts, lymphocytes, and other cell types [7].
Time-honored periodontal diagnostic parameters like probing depths, bleeding on probing, clinical attachment levels, plaque index, and radiographs assessing alveolar bone level, all these had their ableness and paucities. Moreover inherently limited in only disease history, but not current disease status can be assessed. These traditional measures reveal the damage from past episodes of destruction and require a 2- to 3-mm threshold change before a site can be identified. Advances in oral and periodontal disease diagnostic research are moving toward methods whereby periodontal risk can be identified and quantified by objective measures such as biomarkers [8].
As research proving that periodontitis amelioration is multifactorial in provenience. Not even that the diversified bacteria found is site-specific. A series of molecular techniques were developed, including DNA hybridization, polymerase chain reaction and the genomic hybridization techniques, but these also have their own merits and demerits to quantifying the bacteria. As a result, one of the major challenges in the field of periodontology is to determine biomarkers for screening and predicting the early onset of periodontitis or evaluating disease activity and the efficacy of therapy (diagnostic or prognostic tests) has come into the picture [9].
Many studies and many authors stated that deficiency of estradiol hormones has many untoward effects on the overall body along with gingiva. These hormones may effect on soft tissues as well as on hard tissues like bone. Some exemplifications of those studies are the alterations of immunologic responses, including antigen presentation and expression of apoptotic factors, ultimately leading to cell death [10]. Excess stimulation and production of an inflammatory mediator like prostaglandin E2 and intensification of polymorphonuclear leukocytes along with enhanced chemotaxis in the gingival sulcus were heightened by progesterone [11]. Progesterone has also been shown to down-regulate Interleukin (IL)-6 production by human gingival fibroblasts to 50% of that of control values [12]. Cyto differentiation of stratified squamous epithelium, as well as the synthesis and maintenance of fibrous collagen, has been supremacy by estrogen. Due to hormones action on these cells, the propensity of the epithelial barrier action to bacterial insult and deterioration of defense and repair actions of collagen will be marked-up [13]. Both estrogen and progesterone together have effects on the microcirculatory system during menopause and produce the concomitant effects like endothelial cells and periocytes of the venules swelling, granulocytes and platelets adherence to vessel walls, micro thrombi formation, perivascular mast cells disruption, intensified vascular permeability, and vascular proliferation [14].
In this article, pre- and postmenopause were compared because many proven studies were stating that there are many diversified actions and reactions of menopause on the overall body along with the oral cavity. The extent of severity is distinct in both. For instance, the oral mucosal neural system can be overwhelmed directly by estrogen and thus alter the menopausal women's periodontal health [15]. Low flow rates of saliva will be seen in postmenopausal women than the menstruating women [16]. Periodontal diseases are more often seen in post-menopausal women in a more scathing form, because of the reason for which might be the varying levels of hormones and their effect on the estrogen receptors in fibroblasts and osteoblasts of periodontal tissues [17]. Scardina and Messina [18] examined oral microcirculation in 27 postmenopausal women using video capilloscopy and compared it with controls. Significant differences were found in vascular parameters between cases and controls like loops diameter, vessels tortuosity in labial mucosa and periodontal mucosa density was changed in view of predisposed to inflammation [18]. The ingrained studies have stated that a low systemic inflammatory status was associated with the onset of menopause and slowly the inflammatory condition increases with the downturn of hormones associated with menopause and increased serum levels of proinflammatory cytokines IL-1, IL-6, or tumor necrosis factor α in postmenopause women [19202122]. Osteopenia was more common in premenopausal women than postmenopausal women. But remarkably osteoporosis was more prevalent in postmenopausal women. It symbolizes that the negatively affect bone mass consistently persist in premenopausal as well as postmenopausal period. These factors were combined with estrogen deficiency after the attainment of menopause and then made these women more osteoporotic [23].
In this study, saliva, plasma, and urine were used as diagnostic media. Dialectics behind was unstimulated saliva was used because saliva is a clinically descriptive, biological fluid (bio fluid). That is valuable for novel approaches to prognosis, laboratory or clinical diagnosis, and keeps track of the management of patients with both oral and systemic diseases. It is readily collected and preserves until process and ideal for early detection of disease as it contains distinguishing soluble biological markers (biomarkers). Saliva encompasses multiple biomarkers which make it useful for multiplexed assays. The unstimulated whole saliva is often used in diagnostics as it contains concentrated biomarkers which can easily detectable during assays [24252627].
Plasma was examined because the availability of biomarkers for the diagnosis of oral and systemic diseases, since most of the biomarkers present in saliva and urine can also be detected in blood. But this statement is not always true in case of conjugated steroid hormones; these salivary levels do not correlate with serum. Contrastingly when analyzing glucose or dehydroepiandrosterone sulfate, one must determine saliva/plasma ratio. The reason for this discrepancy appears to be the route of entry of the hormone into the oral cavity. Quite a few studies gave positive correlation results with plasma and neopterin [28293031].
Urine samples particularly early morning first dropouts were collected, considering that it gives valuable accurate values and furthermore because of more concentration, abnormalities can easily be detected. And moreover comparatively free of dietary influences and physical activity changes [32]. As neopterin is eliminated by the kidney, changes in the concentration of neopterin in serum are usually reflected by urine levels. As a matter of fact, there is an equivalent responsiveness of neopterin appraisal either in serum or urine [3334]. The neopterin levels in the body fluids such as serum and urine are increased in some of the diseases which are linked with cellular immune reaction [35].
In this study, three biological fluids saliva, plasma and urine neopterin levels were compared in pre- and postmenopausal women at baseline and three months after NSPT. When we compared individual groups' significant reduction of all the parameters from baseline to 3 months after NSPT was found. And at the same time when compared to two groups only saliva and urine levels were significantly reduced. But plasma reduction was insignificant. These study results are partially supporting and partially contradicting the study done by Cioffi et al. [19] when they compared neopterin gingival crevicular fluid (GCF), saliva and urine in aggressive periodontitis patients, found that significant difference in saliva and insignificant results in urine were found. Pradeep et al. [36] found increased neopterin GCF levels in periodontitis patients compared to healthy individuals. Arjunkumar et al. [37] also got the same results in GCF. Mahendra et al. [38] found same results when compared in saliva, indicating that neopterin levels increase in inflammatory conditions.
Prasanna et al. [39] compared salivary neopterin levels in menopausal groups and its effect on periodontal therapy. They found a statistical significant reduction in premenopausal group compared to postmenopause. The present study results are also supporting the above study results. Finally to conclude this periodontitis and menopausal conditions both are inflammatory in nature, when compared three biological fluids neopterin levels before and after periodontal treatment in combination of these two diseases significant reduction after treatment was seen in the premenopausal group compared to postmenopausal group.
Limitations of this study, duration of the postmenopausal period were not standardized. Our study did not directly relate saliva, plasma, and urinary neopterin levels with observed monocyte or macrophage activation.
Periodontal diseases can hit where one lives at any stage of life, but it is quite common among adults. Women are notably more susceptible to periodontal diseases at specific stages of life, exclusively during menopause and postmenopause. Biomarkers play a paramount role in life sciences and have a preeminent role in diagnosis, monitoring of therapy outcomes, and drug discovery. The challenge for biomarkers is to allow prior detection of disease progression and more booming therapy efficacy measurements. For biomarkers to understand their rightful role in routine practice, it is a prerequisite that their relation to the mechanism of disease progression and therapeutic intervention be more fully understood. Measuring the biomarkers from biological fluids may easily identify the prior indication of disease entity and can also prevent the disease severity by preceding the treatment plan. Considering, periodontal therapy is a paragon of excellence to reduce the inflammatory components among all the body parts, if we consider this as a treatment strategy then the future burden of the malady will be in harmony.
Go to :
 XML Download