

 PDF
PDF ePub
ePub Citation
 Print
Print


Introduction
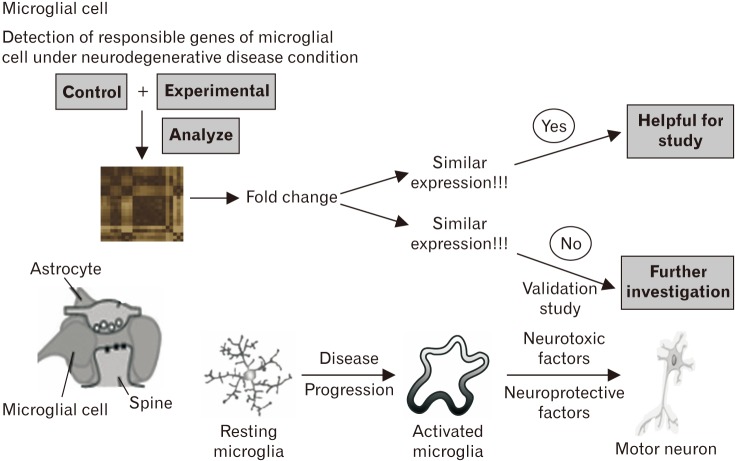 | Fig. 1Microarray study of microglial cell in neurodegenerative disease. This figure describes the activation of microglia is a hallmark of brain pathology. Under neurodegenerative disease condition, the inflammatory response is mediated by the activated microglia. This figure illustrates the gene expression pattern by microarray study in microglial cell under neurodegenerative diseases.
|
Materials and Methods
Listing of genes
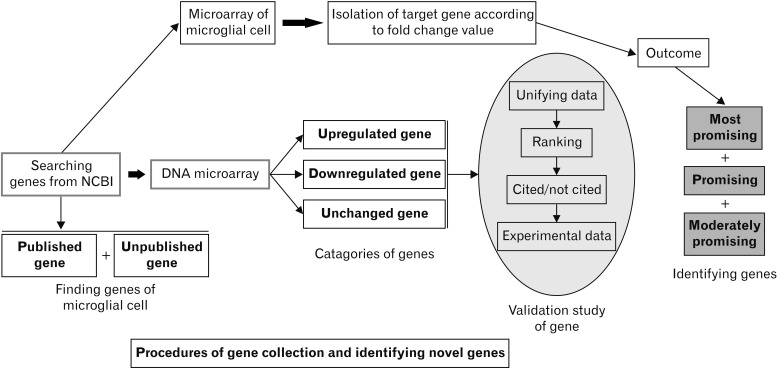 | Fig. 2Working procedure of finding various types of promising gene from microarray study. The procedure of searching genes of microglial cell study in the published research article regarding the DNA microarray to collect the data according to upregulated genes, downregulated genes as well as the unchanged genes. The novel genes are identified by microarray study. This illustration describes how each gene is searched in NCBI for collecting experimental data such as the polymerase chain reaction (PCR), real-time PCR, western blotting, or immunohistochemistry data. In this process, some target molecules are found from the microarray study.
|
Unification of fold-change values
Gene queries and gene ranking
Cited and non-cited genes
Gene searching for experimental data
Results
Positions of high- and low-ranked microarray genes
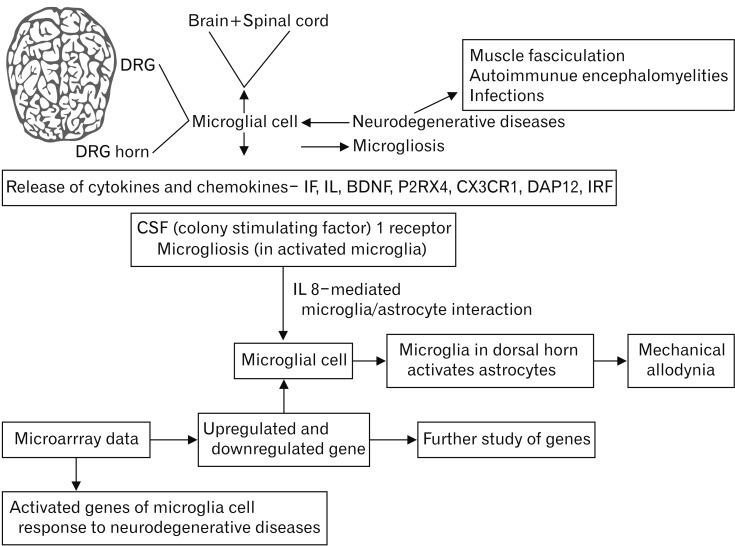 | Fig. 3Mechanism of microglial cell under neurodegenerative disease state. Neuronal cell death occurs under neurodegenerative disease state including motor and peripheral neuron. Microglial cell is activated when neuronal disease occurs. Microglia releases interferon (IF), interleukin (IL), brainderived neurotrophic factors (BDNF), purinoreceptor (P2RX4), chemokine receptor 1 (CX3CR1), DAP12, and IRF when neuropathic pain as well as neurodegenerative disease occur. This diagram depicts how microglial cell becomes active under neurodegenerative diseases. DRG, dorsal root ganglia; CSF, cerebrospinal fluid.
|
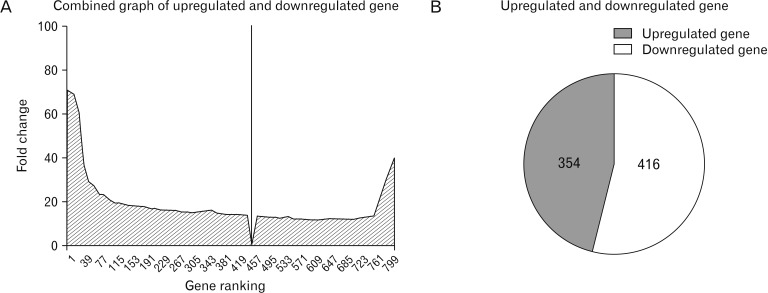 | Fig. 4Linear graph of upregulated and downregulated genes. (A) According to DNA microarray data, the overall numbers of total upregulated and downregulated genes found in the study which are studies related to microglial cell. Analyzing the total genes of upregulated and downregulated and the genes are searched for the experimental data such as polymerase chain reaction (PCR), real-time PCR, and quantitative PCR, etc. which indicates to find out possibility of some genes. (B) Illustration of the total amount of upregulated as well as downregulated gene. The upregulated genes are categorized when the fold-change value is >1 and the downregulated genes are categorized when the fold-change value is <1. The unchanged gene is marked when the fold-change value is 1. The total number of upregulated genes is 456 and the number of downregulated genes is 314 among the total 770 genes.
|
Table 1
Upregulated genes of microglial cell
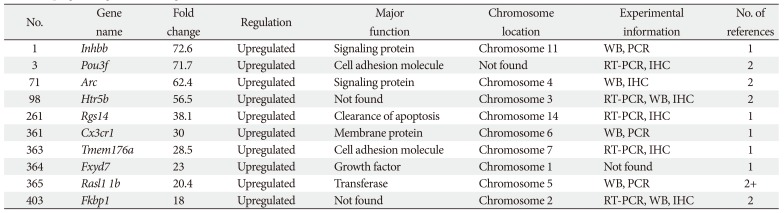
Inhbb, inhibin beta-B; WB, western blotting; PCR, polymeric chain reaction; Pou3f, pau class 3 transcription factor; RT-PCR, real-time PCR; IHC, immunohistochemistry; Arc, activity regulated cytoskeleton associated protein; Htr5b, 5-hydroxytryptamine; Rgs14, regulator of G protein signaling; Cx3cr1, chemokine receptor 1; Tmem 176a, transmembrane protein 176a; Fxyd7, Fxy domain containing ion transport regulator; Fkbb1, polyketide syntheses bb.
![]()
Table 2
Downregulated genes of microglial cell
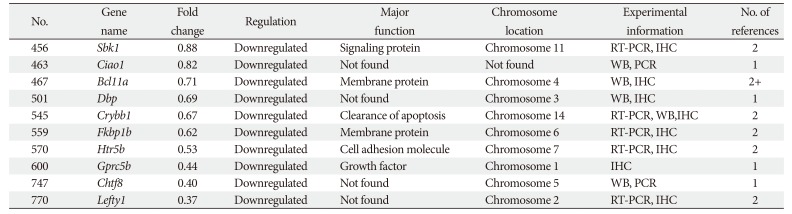
Sbk1, SH domain binding kinase 1; RT-PCR, real-time PCR; IHC, immunohistochemistry; Ciao1, cytosolic iron-sulfur protein assembly protein; WB, western blotting; PCR, polymerase chain reaction; Bcl11A, B-cell lymphoma 11A protein; Dbp, D site of albumin promoter; Crybb1, crystalline beta b1; Fkbp1, peptidyl-prolyl Cis-Trans isomerase; Htr5b, 5-hydroxytryptamine receptor 5B; Gprc5b, G protein-coupled receptor family C, group 5, member B; Chtf8, chromosome transmission fidelity factor 8 homolog (Saccharomyces cerevisiae); Lefty1, left right determination factor 1.
![]()
Classification of microarray genes according to experimental studies
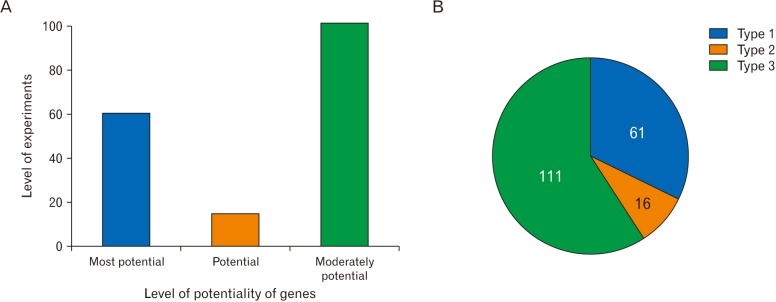 | Fig. 5Potentiality of gene compare to the experimental value. (A) According to the number of fold change, the upregulated and downregulated total genes are arranged in a unified way and according to the data, the genes are classified into most potential, potential, and moderately potential genes for identification. (B) Total amount of experimented genes compare to the published genes.The number of published genes is 770. Among them, 120 genes are most potential, 61 genes are potential, and 20 genes are moderately potential which are named as type 1, type 2, and type 3, respectively.
|
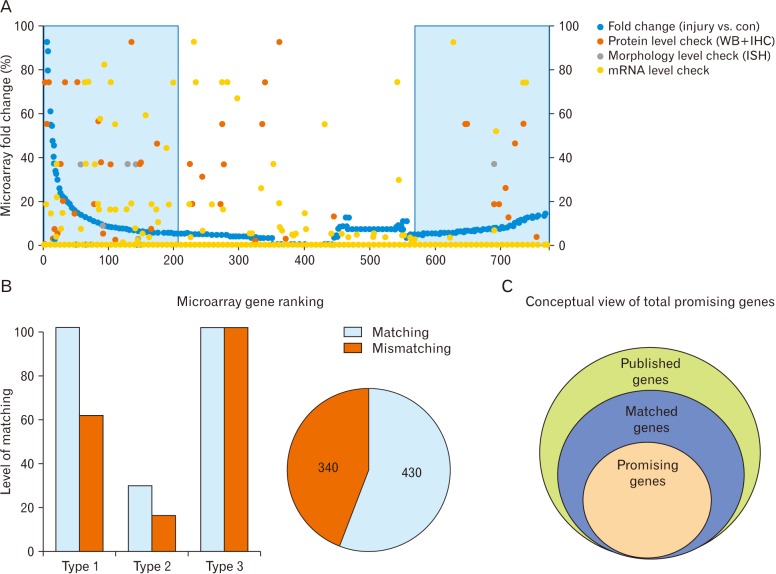 | Fig. 6Comparison between microarray gene expression and the real experimental value. (A) Total promising gene confirmation from the total published genes. As the left side of this graph shows these genes are highly upregulated and the right side of this graph shows highly downregulated, the blue marked area (both left and right) of both sides have good match and these are significant genes in this study. X-axis shows the total number of gene, n=770 and Y-axis shows the fold-change value. IHC, immunohistochemistry; ISH, in situ hybridization. (B) Differential range between the matched and mismatched gene. These figures show microarray data versus real experimental data such as western blotting (WB) and polymerase chain reaction (PCR)/quantitative PCR data. This figure shows the difference between experimental and microarray data. This graph also denotes the identification of find out highly promising gene in this study. (C) Differential range between the published, matched and promised gene. In the pie chart, the green color indicates published genes that occupied large space. Then the blue color indicates matched genes. The least number of promising genes are represented by the yellow color.
|
 XML Download