

 PDF
PDF ePub
ePub Citation
 Print
Print


Introduction
Occlusion is defined as a balance of contacts between the maxillary (upper) teeth and mandibular (lower) teeth [1]. A malocclusion occurs when there is a misalignment of maxillary teeth and mandibular teeth when the jaw close as the teeth were twisted, irregularly arranged or inappropriate to one another, leading to abnormal bite patterns [2]. In adults, malocclusion is the second most common dental diseases that impair functional activity like chewing or speech and may cause imbalance of facial bones [3]. Malocclusion is classified into namely class I (neutrocclusion), class II (distocclusion), and class III (mesiocclusion) according to Angle's classification method based on the relative position of the upper and buccal segments [4].
To determine the type of malocclusion, impression-taking for dental modeling and conventional radiograph cephalometry are taken. Lateral cephalometry tracing consists of manual application of conventional linear and angular measurement [5]. This conventional tracings are limited to landmarks and straight lines and fail to discrete the change of curve, shape, growth, and display as displacement of vector rather than generalized distortion [6]. Moreover, it may cause potential errors and incomplete shape description, confounded shape and size that challenge the validity and reliability of the result interpretation [7]. Therefore, these methods are time constraining for confirmation of diagnosis, does not provide a sufficient description on morphology of craniofacial morphology, and the treatment process becomes disrupted [689].
To overcome these shortcomings, we focused on using geometric morphometrics (GM). GM is a method that utilizes Cartesian coordinates of anatomical landmark for the quantitative analysis of the landmarks [10]. GM describes the details of coordinates in shape after landmark standardization for orientation, scale and position, independent of size [1112]. Besides, GM studies the co-relation of shape components with other factors such as age, sex, race, and population [13]. GM has been used to study growth, treatment effects, and shape variation in various dental researches [14].
Present study has compiled an extensive population database from lateral cephalograms of adult population in Malaysia, which focused on the analysis of malocclusion size and shape using lateral cephalograms on Malaysian population using 2-dimensional (2D) GM method. The difference in craniofacial shape according to the classification of malocclusion was investigated. This research could also be an alternative approach to improve accuracy of the skeletal dental diagnosis in a shorter duration, specifically in malocclusion determination in adult Malaysian population.
Materials and Methods
Study design
This retrospective study was conducted at Polyclinic Universiti Sains Islam Malaysia (USIM) according to the ethics obtained from the Institution of Ethics Committee, USIM (ethnic number: USIM/FPg-MEC/2016/No. (40)). The sample consists of 381 lateral cephalograms taken from the database in the e-clinical USIM and respective archived images from Planmeca Romexi's software from 2012 to 2017. The sample included Malaysian patients regardless of gender or race. These patients consist of three main racial groups namely, Malay, Chinese and Indian. All samples range from 18 to 45 years of age with complete orthodontic records were included in the study. Patients who were non-Malaysian, had craniofacial anomalies, possess mixed dentition and had previous history of orthognathic surgery were excluded from the study. The obtained results were classified according to Angle's classification of malocclusion as below [15].
- Class I (neutrocclusion): normal alignment of mesiobuccal cusp of the upper first molar with buccal groove of the mandibular first molar.
- Class II (distocclusion): the mesiobuccal cusp of the maxillary first molar positioned anterior to the mesiobuccal groove of the mandibular first molar.
- Class III (mesiocclusion): the mesiobuccal cusp of the maxillary first molar positioned posterior to the mesiobuccal groove of the mandibular first molar.
Materials
The Planmeca Romexis software (Helsinki, Finland) from Policlinic USIM was used to retrieve the lateral cephalograms radiograph images. The tpsUtil software (Rohlf, F.J. 2008. tpsUtil, file utility program. version 1.40. Department of Ecology and Evolution, StateUniversity of New York at Stony Brook) was utilized in the landmark application. MorphoJ (version 1. 06d) software (Faculty of Life Sciences, University of Manchester, Manchester, UK) and SPSS version 21 (IBM Corp., Armonk, NY, USA) were used for the data analysis and visualization of the 2D data. Another software namely, Excel, Notepad++ (SourceForge Media, LLC dba Slashdot Media, La Jolla, CA, USA) and Inscape (Boston, MA, USA) were used in managing the data.
Landmarking application
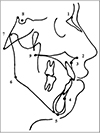
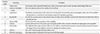
A total of nine 2D landmarks was designed and acquired using tpsUtil version 1.40. Landmarks were chosen to correspond to those commonly used in the traditional metrical and geometric morphometric systems and familiar to most orthodontists in lateral cephalogram tracing for malocclusion determination (Table 1, Fig. 1) [16]. A pilot study was performed in which measurements were taken on different days and by the different observers to evaluate intra- and interoperator reliabilities analysis.
Shape analysis and statistical analysis
MorphoJ software version 1.06d was used to analyze the 2D coordinates of the landmarks. Generalized Procrustes analysis (GPA) was done on the raw landmark coordinates from all lateral cephalograms to eliminate the non-shape variation of the samples. This process involved translating, rescaling, and rotating the configurations relative to each other to minimize the total sum of squares [17]. The scaling procedure adjusts the landmark coordinates such that each mandible had a unit centroid size, which was used as a biologically meaningful expression of the overall size of the landmark configuration, and thus of the mandible [18]. A series of principal component analysis (PCA) was used to explore the relationships between samples of different malocclusion. The shape difference revealed by the PCA was visualized and explored using principal component (PC) plots and wire-frame.
Discriminant function analysis with cross-validation was used to assess classification accuracy. Both analyses use the PC scores from GPA/PCA of the sample. The number of variables relative to the number of individuals tends to be large in geometric morphometric analyses as there are two coordinates per landmark. Procrustes ANOVA assessed the variation among individuals and measurement of error in the samples. Canonical variate analysis (CVA) investigates the shape characters that best distinguish significant groups between different malocclusion groups. The angular of craniofacial skeletal measurements were also measured. Statistical analyses were performed using MorphoJ, Gen stat version 8.10 and SPSS version 21.0.
Results
Demographic data
A total of 381 lateral cephalograms were collected and comprised of 178 patients (46.7%) from class I, 128 patients (33.6%) from class II, and 75 patients (19.7%) from class III malocclusions. Malaysians ranged from 17 to 49 years old were included in the study (mean, 23.38 years; median, 21.90 years); 95 males and 286 females were pooled together for all analyses.
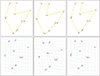
Generalized Procrustes analysis
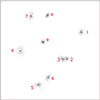
GPA produces a new matrix of Procrustes coordinates, which superimposed each set of landmarks before rescaling and rotating to a centroid size. Fig. 2 showed scatterplot of the superimposed landmark configurations from GPA that represented the morphological shapes of nine landmarks on all 381 lateral cephalogram radiographs.
Principal component analysis
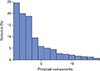
PC analysis displayed multivariate analysis and major features of shape variation in a data set. Fig. 3 showed the amount of variance for all classes of malocclusion. There was a gradual decrease in percent variance with a drop between PC1 and PC14 exhibiting the largest difference. The first-three PCs were statistically meaningful and portrayed as 63.24% of total shape variability, with PC1 account for the most significant variance (24.47%), PC2 described 19.98% and PC3 18.80% (Fig. 4).
The lollipop graph with shape changes and percent variance of the first-three PC accounts for the most variance in the entire sample generated by MorphoJ. PC1 contributed to 24.47% of the total variance in the sample, while PC2 contributed to 19.98% of the total variance, and PC3 contributed to about 18.80% (Fig. 4). The lollipop graph represents the changes of its mean shape and its variation attributed to PC1 to PC3. Each point represents a landmark on the mandible, with the line representing the mean shape, and the blue line representing the distance and amount of variation exhibited on that location (Fig. 4).
All nine landmarks exhibited some level of variation with B-point, menton, gonion, and porion, being the most prominent. Sella and posterior nasal spine showed little or no variance in the population, while the remaining landmarks exhibited moderate variance (Fig. 4). In this study, the PC was also presented in the wire-frame graph by MorphoJ. The wire-frame graph showed the comparison shape between light-blue color and dark-blue color. Dark-blue lines represent shape change in positive and negative direction; light-blue lines represent the mean shape (Fig. 4).
Procrustes ANOVA
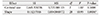
The outputs of the Procrustes ANOVA analysis were presented in separate ANOVA tables for centroid size and shape (Table 2). In this study, there were no differences in terms of centroid size (P=0.361) while the Goodall's F statistic (F) showed a low amount of difference in centroid size (F=1.02). In contrast, there were significant differences in shape (P<0.001) with a high F value of (F=10.95).
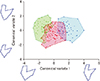
Canonical variate analysis
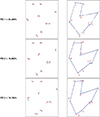
CVA shows that there was substantial individual overlap between the groups. There was significant difference between class I, class II, and class III malocclusions in mean shape. The class II and class III populations exhibited the highest Mahalanobis distances. The wire-frame graph showed the comparison of mean shape in positive and negative directions with scaling factor of −4 to 6 for CV1 and CV2 (Fig. 5). The mean of craniofacial shapes of the three malocclusion groups was described in Fig. 6. In class III group, the average mandible was more prognathic while in class II group, the average mandible was more retrognathic.
Craniofacial skeletal angular
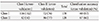
Our study demonstrated that there were significant differences for ANB angle (A point-Nasion-B point) across all malocclusion groups. Class II had the widest ANB angle while class III had the most acute ANB angle. However, the gonial angle (menton-gonion-porion) and cranial base angle (nasion-sella-basion) were not statistically significant between all groups (Table 6).
Discussion
Difference in malocclusion and craniofacial phenotype is contributed by variation in shape, size, and inclination of the maxilla [19]. Geometric morphometric analysis is more reliable than conventional cephalometry as it provides visual morphology differences at the actual sites and does not require conventional reference lines [20]. In this study, geometric morphometric method was used to identify the relative skeletal and dental shape components in the morphometric space using lateral cephalograms in class I, class II, and class III malocclusions in adult Malaysian population. Classification of malocclusion is significant in our study, suggesting a close correlation between craniofacial morphology and its malocclusion.
Present study showed the highest Mahalanobis distances were exhibited by the class II and III malocclusion samples. Although there are differences in mean shape for the three classes of malocclusion, the distribution of individual's craniofacial shape overlapped within the groups (Fig. 5). These results were similar with previous study performed on Caucasian population [12]. Our study showed that class II and class III malocclusion groups overlapped with the class I group respectively, suggesting that craniofacial shape is not the single factor of malocclusion, but it does significantly contribute to misalignment of teeth [1219]. Similar findings were shown using class II and class III malocclusion where it showed that these groups were also overlapped with class I in a canonical variate analysis of American population [2122].
ANB angle has been commonly used for anteroposterior association of skeletal jaw which ranges from 1° to 5° according to Steiner's analysis [23]. ANB angle is an important factor of cephalometric parameter in malocclusion [24]. Our present study showed a significant difference of ANB angle between all malocclusion groups in Malaysian population, which is coincided with the results of previous studies done on Pakistani population [25]. Another study inform the northeastern region of Romania suggested that the ANB angle had quantitative characteristics that represent a relationship of bony structures of class III malocclusion [26]. However, present study showed that there were no differences in gonial angle between groups. Similarly to findings by Okşayan et al. [27], which found that, there were no significant differences in gonial angle values between all malocclusion groups using panoramic radiographs and lateral cephalometric radiographs. In addition, the cranial base was similar for all malocclusion groups (Tables 3, 4, 5). These suggested that the cranial base and gonial angle have less relation with malocclusion types. These results were similar to the study carried out by Mitteroecker and Gunz [28] which claims that the morphology of cranial bases were alike in class III malocclusion patients. The cranial base angle range between all classes was also small which is in accordance with previous studies [2122]. However, in other studies, they suggested that the cranial base is one of the contributing factors for class II or class III development [2129].
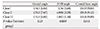
Discriminant function analysis is useful in identifying if the plot of landmarks is effective in category prediction [30]. The classification was mostly accurate especially for class II and class III using skeletal landmarks, with success rates of 80% and 71% respectively (Tables 3, 4, 5), demonstrating its distinct craniofacial shape. In Malaysia, previous study on the population-specific sex discriminating osteometric standards on crania for human identification. About 22 parameters of crania were measured. Results showed that all parameters were significantly higher in males than in females except for orbital height of the left eye by independent t test (P<0.01). The classification accuracy ranged from 78.2% to 86.2%. The cranium can be used to distinguish between males and females in the Malaysian population [31].
Our study limitations include gender distribution within groups and data restricted to 2-dimensional. Despite this limitation, our outcomes provided a novel insight into geometric morphometric analysis of variation in craniofacial shape within various malocclusion groups for adult Malaysian population.
In conclusion, craniofacial shape can be correlated within malocclusion groups, with maxillary shape showed more variation compared to the cranial base. An extensive population database from multiple landmarks from lateral cephalographs of the Malaysian population was compiled, which will initiate a new database for cross-platform software as a new diagnostic tool that will shorten the duration of diagnosis of the orthodontic patient.


 XML Download