

 PDF
PDF ePub
ePub Citation
 Print
Print


Introduction
Tuberculous meningoencephalitis (TM) accounts for approximately 2% of all infectious diseases affecting the central nervous system1. TM is considered to be an acute progressive form of tuberculosis (TB), and TM mortality rates vary from 16% to 55%23. The well-timed diagnosis and prescription of intense treatment are of vital importance for reducing the rates of mortality and severe complications in TM34.
The current trend to reduce the duration of TB treatment is no exception to TM5. The treatment of patients with TM worldwide is consistent with the model of short-term chemotherapy in patients with pulmonary TB. However, the issues of the anti-TB therapy regimen and its duration are still under debate. According to World Health Organization (WHO) recommendations, anti-TM treatment lasts for 9–12 months of anti-TB therapy, including 2 months of the intensive phase67.
It has been reported that each form of TB, including TM, is associated with the immunopathological inflammation developed due to abnormal microcirculation and insufficient supply of tissues with oxygen and nutrients, which can negatively affect the delivery of anti-TB drugs to the inflammatory site38. In addition, TM treatment may face a major problem, namely the inadequate concentration of anti-TB drugs at the beginning of treatment. Thus, modern anti-TB therapy should aim at reaching the maximum concentrations of anti-TB drugs within a short period, which provides conditions for reaching the sufficient content of anti-TB drugs in the cerebrospinal fluid (CSF) and the corresponding clinical effect in patients with TM9.
Intravenous anti-TB therapy is believed to be one of the methods that may help achieve this effect10. Isoniazid (H) and ethambutol (E) are supposed to be extremely effective anti-TB drugs6. However, little is reported about the experience of H and E intravenous administration in patients with TM and human immunodeficiency virus (HIV) infection in modern conditions.
Thus, the purpose of our study was to evaluate the effectiveness of intravenous isoniazid and ethambutol administration in patients with new sputum positive drug-susceptible pulmonary TB/TM and HIV co-infection in the intensive phase of treatment.
Go to : 
Materials and Methods
1. Patients
This prospective, randomized, comparative, open, two parallel study on the comparative evaluation of effectiveness and tolerability of the treatment with the use of intravenous anti- TB drugs (isoniazid and ethambutol) and standard therapy based on orally administered anti-TB drugs in patients with new smear-positive drug-susceptible TB with TM and HIV coinfection in the intensive phase of treatment was conducted in National Institute of Phthisiology and Pulmonology named after F. G. Yanovskyi NAMS of Ukraine (Kyiv, Ukraine) and Kharkiv National Medical University (Kharkiv, Ukraine). Our research lasted from September 2012 to August 2018.
The study involved 54 patients with new sputum positive drug-susceptible pulmonary TB/TM and HIV co-infection aged between 20 and 60 years, including 15 females and 39 males. All patients enrolled in this study were diagnosed with TM and HIV infection. The patients were randomly subdivided into two groups by a computer-generated sequence. Group 1 consisted of 23 patients (42.5%) with pulmonary TB/TM and HIV infection treated with the intravenous chemotherapy (H and E) and orally (rifampicin [R] and pyrazinamide [Z]). Group 2 included 31 patients (57.4%) with pulmonary TB/TM and HIV infection treated with H, E, R, and Z orally. They served as control subjects.
The randomization resulted in equal distribution of baseline characteristics: age, sex, height, body weight, severity, and various manifestations of the disease (Tables 1, 2).
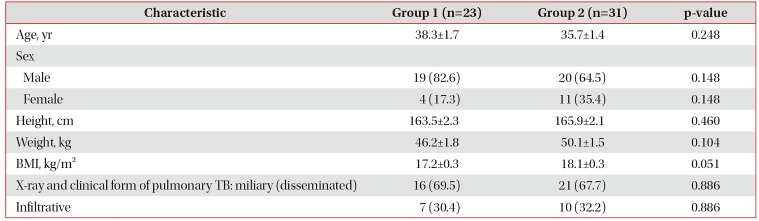
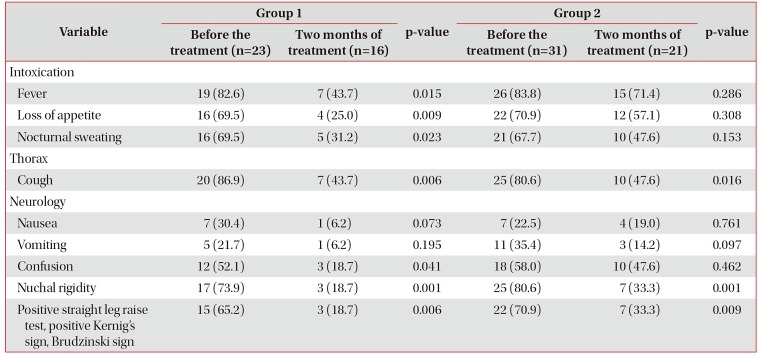
Table 1
Baseline characteristics of patients with TM and HIV infection
![]()
Table 2
Frequency of major clinical symptoms among patients with TM and HIV infection (%)
![]()
All patients enrolled in our research were at a clinical stage 4 of HIV11.
2. Treatment regimen
Patients from group 1 were treated with the intravenous chemotherapy, including isoniazid at a dose of 100 mg/mL in 5 mL intravenously (intravenous jet, slowly) by stream infusion once per day for 60 days starting upon admission to the hospital) and ethambutol (100 mg/mL) at a dose of 20 mL in 200 mL of 5% glucose solution intravenously (intravenous drips, slowly) by drop infusion once per day for 60 days starting upon admission to the hospital, rifampicin and pyrazinamide administered orally. Intravenous anti-TB drugs administration was performed via an ulnar vein or central venous catheter. The patients from group 1 received parenteral chemotherapy only during the intensive phase of treatment (60 doses). Anti-TB drugs were prescribed orally at standard doses during the continuation phase. In case of the prolongation of intensive phase, anti-TB drugs were administered like in group 2.
All patients from group 2 received standard chemotherapy consisting of orally administered isoniazid, rifampicin, pyrazinamide, and ethambutol with a dose reduction after the intensive phase of the therapy. TM treatment included the intensive and prolongation phases and lasted for at least 12 months in accordance with WHO guidelines. Doses of anti-TB drugs with respect to the body weight were calculated according to WHO recommendations12. In addition, the patients were prescribed with dexamethasone or prednisolone. Dexamethasone or prednisolone was prescribed to 21 patients (91.3%) from group 1 and to 30 patients (96.7%) from group 2 (p=0.389). Anti-TB drugs were procured via the Ukrainian centralized national supply system.
All patients with TM and HIV infection were treated using antiretroviral drugs in accordance with WHO guidelines. This treatment included the following groups of drugs: non-nucleoside reverse transcriptase inhibitors and protease inhibitors13.
3. Randomization, clinical endpoints, and exclusion/inclusion criteria
Inclusion criteria in this study were the presence of Mycobacterium tuberculosis (MTB) sputum positive newly diagnosed pulmonary tuberculosis, susceptible to anti-TB drugs, TB meningoencephalitis, and HIV infection, whereas exclusion criteria were the following: pregnancy; lactation; the inability to give written consent to participate in the study; severe psychosis; poliomyelitis (including in medical history); acute hepatic and/or renal insufficiency; amyloidosis; malignant oncological pathology; the presence of concomitant decompensated diseases or acute conditions that can significantly affect the outcome of the study; resistant MTB; the refusal of avoiding alcohol consumption during the treatment period.
The primary objective in this study was to determine the effectiveness of the therapy in patients with pulmonary tuberculosis and TM with HIV infection. To do this, we evaluated the clinical effectiveness of the treatment in the form of the disappearance or reduction of pulmonary, intoxication and neurological TB symptoms; sputum conversion; positive radiological dynamics in the lungs.
Randomization was performed on the basis of PC-generated successive random numbers. Ten patients were excluded from the study as a result of the exclusion criteria as early losses. Nine of them were eliminated due to MTB resistance to anti-tuberculosis drugs and one patient refused to participate in the study after randomization.
4. Laboratory evaluation
A standard microbiological examination of a sputum smear stained using the Ziehl-Neelsen and culture Lowenstein-Jensen methods and BACTEC Mycobacterial Growth Indicator Tube (MGIT-960) was conducted prior to the enrollment in the study and on days 30, 60, 90, and 150 from the beginning of the treatment. Isolates of MTB were tested for sensitivity to the first- and second-line anti-TB drugs with commercially available kits (Tulip Diagnostics Pvt Ltd., Goa, India).
MTB complex DNA was isolated from the sputum and CSF using an automatic Xpert MTB/RIF rapid test (Cepheid Inc., Sunnyvale, CA, USA). In addition, rpoB gene mutation that provides the resistance to rifampicin was detected14.
Color, glucose and protein concentrations and the cell count per 1 mL (lymphocytes and neutrophils) were determined in the CSF. The content of protein was measured qualitatively using Pandi's and Nonne-Apelt tests. In addition, we assessed the presence of acid-fast bacilli (AFB) by a Ziehl-Neelsen test and MTB by the bacteriological method determining the sensitivity to anti-TB drugs and performing a rapid Xpert MTB/RIF.
The diagnosis of HIV infection in all the patients examined in this study was verified by a positive result of a rapid (CITOTESTHIV 1/2) HIV test (immunochromatographic analysis), the presence of specific antibodies to HIV was confirmed by enzyme-linked immunosorbent assay (ELISA).
The following parameters of cell-mediated immunity were analyzed: absolute and relative CD3, CD8, CD4 lymphocyte count. The amount of CD4 positive lymphocytes in the blood did not exceed 80 cells per microliter.
There are converging lines of evidence that patients with TM and HIV infection suffer from intestinal malabsorption, which in turn can reduce the absorption of drugs administered orally1516. Thus, we determined the concentration of anti-TB drugs (H and E) prescribed intravenously in blood serum using a chromatographic method with the help of a Perkin Elmer high-performance liquid chromatography (PerkinElmer Inc., Waltham, MA, USA).
5. X-ray examination
Pathological features (e.g., the severity of the disease and changes in the localization of the process in the lungs) were assessed via X-ray examination. We observed various clinical and X-ray forms of pulmonary TB in patients with TM and HIV infections, which are mentioned in Table 1.
X-ray monitoring of patients was repeated every 2 months starting from the beginning of treatment until the end of the intensive phase.
6. Statistical evaluation
Statistical analyses were performed using a StatSoft STATISTICA version 8 (Tulsa, OK, USA) and Excel applications. We used the Kolmogorov-Smirnov test for the assessment of normality. Based on the results of the Kolmogorov-Smirnov test, the standard parametric Student's t-test was chosen to analyze the obtained data statistically17. The difference was considered to be statistically significant at p<0.05.
7. Ethics approval and consent to participate
The design of the study was approved by the Ethics Committee of the National Institute of Phthisiology and Pulmonology named after F. G. Yanovskyi NAMS of Ukraine, Kyiv, Ukraine (No5/2012 d.d. June 8, 2012). It was conducted according to the Declaration of Helsinki standards. All patients signed a written informed consent and explicitly provided permission for treatment and blood tests, as well as for the collection of relevant clinical data.
Go to :
Results
1. Pre- and post-treatment changes in cardinal symptoms
Some clinical symptoms before and after the treatment were to a greater extent less severe in group 1 compared with group 2, which is represented in Table 2.
Against the background of the TM clinical dynamics, we revealed the corresponding changes in the complete blood count test. Its parameters were mainly statistically significant in group 1 compared with group 2. Thus, when comparing the results of complete blood count tests, we observed that the most statistically significant indices before and after the 1-month-long chemotherapy were higher lymphocyte, monocyte cell counts and a lower erythrocyte sedimentation rate in patients from group 1 than in group 2 (p<0.05).
2. Adverse effects and death
During the treatment, we observed gut-related adverse effects of anti-TB drugs in 18 patients (35.1%) with TM and HIV co-infection, including four (17.3%) from group 1 and 15 (48.3%) from group 2. In addition, the difference was statistically significant in such patients (p=0.022).
Brain edema, multiple organ failure, and intoxication were the major causes of death among patients. The number of lethal cases related to the treatment duration in patients with TM and HIV infection is available in Table 3.
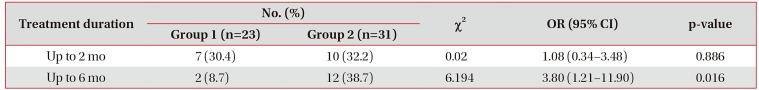
Table 3
Lethal cases in relation to the treatment duration in the examined patients with TM and HIV infection (%)
| Treatment duration | No. (%) | χ2 | OR (95% CI) | p-value | |
|---|---|---|---|---|---|
| Group 1 (n=23) | Group 2 (n=31) | ||||
| Up to 2 mo | 7 (30.4) | 10 (32.2) | 0.02 | 1.08 (0.34–3.48) | 0.886 |
| Up to 6 mo | 2 (8.7) | 12 (38.7) | 6.194 | 3.80 (1.21–11.90) | 0.016 |
![]()
3. Changes found in the CSF
All patients with TM and HIV co-infection underwent a lumbar puncture with the subsequent CSF investigation. When studying the CSF after the patients' hospitalization, we observed that the CSF in all patients was colorless. The average cell count was revealed to be 32.9±4.9 cells/mL. The protein content reached 0.9±0.1 g/L. The amount of glucose in the CSF was found to be 1.3±0.1 mmol/L in patients with TM and HIV infection. The study of white blood cells in the CSF revealed that lymphocytes prevailed over neutrophils in 44 patients (81.4%) with TM and HIV infection, whereas neutrophils dominated in 10 patients (18.5%). According to the results of CSF microbiological studies, MTB was detected in only 18 patients (33.3%) in the CSF precipitate. Statistically significant changes in the parameters of CSF between the two groups were not revealed (p>0.05).
4. Post-treatment results of bacteriological studies
Prior to the treatment and during the first month, the presence of MTB in sputum was observed in all patients with TM and HIV infection, evidenced by microscopy, culture methods, as well as molecular and genetic approaches. MTB resistance to the first-line anti-TB drugs was not revealed. As for the numnumber of patients, the rates of sputum AFB smear positivity were significantly lower in group 1 than in group 2 at the end of the intensive phase (2 months) of the anti-TB treatment (p<0.05) (Table 4).
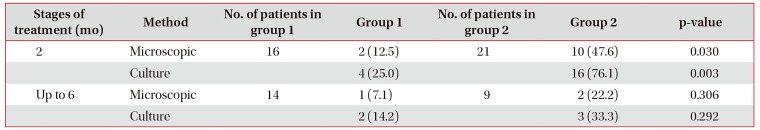
Table 4
Indicators of sputum conversion, evidenced by microscopic and bacteriological sputum examination patients with TM and HIV infection
Values are presented as number (%).
Number is the number of sputum MTB-positive patients in each group, excluding the died ones; group 1 included patients with pulmonary TB/TM and HIV infection treated intravenously; group 2 consisted of patients with pulmonary TB/TM and HIV infection treated orally.
TM: tuberculous meningoencephalitis; HIV: human immunodeficiency virus; MTB: mycobacterium tuberculosis; TB: tuberculosis.
![]()
5. Post-treatment chest X-ray examination
Results of chest X-ray examinations indicated positive X-ray dynamics during treatment. In particular, we observed consolidation and resorption of focal and infiltrative changes, partial or complete closure of cavities in the survived patients with TB. Positive X-ray dynamics was observed in 18 patients (33.3%) with TB (n=12, 52.1% from group 1 and n=6, 19.3% from group 2, p=0.014). Negative X-ray dynamics manifested as a progression of the specific process in the lungs and intrathoracic lymph nodes in 31 patients (57.4%) with TB (n=9, 39.1% from group 1) and 22 (70.9%) in group 2 (p=0.023). Changes in chest X-ray examinations were not observed in five patients (9.2%) (n=2, 8.7% from group 1 and n=3, 9.6% from group 2, p=0.902).
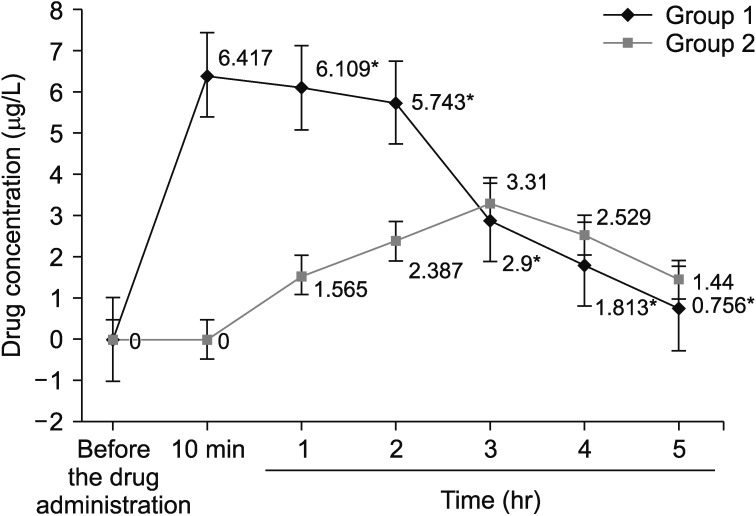
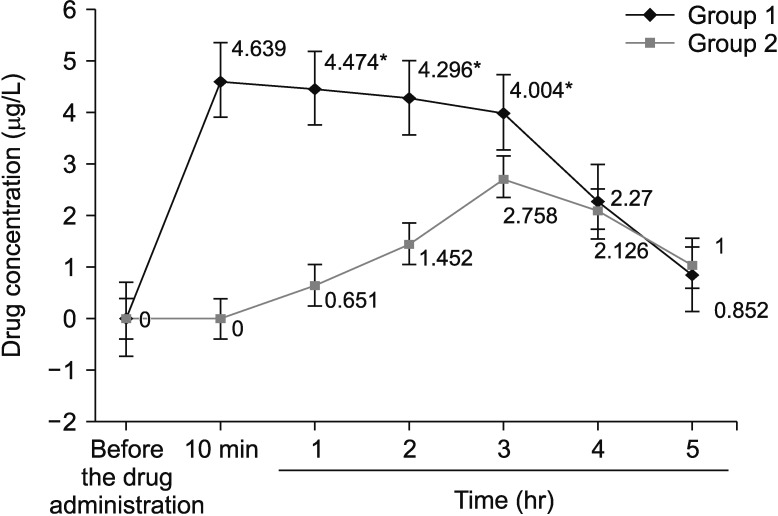
6. Isoniazid and ethambutol concentrations
E and H intravenous administration was accompanied by significantly higher mean concentrations of them compared with their oral intake during 2 and 3 hours after their administration, respectively. Four hours after the E intake and three hours after the H administration, a reverse trend was observed, i.e., blood levels of orally consumed anti-TB drugs dropped, as opposed to both anti-TB drugs administered intravenously whose concentrations decreased (Figures 1, 2).
Go to :
Discussion
Intensive intravenous anti-TB therapy with H and E for 2 months improved the effectiveness of drugs without increasing the rate of side effects, even significantly decreasing it in some cases, mainly due to reduction of the rate of gastrointestinal adverse effects. In addition, the survival rate of patients with TM and HIV infection was observed to be higher.
One of our tasks was to determine H and E intravenous levels in patients with TM and HIV co-infection. Several studies have demonstrated that H, a key drug for the treatment of TM, can easily enter the CSF, whereas E does not flow freely into the CSF and is not considered to be a drug of choice for this pathology18. However, the intravenous H and E administration allowed us to achieve better effectiveness in the treatment of patients with TM and HIV co-infection compared with the control group. It is stated in some papers on the treatment of patients with TM that H, R, and Z are the only first-line drugs that reach a higher concentration in the CSF, while there are virtually no reliable data on the E level in the CSF1819. It has been known that TM and HIV co-infection is usually accompanied by a generalized TB process in the body20. In this case, it is required to maintain adequate concentrations of anti-TB drugs in the blood, and the E administration is necessary10. One of the bioavailability characteristics is the maximum H and E concentration in blood serum and the time required to reach it21.
E and H administration can be considered to be another approach to improving the treatment of TM and HIV infection. E and H orally are characterized by a low concentration in the CSF718; therefore its effectiveness is low in patients with TM. Thus, the higher H and E exposure provided in this study suggests a combination of higher doses, intravenous route of administration, and non-linear pharmacokinetics of these anti-TB drugs. This elevated H and E concentration may be relevant, since anti-TB drugs have route-dependent effects2223.
Elevation of H and E concentrations does not significantly increase the pharmacological toxicity. Although our study had not been designed to assess the mortality rate, we observed that the administration of high intravenous H and E doses during the intensive phase of treatment led to a significant reduction in the mortality rate within 6 months of chemotherapy. Moreover, our study was open, so that we can not exclude potential biases in people providing treatment and care for patients. As a result of the intravenous H and E administration, major clinical manifestations and X-ray signs of pulmonary TB/TM were more likely to be eliminated in the examined patients against the background of positive changes in the complete blood count test, smear sputum conversion and more pronounced positive X-ray dynamics in the lungs compared with those administered anti-TB drugs orally. The clinical manifestations such as intoxication, chest, and neurological syndromes in patients with pulmonary TB/TM and HIV infections disappeared with a higher rate in patients from group 1 compared with group 2. Against the background of clinical dynamics in patients with pulmonary TB/TM and HIV infectiom, we observed the corresponding changes in blood tests. Such changes were mainly statistically significant in group 1. Chest X-ray examinations in dynamics showed a significant positive radiological dynamics during treatment in the form of consolidation, resorption of focal and infiltrative changes, partial or complete closure of cavities in patients with pulmonary TB/TM and HIV co-infection in the main group compared with the control group. This radiological picture was observed in the survived patients during treatment. Furthermore, the intravenous administration of H and E was accompanied by significantly higher concentrations of the drugs in blood compared with their oral administration.
There are several limitations to our study, which were primarily due to lack of funds. Firstly, the study of CSF was performed only to verify the diagnosis of TM, but not for screening. Secondly, studies on sputum smear conversion were performed only once a month (up to 90 doses) and 150 doses of anti-TB drugs in case of sputum smear conversion. If the patient did not experience sputum smear conversion, then the test was conducted every month. In this case, our priority was to establish whether the patient was sputum smear converted at this stage of treatment or not. Thirdly, the patients who met our inclusion criteria were randomized, but the outcomes of susceptibility bacteriological tests were received after the randomization of patients. Thus, such patients were considered early losses. Therefore, we prescribed the therapy in accordance with the group, but if the MTB was found to be resistant to anti-TB drugs, such patient was eliminated from the research according to the design of the study due to drug-resistant TB. Fourthly, all patients were tested for HIV. If the outcome was positive, the patient started obtaining the appropriate therapy according to his or her group. At the same time, if the diagnosis of HIV was not confirmed by ELISA and polymerase chain reaction, the patient was considered early loss.
Despite such limitations, we believe that our results contradict the current model of TM and HIV infection treatment and support the current approach on the maintenance of adequate high doses of first-line drugs in the blood of patients with TB. Selection of the optimal 2-month-long intravenous anti-TB therapy regimen facilitates the implementation of intensive therapy of TM in regions where it is required.
Intravenous H and E chemotherapy during the intensive phase of therapy reduces the rate of mortality among such patients compared with the oral administration of the aforementioned drugs. H and E intravenous administration was associated with significantly higher mean serum levels of the drugs used compared with those administered orally. Intravenous H and E intake in patients with pulmonary TB/TM and HIV coinfection do not cause additional side effects compared with the control group.
Go to :
 XML Download