

 PDF
PDF ePub
ePub Citation
 Print
Print


INTRODUCTION
Preterm birth accounts for approximately 10% of all pregnancies and is the main cause of neonatal death. The death rate of preterm infants from preterm birth is approximately 70% [1]. Although a number of drugs are currently used to prevent preterm births, rates of preterm labor and miscarriage are still high and have been continuously increasing, especially with the increasing number of pregnancies at advanced maternal ages [2]. Thus, elucidating the complex pathophysiology of preterm labor and miscarriage, and identifying effective drugs are very important.
Pregnancy and delivery are regulated by several close connections between hormones and cytokines. A large number of factors that are important for regulating pregnancy and delivery are produced in pregnancy-related tissues, including the placenta and amnion. An imbalance among these factors may cause preterm labor and birth, which could be fatal to both the mother and fetus [3].
Preterm labor and miscarriage may occur in stressful situations, such as a surgical operation or infection during pregnancy [4]. In the dental clinic, pharyngeal and buccal abscesses and facial bone fractures are inevitable surgeries in pregnant patients. Drugs used for surgeries other than obstetric surgeries during pregnancy must relax the mother's uterus as much as possible to prevent preterm birth, while anesthetics used for cesarean section or drugs used for pain relief during delivery must have a minimal impact on the myometrium of the mother as well as a minimal negative effect on the fetus.
Delivery due to preterm labor eliminates the opportunity for the maturation that can be necessary for survival of the fetus. Problems that include low birth weight and premature development of the lungs occur more frequently and the survival rate decreases with the gestational age at delivery [5]. Thus, studies have continued to evaluate drugs that effectively reduce uterine contraction and have a minimal effect on the safety of the mother and fetus.
Remifentanil is an ultra-short-acting µ-opioid receptor agonist characterized by fast onset of action and degradation [6]. Although remifentanil is an opioid analgesic that is commonly used for general anesthesia and sedation in oral and maxillofacial surgery, no study has investigated the effects of remifentanil on amniotic epithelial cells, which produce the factors required for the regulation of pregnancy and delivery. This study investigated the effects of remifentanil on the factors related to uterine contraction and its mechanism of action on amniotic epithelial cells.
MATERIALS AND METHODS
1. Cell culture
WISH human amnion cells were purchased from the American Type Culture Collection (CCL25; ATCC, Manassas, VA, USA). The cells were cultured in EMEM medium (30-2003; ATCC) supplemented with 10% fetal bovine serum (Gibco, Carlsbad, CA, USA) in a 5% CO2 atmosphere at 37℃. Three days later, adherent cells were removed and the culture was continued, with replacement of the medium twice a week.
2. Remifentanil treatment
Commercially available remifentanil was used (GlaxoSmithKline, Brentford, UK). It was diluted in culture medium and added to cell cultures at concentrations ranging from 0.001–1 µg/ml for 1 h. The cells were then treated with growth medium only or with medium containing lipopolysaccharide (LPS; 1 µg/ml) for 24 h.
3. Nitric oxide (NO) assay
WISH cells were seeded in wells of 24-well plates at 1 × 10⁴ cells per well. Concentrations of NO in culture supernatants were determined as nitrite (NO2−) using Griess reagent (Cell Signaling Technology, Danvers, MA, USA). Briefly, WISH cells were pretreated with 0.01 – 1 µg/ml of remifentanil for 1 h and then incubated with LPS (1 µg/ml) for 24 h. After incubation, the supernatants were obtained and mixed with the same amount (1:1) of Griess reagent. Samples were incubated at room temperature for 10 min, and absorbance was detected at 540 nm using a model 680 microplate reader (Bio-Rad, Hercules, CA, USA).
4. 3-(4,5-Dimethylthiazol-2-yl)-2,5-diphenyl tetrazolium bromide (MTT) assay
Cells (1 × 10⁵ / well) were seeded in wells of 24-well plates and cultured for 24 h at 37℃ in a 5% CO2 incubator. The cells were exposed to remifentanil (0.01 – 1 µg/ml) for 3 h. After treatment of remifentanil, cell viability was assessed by adding 100 µl of MTT (Affymetric, Inc., Santa Clara, CA, USA and USB, Solon, OH, USA; 5 mg/ml in phosphate buffered saline [PBS], pH 7.4) to each well and incubated at 37℃. After 1 h, the medium was removed and 100 µl dimethyl sulfoxide (DMSO; Biosesang, Seongnam, Republic of Korea) was added to each well. Each plate was gently rotated on an orbital shaker for 15 min to completely dissolve the precipitate. The absorbance was detected at 540 nm with a model 680 microplate reader (Bio-Rad). All experiments were repeated three times.
5. Western blot
All cells were extracted with chilled RIPA buffer consisting of 50 mM Tris pH 7.5, 150 mM NaCl, 5 mM EDTA, 0.5% NP40, 5 mM dithiothreitol, 0.2 mM sodium orthovanadate, 100 mM NaF, and 1 mM phenylmethylsulfonyl fluoride containing protease inhibitor/Phosphatase Inhibitor Cocktail 1× (Cell signaling Technology). Samples (25 µg protein/well) were separated by sodium dodecyl sulfate-polyacrylamide gel electrophoresis (SDS-PAGE) and transferred to a nitrocellulose membrane (Whatman®; GE Healthcare, Buckinghamshire, UK). Each membrane was blocked using Tris buffered saline containing 0.1% Tween-20 (TBST) containing 3% skim milk for 1 h, then incubated with primary antibody. The primary antibodies used were alpha (α)-tubulin (1:1000; Santa Cruz Biotechnology, Sant Cruz, CA, USA), p38 mitogen-activated protein kinase (MAPK) (1:1000; Cell Signaling Technology), phospho-p38 MAPK (1:500; Cell Signaling Technology), nuclear factor-kappa B (NF-κB) p65 (1:1000; Santa Cruz Biotechnology), phospho-NF-κB p65 27 (Ser 536, 1:500; Santa Cruz Biotechnology), prostaglandin E (PGE) synthase 2(A-2) (1:1000; Cell Signaling Technology), and cyclooxygenase 2 (D5H5) rabbit monoclonal antibody (1:1000; Santa Cruz Biotechnology) overnight, at 4℃ in TBST with 3% skim milk. After washing three times with TBST, the membranes were incubated with horseradish peroxidase (HRP)-conjugated anti-rabbit (1:1000; Enzo Life Sciences, Farmingdale, NY, USA) or anti-mouse (1:1000; Santa Cruz Biotechnology) antibody for 1 h at room temperature. Each membrane was washed three times with TBST and the bands were visualized using ECL detection reagents (Promega, Madison, WI, USA). Expression of α-Tubulin was used as the control. The target protein bands were normalized relative to the control band with the Image J program (NIH, Bethesda, MD, USA).
6. RNA extraction and reverse transcriptase-polymerase chain reaction (RT-PCR)
Total RNA was extracted from WISH cells using TRIzol reagent (Invitrogen, Carlsbad, CA, USA). Total mRNA (1 µg) was synthesized to cDNA using oligo(dT) PrimeScriptTM 1st strand cDNA Synthesis Kits (TaKaRa Bio, Shiga, Japan and Clontech, BD Biosciences, Palo Alto, CA, USA) according to the manufacturer's instructions. RT-PCR was done on a SimpliAmp Thermal Cycler (Applied Biosystems, Foster City, CA, USA). PCR primers used were: IL-1β, Forward: 5′- CTC GCC AGT GAA ATG GCT - 3′, Reverse: 5′ - GTC GGA GAT TCG TAG CTG GAT - 3′; TNF-α, Forward: 5′ - CCA GGC AGT CAG ATC TTC - 3′, Reverse: 5′ - GTT ATC TCT CAG CTC CAC GC - 3′; and β-actin, Forward: 5′ - GAC CTG ACT GAC TAC CTC ATG - 3′, Reverse: 5′ - CGC TCA TTG CCA ATG GTG ATG - 3′. Amplification of interleukin (IL)-1β / β-actin was performed using 35 cycles of 95℃ for 30 s, 55℃ for 30 s, and 72℃ for 30 s with a final extension of product at 72℃ for 7 min. Amplification of tumor necrosis factor-alpha (TNF-α) / β-actin was performed using 35 cycles of 94℃ for 30 s, 54℃ for 30 s, and 72℃ for 30 s with a final extension of product at 72℃ for 10 min. PCR-amplified products were separated on a 1.5% stained agarose gels. The Gel Doc ImageQuant LAS 500 System (GE Healthcare Bio-Sciences AB, Uppsala, Sweden) was used to assay the PCR products. β-actin was used to normalize all target genes. The data were analyzed using the Image J program.
RESULTS
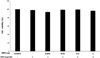
1. Effects of remifentanil treatment on cell viability and proliferation
The viability of amniotic epithelial cells was not affected by the different concentrations of remifentanil (Fig. 1).
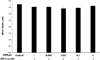
2. Effects of remifentanil treatment on NO concentrations
There was no difference in NO concentration in the remifentanil preconditioned group compared to the control group. NO production in amniotic epithelial cells was not affected by remifentanil (Fig. 2).
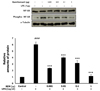
3. Effects of remifentanil treatment on the NF-κB pathway
Western blot analysis revealed that preconditioning with remifentanil reduced NF-κB expression after inducing inflammation in cells using LPS (Fig. 3).
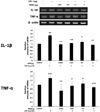
4. Effects of remifentanil treatment on proinflammatory cytokines (IL-1β, TNF-α
RT-PCR analysis showed that preconditioning with remifentanil reduced IL-1β and TNF-α expression after inducing inflammation in cells using with LPS (Fig. 4).
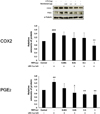
5. Effects of remifentanil treatment on COX2 and PGE2
Western blot analysis showed that preconditioning with remifentanil reduced PGE2 expression after LPS induction of cell inflammation. However, COX2 expression was decrease. The decrease was not statistically significant at low concentrations of remifentanil but was statistically significant at the highest concentration of remifentanil (Fig. 5).
DISCUSSION
The purpose of this study was to determine the effects of remifentanil on the factors related to uterine contractions in amniotic epithelial cells. There are several key findings. First, remifentanil did not affect the viability and NO production of amniotic epithelial cells. Remifentanil can thus be considered as a safe drug with no effect on cell survival rate. NO, which is increased during pregnancy, is an important regulator of uterine contraction [7]. Remifentanil appears to have no effect on NO-mediated uterine relaxation.
Second, preconditioning with remifentanil reduced NF-κB expression in the LPS-induced inflammatory condition. NF-κB is a transcription factor that is an important regulator of factors involved in the immune response, including cytokines, inducible NO synthase, COX2, and adhesion molecules. Several reports have established the regulation of NF-κB to bear the potential to control various inflammatory diseases [8910]. Based on the previous and present findings, we speculate that remifentanil inhibits NF-κB signaling pathways.
Lastly, preconditioning with remifentanil reduced the expression of the inflammatory cytokines IL-1β and TNF-α, and PGE2 in the LPS-induced inflammatory condition. Expression of COX2 showed a decreasing tendency at low concentrations that was not statistically significant; however, a statistically significant decrease was observed at the highest concentration.
Endotoxins like LPS stimulate an inflammatory response and cause the production of proinflammatory cytokines, including TNF-α and IL-6, which induces a hyperinflammatory state [11]. The severity of the systemic inflammatory response strongly correlates with the plasma levels of proinflammatory cytokines [12]. Presently, the levels of the IL-1β and TNF-α proinflammatory cytokines were significantly reduced in cells preconditioned with remifentanil before LPS exposure, compared with cells treated solely with LPS.
PGE2 plays an important role in labor, including cervical ripening and contraction of the uterus. It can, however, lead to excessive uterine contraction [13]. Although the results of this study indicate that COX2 expression is not affected by remifentanil, the finding that PGE2 expression was reduced with remifentanil preconditioning indicates that remifentanil may reduce uterine contraction. Several studies have investigated the effects of drugs used for general anesthesia on the myometrium using animal myometrium tissue slices [141516]. Nacitarhan et al. [15] reported that remifentanil reduces myometrial contraction in the uterine muscle of pregnant rats. Although COX2 is rarely expressed in normal conditions, it is rapidly induced by stimulation of molecules like LPS. This plays a critical role in the inflammatory response [17]. These results suggest that the reduction of COX2 expression at high concentrations of remifentanil cannot completely rule out the effect of remifentanil on COX2 expression.
Remifentanil is an ultra-short-acting µ-opioid receptor agonist. It is metabolized by hydrolysis of its ester linkage by a nonspecific plasma and tissue esterase. Remifentanil is widely used owing to the fast onset and dissolution of action [6]. Although its anti-inflammatory effect has been reported previously, no study has examined the its effects on amniotic epithelial cells [1819].
It is likely that such an anti-inflammatory effect of remifentanil suppressed the expression of NF-κB, which in turn reduced the secretion of proinflammatory cytokines, such as TNF-α and IL-1β, and attenuated the severity of the LPS-induced inflammatory response. It is very interesting that remifentanil suppressed the production of NF-κB, proinflammatory cytokines, and PGE2 after LPS-induced inflammation. This positive effect of remifentanil has been observed only in vitro. In vivo and clinical studies are needed to confirm the usefulness of the significant therapeutic effect of remifentanil. Additionally, further research is needed to elucidate the mechanism of remifentanil's inhibition of the NF-κB signaling pathway, which is observed in this study.
In conclusion, preconditioning with remifentanil did not affect the cell viability of amniotic epithelial cells and reduced the expression of factors related to uterine contractions after inducing inflammation with LPS in the cells, which is a major inducer of preterm labor. These findings provide evidence that remifentanil may inhibit preterm labor in clinical settings, such as a surgical procedure.
 XML Download