

 PDF
PDF ePub
ePub Citation
 Print
Print


INTRODUCTION
Since the 6-core biopsy was introduced by Hodge et al. [1], the 10- to 12-core transrectal ultrasound (TRUS)-guided biopsy has become the standard diagnostic method [2]. To improve the efficacy of prostate biopsy (PBx), several biopsy methods, including saturation biopsy, extended biopsy, and advanced technology, such as multi-parametric magnetic resonance imaging (MRI), contrast-enhanced TRUS, and sono-elastography, were widely introduced [34]. Regarding biomarkers, percent-free prostate-specific antigen (PSA), prostate health index (PHI®; Beckman Coulter, Brea, CA, USA), ExoDx® prostate intelliscore (EPI; Exosome Diagnostics, Boston, MA, USA), prostate cancer antigen 3 (PCA3; Progensa, Bedford, MA, USA), and so on have been investigated for patients with high PSA [5]. Especially, the National Comprehensive Cancer Network (NCCN) recommended to consider performing MRI or assessing biomarkers before PBx in suspicious prostate cancer (PCa) patients [6]. However, because of the additional costs, MRI or biomarkers might be only used for selected patients.
The increasing number of biopsy cores was generally considered to be used to facilitate higher cancer detection rate (CDR) in practice. To introduce the newly advanced biopsy technique, the outcomes in real-world practice, including the CDR, cost-efficacy, and risk of complication, were investigated. Furthermore, the outcomes of the advanced biopsy technique in real-world practice should be confirmed to be superior to those of the increasing number of biopsy cores. Although numerous papers have presented the results of experts, there are few studies that have analyzed CDRs according to the various biopsy methods in practice. Therefore, the aim of this study was to compare the CDRs of several biopsy methods for patients with PSA <10.0 ng/mL.
Go to : 
MATERIALS AND METHODS
1. Study population and data collection
Gangnam Severance Hospital Institutional Review Board approval was obtained for this study to collect data on all patients who had undergone PBx for suspicious PCa at our institution between January 2006 and December 2015 (approval number: 2019-0325-001), and informed consent was obtained from all individual participants included in the study. We reviewed 1,631 patients with PSA <10.0 ng/mL. A total of 33 biopsies were excluded from the study for the following reasons: 16 had received a prior diagnosis of PCa, 7 had received radiation treatment, 6 had underwent digit-guided PBx, and 4 were submitted for evaluation for extraperitoneal mass. Finally, 1,598 patients were included in the final analysis.
Patient characteristics included clinico-pathologic data, such as age at PBx, presence of previous biopsy history, prostate volume (PV), PSA, PSA density (PSA value divided by PV), volume per core (VPC: PV divided by the number of biopsy cores), and biopsy methods [7]. For calculating VPC, we hypothesized that the PBx cores were evenly inserted into the prostate tissue.
2. Indication and protocols of PBx
The indications for PBx were persistent clinical suspicions of PCa such as elevated PSA level ≥3.0 ng/mL, steadily increasing PSA levels, abnormal digital rectal examination, abnormal TRUS result, and abnormal pathologic finding including high-grade prostatic intraepithelial neoplasia or atypical small acinar proliferation of prostate with the prior PBx. We performed a PBx under local anesthesia with the BK Medical Flex Focus 500 ultrasound system (Analogic Corporation, Peabody, MA, USA) by using a 7.5 to 12 MHz multiplanar probe.
3. Stratifying biopsy methods
The standard biopsy methods for patients with suspicious PCa was 12-core PBx. To reduce the number of cases with unfortunately missed diagnosis of PCa, our institution introduced the prebiopsy MRI and several methods related to the increasing number of biopsy cores. Our target biopsy protocol for MRI targeted biopsy (MR-TBx) or hypoechoic lesion on TRUS consisted of 12-core PBx after target biopsy on suspicious lesions. MR-TBx with cognitive technique was performed by two urologists (L.K.S. or L.D.H). A 12+2 hypoechoic lesion target biopsy (12+2HLTBx) was performed to evaluate the efficacy of hypoechoic lesions chosen by clinicians experienced in performing MR-TBx for cancer detection [8]. Patients who underwent additional biopsy cores on lesions with abnormal finding in TRUS were regarded as the extended biopsy group. Finally, biopsy methods were categorized into 5 groups (MR-TBx, 12+2HLTBx, 24-core saturation biopsy (sPBx), extended biopsy, and 12-core PBx). However, 12+2HLTBx was not considered as the generalized methods. To analyze the efficacy of MR-TBx, we compared the CDRs among MR-TBx, sPBx, and other protocols with the possibility to improve the CDR in practice (12+2HLTBx, extended biopsy, and 12-core PBx).
4. MRI protocol and image analysis
For MR-TBx, all patients underwent imaging using a 3.0T MRI system (Intera Achieva 3.0T; Phillips Medical System, Best, The Netherlands) equipped with a phased array coil (6 channels). All patients underwent diffusion weighted imaging MRI and dynamic contrast enhanced MRI in addition to the routine prostate MRI protocol of 3 orthogonal planes (axial, sagittal, and coronal) used at our institution. Two b values (0, 1,000) were used, and diffusion restriction was quantified through apparent diffusion coefficient mapping. All images were reviewed by 2 experienced uro-radiologists who were blinded to the biopsy results.
5. Statistical analysis
Continuous variables were expressed as the mean±standard deviation). Categorical variables were reported as the number of occurrences and frequency. The Pearson's chi-squared test was used for statistical comparisons of continuous and categorical variables. Univariate and multivariate logistic regression analyses were carried out using clinical parameters. Variables that were found to be significant in the univariate analyses (p<0.05) were entered into the multivariate analysis. Receiver operating characteristic (ROC) curves and area under the ROC curves (AUCs) were used to obtain the cut-off value. The optimal cut-off value of VPC was determined using Youden's index (sensitivity+specificity-1). The optimal cut-off values were based on predefined values and according to a sensitivity analysis using Youden index. Statistical analyses were performed using the IBM SPSS Statistics version 23.0 for Windows (IBM Corp., Armonk, NY, USA). All tests were two-sided and performed at the 5% significance level.
Go to :
RESULTS
The patient characteristics are shown in Table 1. Of the 1,598 patients, 401 (25.1%) were diagnosed with PCa. The mean age of the groups with and without PCa were 66.8 and 63.3 years, respectively (p<0.001). The group diagnosed with PCa had higher PSA level and PSA density, as well as lower PV and VPC than that without PCa (p<0.001, p=0.001, p<0.001, p<0.001, respectively). Stratifying according to biopsy methods, MR-TBx was performed in 73 (4.6%), 12+2HLTBx in 120 (7.5%), sPBx in 75 (4.7%), extended biopsy in 212 (13.3%), and 12-core PBx in 1,118 (70.0%) cases. The CDRs of MR-TBx, 12+2HLTBx, sPBx, extended biopsy, and 12-core PBx were 43.8%, 40.8%, 34.7%, 33.0%, and 20.0%, respectively. There was a significant difference in CDRs among the biopsy methods (p<0.001). When comparing the characteristics according to the biopsy methods, significant differences were found in age, hypertension, body mass index, PSA, presence of biopsy history, VPC, number of total core, number of positive core, and the proportion of Gleason score ≥7 (3+4) among the biopsy methods (p=0.025, p=0.028, p=0.018, p=0.031, p<0.001, p<0.001, p<0.001, p<0.001, p=0.037 respectively). In patients diagnosed with PCa, the ratios of positive core and total core for MR-TBx, 12+2HLTBx, sPBx, extended biopsy, and 12-core PBx were 35.7%, 24.6%, 27.6%, 30.2%, and 30.7%, respectively. Among the patients diagnosed with PCa, the proportions of Gleason score ≥7 (3+4) in MR-TBx, 12+2HLTBx, sPBx, extended biopsy, and 12-core PBx were 71.9%, 51.0%, 57.7%, 65.7%, and 49.6%, respectively.
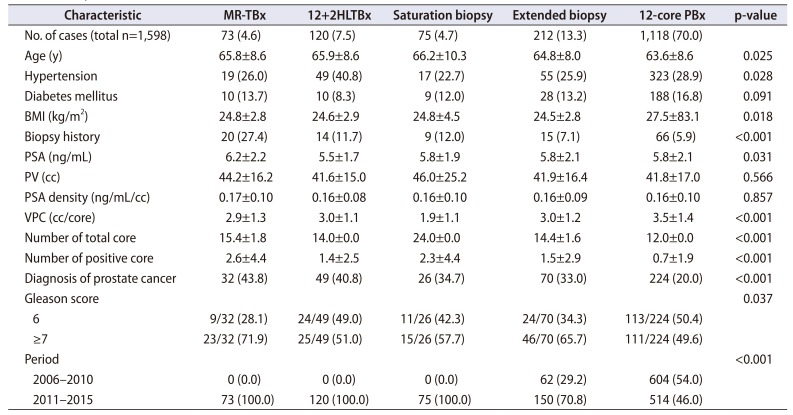
Table 1
Basic patients' characteristics
![]()
For predicting the diagnosis of PCa, age (odds ratio [OR], 1.07; 95% confidence interval [CI], 1.051–1.094; p<0.001), PSA (OR, 1.17; 95% CI, 1.078–1.269; p<0.001), PV (OR, 0.97; 95% CI, 0.951–0.982; p<0.001), VPC (<3.0 cc/core) (OR, 2.37; 95% CI, 1.509–3.711; p<0.001), and biopsy methods (p=0.045) were identified as the significant factors in the multivariate analysis. In the biopsy methods, MR-TBx was superior to other protocols in cancer detection, but it was shown to have no significant difference with sPBx (OR, 0.46; 95% CI, 0.240–0.865; p=0.016; OR, 0.62; 95% CI, 0.266–1.462; p=0.277; respectively) (Table 2).
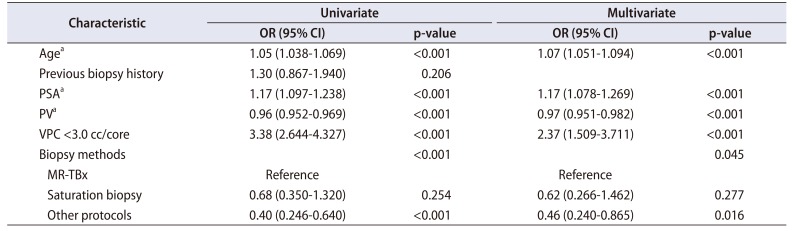
Table 2
Univariate and multivariate logistic regression analyses predicting the presence of prostate cancer
![]()
We also performed a sub-analysis according to the presence of biopsy history. For patients who underwent initial PBx, multivariate analysis reported that age (OR, 1.07; 95% CI, 1.048–1.088; p<0.001), PSA (OR, 1.24; 95% CI, 1.143–1.338; p<0.001), PV (OR, 0.97; 95% CI, 0.951–0.981; p<0.001), VPC (<3.0 cc/core) (OR, 2.21; 95% CI, 1.440–3.405; p<0.001), and biopsy methods (p=0.007) were the significant predictors (Table 3). Among the biopsy methods, sPBx was comparable to MR-TBx in terms of PCa diagnosis (p=0.478), whereas the other protocols have a significantly lower detection rate than MR-TBx (OR, 0.39; 95% CI, 0.197–0.772; p=0.007).
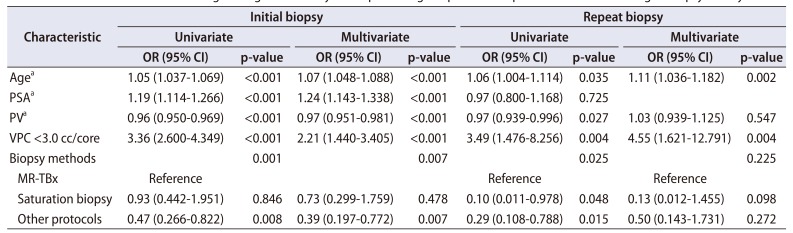
Table 3
Univariate and multivariate logistic regression analyses for predicting the presence of prostate cancer according to biopsy history
![]()
For patients with a biopsy history, age (OR, 1.11; 95% CI, 1.036–1.182; p=0.002) and VPC (<3.0 cc/core) (OR, 4.55; 95% CI, 1.621–12.791; p=0.004) were identified as the significant factors in the multivariate analysis. Notably, the biopsy methods were not found as significant factors in repeat biopsy (Table 3).
Go to :
DISCUSSION
Age, PSA, and PV were considered as significant predictors of PCa diagnosis [9]. Among these variables, PSA had a major drawback, as it could be possibility affected by its lack of cancer specificity and the lack of a common upper or lower threshold value [1011]. Developing a strategy for utilizing the clinical parameters that are routinely evaluated, VPC calculated by PV and the number of biopsy cores could be beneficial in terms of cost, time, and treatment decision making. After introducing VPC, several studies have investigated the relationship between PV and the number of biopsy cores [9121314]. Finally, VPC was an even stronger independent predictor of biopsy results than PV [9].
A direct relationship showing higher CDR for lower VPC supports the idea that adequately sampling the prostate is critical in avoiding low CDR. Vashi et al. [12] developed a mathematical model to calculate the number of biopsy cores that considered age, PV, tumor volume, and doubling time. Remzi et al. [13] suggested the Vienna nomogram to determine the number of cores based on age and PV in patients with PSA values of 2 to 10 ng/mL. The increased number of biopsy cores was considered to possibly result in greater discomfort and more complications for the patient. Therefore, the optimal cut-off value of 4.0 was suggested for high CDR without taking an excessive number of biopsy specimens in patients with PSA <20 ng/mL [9]. In this study, the cut-off value of VPC (3.0 cc/core) was obtained by AUC of the ROC curve for patients with PSA <10.0 ng/mL.
MRI before PBx in patients who had undergone an initial biopsy improved the diagnostic yield of clinically significant cancer by reducing unnecessary PBx [15]. This study also supports the usefulness of prebiopsy MRI by confirming the high CDR of MR-TBx in the initial biopsy. The American Urological Association consensus statement on the recommendation to consider MRI for patients with negative results in prior PBx was made to improve CDR [16]. However, interestingly, this study reported that biopsy methods at repeat biopsy were not identified as significant factors. We assumed that this was due to the fact that MRI is only a tool used to increase the diagnostic rate of clinically significant PCa, not to increase the detection rate of insignificant PCa [17]. In particular, mimicking lesion may exist in MRI due to chronic prostatitis or other reasons such as previous PBx procedure. Therefore, these mimicking lesions may decrease the accuracy of diagnosing PCa. We considered that biomarkers are useful for discriminating these patients with mimicking lesions to appropriately identify patients who will undergo PBx. Second, VPC, instead of biopsy methods, was identified as a significant factor to predict PCa in patients with repeat biopsy. Notably, this result does not imply that MRI has no efficacy for patients with repeat biopsy, but our data indicate that proper core number should be adjusted using VPC, especially for cases with barrier to use of MRI.
Generally, sPBx is believed to result in higher CDR [18]. There was no significant difference in the complications between sPBx and standard biopsy [19]. In our study, the CDR of sPBx is compatible to that MR-TBx. However, since sPBx requires more needle stapling, it is not suitable for office use considering pain or discomfort [20]. Especially, as the number of needles increased, tolerability of patients decreased. Thus, sPBx was performed only under general anesthesia, not local anesthesia.
This study evaluated the CDRs according to several biopsy methods in patients with PSA <10.0 ng/mL. In general, 30% to 35% of men with a PSA level of 4 to 10 ng/mL are diagnosed with PCa [6]. In this cohort with a median PSA of 5.41 ng/mL, the CDR of 25.1% was relatively lower than those in the previous studies. For 12-core PBx being the standard diagnostic method, the CDR of 20.0% was reported. These results could be related to several reasons. First, the detection rate in our cohort may differ from those in other studies performed by experts. Our institution's training program recommended the policy that most PBx procedures, excluding MR-TBx, sPBx and 12+HLTBx, should be performed by residents. Long periods of observation were required for the operator to achieve mastery in skills at a level sufficient for independent practice [2122]. Second, although prebiopsy MRI was performed to reduce the number of cases with unfortunately missed PCa diagnosis, the MR-TBx protocol in our institution utilized the cognitive technique.
In NCCN, if MRI is available, MRI-guided biopsy is recommended using the MRI/ultrasonography fusion biopsy [6]. Nevertheless, this study reaffirmed that CDR of MR-TBx was higher than those of other PBx methods, which are generally used in practice. However, MRI and biomarker required additional cost. Furthermore, the costs of MRI and biomarkers are not reimbursed by the insurance before PCa diagnosis in Korea.
Complications including hematuria, infection, lower urinary tract symptoms, and pain occurred after PBx. Hospitalization for the management of serious biopsy-related adverse events was required in a minority of patients because of massive hematuria (<1%), febrile urinary tract infection or sepsis (0%–6.3%), and acute urinary retention (0.2%–1.7%), which are related to the increasing number of sampling cores [23]. To the best of our knowledge, there were no previous studies that have directly compared the complication rate among biopsy methods including MR-TBx, sPBx, extended biopsy, and 12-core PBx In our cohort, cancer detection of sPBx was comparable to that of MR-TBx. However, MR-TBx showed a higher ratio of the number of positive cores to that of the total cores (37.1% vs. 27.5%) and proportion of significant cancer (Gleason score ≥7 [3+4]) (71.9% vs. 57.7%) than sPBx. Furthermore, considering the direct relationship of complications and increasing number of biopsy cores, our findings will help clinicians decide the use of either MR-TBx or sPBx in clinical setting.
This study has some limitations. First, there were no obvious criteria for selecting the biopsy methods. Moreover, multiple physicians as biopsy operators performed PBx, which could account for the heterogeneity in the results. However, this demonstrates that an average group of urologists can achieve good PBx results in clinical practice. Second, analysis of the Prostate Imaging Reporting and Data System (PI-RADS) and CDR was not applied in this study. In patients who underwent biopsy before PI-RADS, MRI readings could not be converted back to PI-RADS in this retrospective analysis. Moreover, since the version of PI-RADS has changed during the study period, there was a concern that the results could be inconsistent. Third, although complications and CDR might be the considerable factors for choosing the appropriate biopsy method, this study did not analyze complications. Nevertheless, to the best of our knowledge, this study is the first to compare the various methods of PBx simultaneously.
Go to :
 XML Download