

 PDF
PDF Citation
 Print
Print


INTRODUCTION
Anemia contributes towards an increased risk of cardiovascular diseases and death in patients with chronic kidney disease (CKD).12 Therefore, it was postulated that increasing hemoglobin levels using erythropoietin (EPO) may improve clinical outcomes in CKD patients.3 However, increasing hemoglobin levels was not linked to improved clinical outcomes in large prospective randomized studies,45 and subsequent analysis revealed that EPO resistance had a more significant influence on clinical outcomes than hemoglobin levels.6 In this regard, identification of factors associated with EPO resistance is of the utmost importance to the management of CKD patients.7 Because iron deficiency is the most well-known risk factor for EPO resistance,8 clinicians usually replace iron intravenously or orally when the response to erythropoiesis-stimulating agents (ESA) is not sufficient. However, hemoglobin levels may not always be normalized by iron replacement. Therefore, identification of other contributing factors to EPO resistance, such as disturbed bone mineral metabolism,9 is required.
Anemia is also common in patients with heart failure (HF).10 Anemia increases the risk of hospitalization and mortality in HF patients, regardless of ejection fraction (EF).1112 However, as in CKD patients, raising hemoglobin levels using EPO did not improve clinical outcomes in HF patients.13 Rather, elevated serum EPO levels are independently associated with the development of incident HF, suggesting a potential relationship between cardiac function and EPO resistance.14 Cardiac dysfunction and abnormal cardiac geometry are common in CKD patients.1516 Therefore, the potential relationship between cardiac status and EPO resistance in CKD patients should be explored. However, there are no universal definitions or markers for EPO resistance in CKD patients. Serum hepcidin, an iron-sequestrating peptide, has been recently suggested to be fundamental for EPO resistance.917 Therefore, assuming that serum hepcidin levels are a surrogate for EPO resistance, we performed the current study to identify the relationship between cardiac function and geometry and serum hepcidin levels in non-dialysis CKD patients using data from the KoreaN cohort study for Outcome in patients With CKD (KNOW-CKD).
METHODS
Participants
The KNOW-CKD is a Korean multicenter prospective cohort study of 2,238 patients with non-dialysis CKD stages 1–5 that were enrolled from February 2011 through January 2016. The detailed design and methods of the KNOW-CKD were previously published (NCT01630486 at http://www.clinicaltrials.gov).18 Estimated glomerular filtration rate (eGFR) was calculated using the CKD Epidemiology Collaboration equation.19 CKD and its stages were defined using the Kidney Disease Improving Global Outcomes 2012 guidelines.20
Of the 2,238 patients, 341 were excluded, which included 179 with missing echocardiographic measurements, 127 with missing anemia and iron metabolism-related measurements, and 33 that were missing other comorbidity data and laboratory measurements. Therefore, 1,897 patients were included in the final analysis.
Echocardiography
Complete two-dimensional M-mode and Doppler studies were performed via standard approaches by cardiologists at the participating hospitals who were blinded to the clinical data. M-mode examination was performed according to American Society of Echocardiography guidelines.21 The recorded echocardiographic data were left ventricular (LV) end diastolic diameter (LVEDD), LV end systolic diameter, inter-ventricular septum thickness, LV posterior wall thickness (LVPWT), left atrial diameter (LAD), regional wall motion abnormality (RWMA), EF, and early diastolic mitral inflow to annulus velocity ratio (E/e′). Relative wall thickness (RWT) was calculated according to the following formula: RWT = (2 × LVPWT)/LVEDD. LV mass (LVM) was determined using the Devereux formula21: LVM (g) = 0.8 × {1.04 × [(LVEDD + IVST + LVPWT)3 - (LVEDD)3]} + 0.6, where IVST represent interventricular septal thickness, and LVMI was calculated by normalizing LVM to height2.7 (g/m2.7).
Measurement and definitions
Hepcidin was measured by complement-enzyme linked immunosorbent assay using EIA5258 kits (DRG Diagnostics, Marburg, Germany), according to the manufacturer's instructions. The intra- and inter-assay coefficients of variation were 2.1%–9.9% and 11.5%–14.6%, respectively.17 The detectable maximum level was 80 ng/mL, with levels above this threshold recorded as 80 ng/mL. The level of intact parathyroid hormone (iPTH) was measured using a Cobas e411 analyzer (Roche Diagnostics GmbH, Mannheim, Germany) and the level of 25-hydroxyvitamin D (25OHD) was measured using the ADIVIA Centaur XP analyzer (Siemens Healthcare Diagnostics, Tarrytown, NY, USA).
Clinical data, including detailed demographic information and baseline laboratory results, were extracted from the electronic data management system (PhactaX). Body mass index (BMI) was calculated as weight (kg) divided by the square of the height (m2). Hypertension was defined as previous diagnosis by a physician, systolic blood pressure (BP) ≥ 140 mmHg or diastolic BP ≥ 90 mmHg, or treatment with anti-hypertensive drugs, including renin angiotensin-system inhibitors such as angiotensin-converting-enzyme inhibitors and angiotensin II receptor blockers. Diabetes was defined as previous diagnosis by a physician diagnosis, fasting glucose ≥ 126 mg/dL, or treatment with insulin or oral anti-diabetic drugs. LV geometry was defined according to the recommendations of the European Association of Cardiovascular Imaging and the American Society of Echocardiography.22 High LVMI was defined as LVMI ≥ 48 g/m2.7 in men) and ≥ 44 g/m2.7 in women. High RWT was defined as ≥0.42.22 High serum hepcidin was defined as more than 25.5 ng/mL (highest quartile value).
Statistical analysis
The distributions of continuous variables were evaluated using histograms and Q-Q plots. Ferritin, hepcidin, iPTH, 25OHD, high sensitivity C-reactive protein (hsCRP), and urine protein to creatinine ratio (UPCR) were not normally distributed. Normally distributed continuous variables are expressed as mean ± standard deviation, non-normally distributed continuous variables as median (interquartile range), and categorical variables as percentages. Differences were analyzed by t-tests for normally distributed continuous variables, the Mann-Whitney U test for non-normally distributed continuous variables, and the χ2 test for categorical variables. The odds ratio (OR) and its 95% confidence interval (CI) for high serum hepcidin were assessed using logistic regression analysis. In multivariate analyses, covariates were chosen based on clinical and statistical relevance, and only participants without missing values were included. The potential non-linear relationship between RWT and serum hepcidin levels was plotted using the generalized additive model (GAM),23 with the ‘mgcv’ package in R statistics (version 3.03; R Foundation, Vienna, Austria). A P value < 0.05 was considered statistically significant. All analyses unless otherwise specified were performed using SPSS version 22 (IBM Corp., Armonk, NY, USA).
Ethics statement
The protocol of the KNOW-CKD adhered to the principles of the Declaration of Helsinki and was approved by the Institutional Review Board (IRB) at each participating hospital, including Seoul National University Hospital, Yonsei University Severance Hospital, Kangbuk Samsung Medical Center, Seoul St. Mary's Hospital, Gil Hospital, Eulji Medical Center, Chonnam National University Hospital, and Busan Paik Hospital. Approved IRB number from Eulji Medical Center IRB for this study was 201105-01. Written informed consent was obtained from all participants.
RESULTS
The mean age of the 1,897 patients was 54 years and 60.9% were men. The causes of CKD were diabetic nephropathy in 25.5% of patients, hypertensive nephropathy in 19.8%, glomerulonephritis in 30.7%, and other causes in 24.1%. Mean eGFR was 52.9 mL/min/1.73 m2 and median UPCR was 0.49 g/g creatinine. Mean RWT and the rate of high RWT was 0.38 and 26.6%, respectively. Mean LVMI and the rate of high LVMI was 42.0 g/m2.7 and 29.1%, respectively. The rates of concentric and eccentric hypertrophy and concentric remodeling were 13.8%, 15.3%, and 12.8%, respectively. Mean EF and the rate of EF < 50% was 64.1% and 1.3%, respectively. Mean E/e′ and the rate of E/e′ ≥ 15 was 9.9% and 9.6%, respectively. The rate of high serum hepcidin was 25.0%.
We compared the clinical characteristics according to the serum hepcidin status (Table 1). Patients with high serum hepcidin were older and were comprised of a higher proportion of men. Although the rates of hypertension and systolic and diastolic BP were not different, more patients with high serum hepcidin used diuretics, beta blocker, and calcium channel blocker, suggesting difficulty in controlling BP. The sizes of the LV and left atrium (LA) and the rate of RWMA were not different according to serum hepcidin level. Similarly, markers of systolic and diastolic LV function (EF and E/e′, respectively) also did not differ. However, patients with high serum hepcidin showed significantly thicker LV walls. In addition, patients with high serum hepcidin showed increased ferritin and transferrin saturation (TSAT) and decreased hemoglobin levels. Patients with high serum hepcidin also exhibited decreased calcium and 25OHD levels and increased phosphorus and iPTH levels. A lower eGFR and higher UPCR was observed in patients with high hepcidin, as well as elevated inflammation (increased hsCRP and white blood cells).
Table 1
Clinical characteristics according to the serum hepcidin status
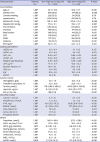
Values are expressed as mean ± standard deviation for normally distributed continuous variables, median (interquartile range) for non-normally distributed continuous variables, and percentage for categorical variables. Difference was analyzed by t-test for normally distributed continuous variables, Mann-Whitney U test for non-normally distributed continuous variables, and χ2 test for categorical variables.
BP = blood pressure, RAS = renin angiotensin-system, CCB = calcium channel blocker, BMI = body mass index, LVESD = left ventricular end systolic diameter, LVEDD = left ventricular end diastolic diameter, IVST = interventricular septal thickness, LVPWT = left ventricular posterior wall thickness, LVMI = left ventricular mass index, LAD = left atrial diameter, RWMA = regional wall motion abnormality, E/e′ = early diastolic mitral inflow to annulus velocity ratio, ESA = erythropoiesis stimulating agents, CKD-MBD = chronic kidney disease-mineral bone disorder, iPTH = intact parathyroid hormone, 25OHD = 25-hydroxyvitamin D, eGFR = estimated glomerular filtration rate, UPCR = urine protein-to-creatinine ratio, WBC = white blood cells, hsCRP = high sensitivity C-reactive protein.
![]()
We explored the relationship between cardiac geometric markers and high serum hepcidin (Table 2). In univariate analysis, both RWT and LVMI were associated with high serum hepcidin, where each 0.1 unit increase in RWT was associated with a 1.292-fold increase in the odds for high serum hepcidin (P < 0.001), while each 1 g/m2.7 increase in LVMI was associated with a 1.016-fold increase (P < 0.001). However, in multivariate analysis after adjusting for variables related to anemia, bone mineral metabolism, comorbidities, and inflammation, only RWT was associated with high serum hepcidin (OR, 1.989; 95% CI, 1.358–2.916; P < 0.001). This independent positive association between RWT and serum hepcidin was confirmed on the GAM plot, but the relationship seemed to be non-linear (Fig. 1). On visual inspection, the lower limit of the 95% CI was above 0 after 0.52 and 0.60 of RWT in univariate and multivariate GAM plots, respectively.
Table 2
OR of cardiac geometry for high serum hepcidin
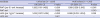
OR and 95% CI were analyzed using logistic regression analysis. In multivariate analysis, covariates were anemia markers (hemoglobin, ferritin, transferrin saturation, and administration of erythropoiesis stimulating agents or supplemental iron), bone mineral metabolism markers (serum levels of calcium, phosphorus, intact parathyroid hormone, and 25-hydroxyvitamin D and administration of oral vitamin D3, active vitamin D, and phosphate binder), and comorbidities (age, gender, smoking status, systolic and diastolic blood pressure, body mass index, fasting glucose, estimated glomerular filtration rate, urine protein to creatinine ratio, and serum levels of albumin and cholesterol), and inflammation (white blood cells and high sensitivity C-reactive protein), and interaction between RWT and intact parathyroid hormone.
OR = odds ratio, CI = confidence interval, RWT = relative wall thickness, LVMI = left ventricular mass index.
aInteraction with sex.
![]()
 | Fig. 1Relationship between RWT and serum hepcidin levels using generalized additive model plots. The Y-axis number indicates the difference from the mean serum hepcidin levels, and the dotted line indicates 95% CIs for the smoothed serum hepcidin levels. In the univariate model, the smoothing function for the association between RWT and serum hepcidin levels is displayed. In the multivariate model, covariates are left ventricular mass index, anemia markers (hemoglobin, ferritin, transferrin saturation, and administration of erythropoiesis stimulating agents or supplemental iron), bone mineral metabolism markers (serum levels of calcium, phosphorus, intact parathyroid hormone, and 25-hydroxyvitamin D and administration of oral vitamin D3, active vitamin D, and phosphate binder), and comorbidities (age, gender, smoking status, systolic and diastolic blood pressure, body mass index, fasting glucose, estimated glomerular filtration rate, urine protein to creatinine ratio, and serum levels of albumin and cholesterol), and inflammation (white blood cells and high sensitivity C-reactive protein).RWT = relative wall thickness, CI = confidence interval.
|
We analyzed the patients' clinical characteristics according to their RWT (Table 3). Patients with high RWT were older, and had higher systolic BP, BMI, and fasting glucose than those with non-high RWT. In terms of cardiac parameters, EF and E/e′ were higher in patients with high RWT. High RWT was also associated with lower hemoglobin, TSAT, and serum calcium, but higher serum phosphorus and iPTH. Patients with high RWT also exhibited a lower eGFR but higher UPCR. High RWT was also associated with higher hsCRP levels.
Table 3
Clinical characteristics according to the status of RWT

Values are expressed as mean ± standard deviation for normally distributed continuous variables, median (interquartile range) for non-normally distributed continuous variables, and percentage for categorical variables. Difference was analyzed by t-test for normally distributed continuous variables, Mann-Whitney U test for non-normally distributed continuous variables, and χ2 test for categorical variables.
RWT = relative wall thickness, BP = blood pressure, BMI = body mass index, LVESD = left ventricular end systolic diameter, LAD = left atrial diameter, E/e′ = early diastolic mitral inflow to annulus velocity ratio, RWMA = regional wall motion abnormality, TSAT = transferrin saturation, ESA = erythropoiesis stimulating agents, iPTH = intact parathyroid hormone, 25OHD = 25-hydroxyvitamin D, eGFR = estimated glomerular filtration rate, UPCR = urine protein-to-creatinine ratio, WBC = white blood cells, hsCRP = high sensitivity C-reactive protein.
![]()
We also performed subgroup analysis for the relationship between RWT and high serum hepcidin based on several clinical conditions (Fig. 2). The relationship between RWT and high serum hepcidin was affected by the status of gender and TSAT. In detail, increased RWT was associated with increased odds for high serum hepdicin only in women and people with TSAT < 30.4%. Besides, the status of age, hemoglobin, hsCRP, eGFR, E/e′, LAD, EF, and serum levels of iPTH and phosphorus did not modify the association between RWT and high serum hepcidin.
 | Fig. 2Subgroup analysis for the relationship between RWT and high serum hepcidin. Adjusted OR and 95% CI were analyzed using multivariate logistic regression analysis, entering into left ventricular mass index, anemia markers (Hb, ferritin, TSAT, and administration of erythropoiesis stimulating agents or supplemental iron), bone mineral metabolism markers (serum levels of calcium, P, iPTH, and 25-hydroxyvitamin D and administration of oral vitamin D3, active vitamin D, and phosphate binder), and comorbidities (age, gender, smoking status, systolic and diastolic blood pressure, body mass index, fasting glucose, eGFR, urine protein to creatinine ratio, and serum levels of albumin and cholesterol), and inflammation (white blood cells and hsCRP), and interaction term of RWT with gender and iPTH. Subgroups of age, Hb, TSAT, P, iPTH, hsCRP, and eGFR were categorized by the median values. When covariates were chosen as subgroup, they were excluded from the model.OR = odds ratio, CI = confidence interval, Hb = hemoglobin, TSAT = transferrin saturation, P = phosphorus, iPTH = intact parathyroid hormone, hsCRP = high sensitivity C-reactive protein, eGFR = estimated glomerular filtration rate, E/e′ = early diastolic mitral inflow to annulus velocity ratio, RWT = relative wall thickness.
|
DISCUSSION
When treating anemia in CKD patients, hyporesponsiveness to ESA is a troublesome issue because unrestricted escalation of ESA dose results in poor clinical outcomes.45 Therefore, the potential reasons for EPO resistance should be carefully explored before escalation of ESA dose. The most important cause of the EPO resistance in CKD patients is functional iron deficiency.24 However, patients with sufficient iron storage can also have ESA-resistant anemia, and identification of other contributing factors to EPO resistance is of the utmost importance. Because anemia and EPO resistance are also common problems in patients with HF,1014 and cardiac dysfunction and abnormal cardiac geometry are prevalent problems in CKD patients,1516 we aimed to identify the potential relationship between cardiac function and geometry and EPO resistance in CKD patients. To date, however, there have been no clear definitions or markers of EPO resistance. In this regard, serum hepcidin levels may be a good surrogate marker of EPO resistance because of its key role in sequestrating stored iron25 and as it is responsible for the increasingly higher EPO doses needed when treating anemia in CKD patients.17 Therefore, assuming serum hepcidin levels to be a marker of EPO resistance, we analyzed the relationship between echocardiographic measurements and serum hepcidin levels, and found that increased RWT was independently associated with increased serum hepcidin.
In our analysis, both systolic and diastolic LV function was not associated with high serum hepcidin. Similarly, the size of the LV and LA was not related to high serum hepcidin. Instead, LV geometry was associated with high serum hepcidin. Although both RWT and LVMI were associated with high serum hepcidin in univariate analysis, only RWT was found to be independently associated with high serum hepcidin. We further analyzed the relationship between RWT and serum hepcidin using a GAM plot. In multivariate analysis, increased RWT was associated with increased serum hepcidin levels only when RWT was extremely high. The suggested threshold of RWT was 0.60, only 0.8% of our patient population met or exceeded that threshold (Supplementary Fig. 1). Although this rate rises to 2.0% in patients with CKD stage 4–5, our analysis revealed that while RWT may be a novel risk factor of increased serum hepcidin, its clinical effect may be limited.
To our knowledge, this is the first study to suggest a relationship between RWT and serum hepcidin. The existence of risk factors that are shared by increased RWT and increased serum hepcidin may explain the association between RWT and serum hepcidin. Serum hepcidin levels are increased in patients with lower hemoglobin, higher body stored body iron, increased systemic inflammation, disturbed bone mineral metabolism, and decreased kidney function.91726 In this study, high RWT was associated with lower hemoglobin, lower serum calcium, higher serum phosphorus and iPTH, lower eGFR and higher UPCR, and higher hsCRP. However, the relationship between RWT and serum hepcidin was independent of the status of hemoglobin, bone mineral metabolism, kidney function, or inflammation. Therefore, different pathological mechanism may underlie the relationship between RWT and serum hepcidin. It is well-known that increased RWT is associated with diastolic HF.2728 Hepatic congestion frequently develops in patients with diastolic HF.29 Hepatic congestion in HF can contribute to inappropriately increased serum hepcidin.3031 In this study, the relationship between RWT and serum hepcidin was particularly valid in patients with extremely high RWT (> 0.60) and 31.3% of those patients had diastolic heart dysfunction. Taken together, we hypothesized that overt or subclinical hepatic congestion may partly contribute to the relationship between RWT and serum hepcidin in CKD patients.
The study has several limitations. First, the study was cross-sectional. Therefore, the relationship between cardiac geometry and serum hepcidin was not cause-and-effect. However, despite this limitation, this study presented a new hypothesis and its findings should be interpreted in this context. Second, echocardiographic measurements were evaluated by different cardiologists at the participating hospitals. Therefore, they may be heterogeneous. Although some measurements, including E/e′, may be affected by this heterogeneity, we believe that assessment of LV geometry would not be significantly affected because of the simplicity of measuring LV cavity size and wall thickness. Third, because KNOW-CKD cohort was not primarily designed to evaluate the relationship between cardiac geometry and EPO resistance, other markers of EPO resistance were not measured. Also, markers of hepatic congestion were not available. Finally, because the patient population comprised a single ethnicity from one country, the findings' generalizability may be limited.
In conclusion, increased RWT was associated with high serum hepcidin, particularly in women and patients with low TSAT. The meaning of the current study needs to be evaluated further in future prospective studies.
 XML Download