

 PDF
PDF ePub
ePub Citation
 Print
Print


INTRODUCTION
Mild cognitive impairment (MCI) is defined as cognitive decline without interference in activities of daily life.123456 Prevalence in population-based epidemiological studies ranges from 3% to 19% in adults older than age 65. More than half of the MCI patients advance into dementia status within 5 years.1 Based on the neuropsychological assessment, the clinician decides if the patient has memory impairment in isolation, single domain, or if other cognitive domains are impaired, such as language, executive function, or visuospatial function. When memory deficits are predominant, the subtype of MCI is called amnestic MCI (aMCI). If another cognitive domain is impaired, then is called multiple-domain aMCI. Similarly, if the patient does not have significant memory impairment, and according to how many other cognitive domains are impaired, the patient is classified as single domain-non-aMCI (naMCI) or multiple domain-naMCI.4
Alzheimer's disease (AD) is a neurodegenerative disorder defined pathologically by the presence of tau-rich neurofibrillary tangles and beta-amyloid plaques. The deposition of beta-amyloid is an initial step in the pathogenesis of AD.5 However, the exact role of amyloid deposition and neurofibrillary tangle formation in MCI has not been studied extensively. Pathological findings of neurofibrillary tangles in the mesial temporal structures correlate with MCI. Compared to people with dementia, without cognitive impairment and with normal cognitive function, individuals with MCI have intermediate amounts of AD pathological findings identified by silver stain,7 with amyloid deposition, and tau-positive tangles8 in the mesial temporal lobes.
Neuroimaging tests for work-up of MCI are used with magnetic resonance imaging (MRI) and positron-emission tomography (PET).1910111213 Medial temporal lobe atrophy on MRI and hypometabolism on fluorodeoxyglucose PET are highly predictive for advancement to dementia.12141516
Cerebral beta-amyloid plaques can be visualized through PET imaging using beta-amyloid radioligands. Approximately half of the MCI and 47%–75% of aMCI patients showed beta-amyloid retention on amyloid PET imaging.36 The overall range of reported sensitivity and specificity of amyloid-PET for predicting clinical progression from MCI to AD was 83.3%–100% and 41.7%–76.5%.17
The purpose of our study was to investigate the clinical characteristics and risk factors of aMCI and subgroups of aMCI that may have a higher effect on amyloid positivity.
METHODS
Participants
November 2015–May 2018, we recruited patients who visited our memory and dementia clinic at Dong-A University Hospital suffering from memory disturbance or cognitive dysfunction. We based the diagnosis on medical evaluations with a dementia expert according to neurological examinations, laboratory blood tests, brain imaging via computed tomography or MRI, and neuropsychological tests. Among them, we included individuals diagnosed as MCI according to the Petersen's criteria and had undergone amyloid PET imaging. We recruited a total of 136 aMCI patients. With the possibility of containing the non-AD pathology group, naMCI patients were excluded to obtain the homogenous group. Also, we excluded participants with a history of other neurodegenerative diseases, laboratory abnormalities, and other medical conditions that can affect patients' cognitive function from this study.
Our study was cross-sectional. We analyzed baseline clinical characteristics with risk factors of age, age of onset, sex, education years, family history of dementia, hypertension, diabetes mellitus, hyperlipidemia, coronary artery disease, social history of smoking or alcohol intake, and the presence of the apolipoprotein E4 (apoE4) genotype. This study was approved by the Institutional Review Board and written informed consent was obtained from all participants.
Neuropsychological assessment
Neuropsychological examinations included the Korean version of the Mini-Mental State Examination (MMSE),1819 the Clinical Dementia Rating sum of box (CDR-SOB),1920 and the short form of Geriatric Depression Scale (SGDS).21 We assessed detailed neurocognitive function by the Seoul Neuropsychological Screening Battery, which includes testing of attention concentration, spatiotemporal function, memory, frontal lobe executive function, and verbal and related functions.18
We categorized the participants with aMCI into subgroup types, such as early versus late amnestic, single versus multiple, and verbal versus verbal and visual amnestic. We defined the amnestic type of MCI as performance deficits on neuropsychological tests of episodic memory. We defined early MCI type as z-score of delayed recall in Seoul verbal learning test (SVLT) and Rey complex figure test (RCFT) above −1.5 and less than −1.0 (−1.5≤ z score <−1.0). We defined late MCI type as z-score of delayed recall in either SVLT or RCFT below −1.5 (z score <−1.5). We defined visual aMCI type as a score of 20-minute delayed recall in RCFT of less than 15 percentile and verbal type as a score of 20-minute delayed recall in SVLT of less than 15 percentile. We defined single and multiple domain according to numbers of impaired cognitive domains.
Neuroimaging procedure
All participants underwent a 20-minute F-18 florbetaben or flutemetamol PET scan starting at 90 minutes after injection of the radiotracer. The amyloid PET images in all patients were reviewed by 2 experienced nuclear physicians. Florbetaben PET was analyzed according to the Brain Amyloid Plaque Load (BAPL) scoring system and classified as positive (BAPL 2 or 3) or negative (BAPL1). Readers used a regional cortical-tracer uptake (RCTU) scoring system of (1, no tracer uptake; 2, moderate tracer uptake; and 3, pronounced tracer uptake) in 4 brain areas: lateral temporal cortex, frontal cortex, posterior cingulate cortex/precuneus, and parietal cortex. An RCTU score of 1 in each brain lesion is defined as BAPL score 1, of 2 in any brain region and no score of 3 as BAPL 2, and of 3 in any of the 4 brain regions as BAPL 3. We defined flutemetamol PET as positive when the value was more than 60% of its maximum uptake.
Statistical analyses
We analyzed the collected data with SPSS version 23.0 (SPSS, Chicago, IL, USA). We compared the continuous variables including demographic data (age, age of onset, and education level) and neuropsychological performance (MMSE, CDR-SOB, Global Deterioration Scale [GDS], and SGDS) between the groups (amyloid-negative and amyloid-positive MCI, amyloid-negative and amyloid-positive aMCI) using independent samples t-test. We compared categorical variables (gender, family history, hypertension, diabetes mellitus, hyperlipidemia, coronary artery disease, alcohol consumption, smoking, and apoE4 genotype) using the χ2 test. We considered all results significant at p<0.05.
We performed subgroup analysis on amyloid positivity according to age (<65 or ≥65) and apoE4 allele (apoE4-positive or apoE4-negative).
RESULTS
Table 1 presents the baseline demographic characteristics and neuropsychological results of all aMCI patients. Fig. 1 shows the amyloid positivity rates according to aMCI subgroups. Within the 136 of aMCI patients, we diagnosed 30 as early aMCI, 79 as late aMCI, and 27 as unclassified, 42 as single-domain aMCI and 94 as multiple-domain aMCI, 57 with (verbal and visual) aMCI, 48 with verbal aMCI and 31 with aMCI who are not included in our study. Of the aMCI patients, 107 underwent PET imaging using florbetaben, and 29 using flutemetamol. The amyloid positivity rate in all patients with aMCI was 56/136 (41%). The proportions of amyloid positivity according to the subgroup categorization for aMCI were as follow: late aMCI (39/79, 49%) vs. early aMCI (10/30, 33%), multiple aMCI (38/94, 40%) vs. single aMCI (16/42, 38%), verbal and visual aMCI (34/57, 59%) vs. verbal aMCI (17/48, 35%). Between the both and only verbal aMCI groups, the amyloid positivity rate revealed significant difference.
Table 1
Baseline demographic characteristics and neuropsychological assessments of the whole amnestic MCI group (n=136)
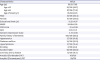
Data are shown as mean±standard deviation or number (%).
MCI: mild cognitive impairment, MMSE: Korean Mini-Mental State Examination, CDR: Clinical Dementia Rating, GDS: Global Deterioration Scale, PET: positron emission tomography.
![]()
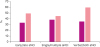 | Fig. 1Results of amyloid positivity rate according to aMCI subtype.aMCI: amnestic mild cognitive impairment, Both: verbal and visual.
|
Table 2 presents the relationship between baseline characteristics and amyloid positivity in aMCI patients. The mean age of the amyloid-positive group was statistically significantly higher than that of the amyloid-negative group in patients with aMCI (p<0.01). The frequency of apoE4 allele of the amyloid-positive group was statistically significantly higher than that of the negative group in patients with aMCI (p<0.01). Among the risk factors, although the frequency of hypertension was higher in the amyloid-negative group of patients with aMCI, it did not reach statistical significance (p=0.051). Education years, CDR-SOB, GDS, SGDS, family history, diabetes mellitus, hyperlipidemia, smoking, coronary artery disease showed no significant difference within amyloid-positive and amyloid-negative group in aMCI patients.
Table 2
Relationship between amyloid positivity and baseline characteristics in amnestic MCI patients
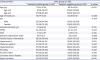
Data are shown as mean±standard deviation or number (%).
MCI: mild cognitive impairment, aMCI: amnestic mild cognitive impairment, MMSE: Korean Mini-Mental State Examination, GDS: Global Deterioration Scale, ApoE4: apolipoprotein E4.
![]()
In the subgroup analysis, the group of patients older than age 65 showed significant difference between the verbal and both aMCI groups. Other than that, age and apoE4 allele did not result in significant differences of amyloid positivity in the subgroups of aMCI (early vs. late, single vs. multiple, verbal vs. both).
DISCUSSION
Our study explored differences of amyloid positivity according to the aMCI subtypes. Amyloid positivity in the total MCI group was 39%, which was lower than in previous studies (approximately 50% of amyloid positivity in MCI patients).156 However, the number of MCI patients in our study was higher than in previous studies, of which the numbers of MCI patients were 45 and 19.56 One study in which the positivity rate of MCI was 67% was limited to late MCI (n=217) patients, which can result in outcomes different from those in our study.9 The verbal and visual aMCI group showed statistically higher amyloid positivity rate than did the verbal aMCI (p=0.01). The late, and multiple-domain aMCI groups showed higher amyloid positivity than did the early, and single-domain aMCI groups. Although there were no significant differences between these groups (p>0.05), there was a trend of higher amyloid PET positivity rate in the late aMCI, and the multiple-domain aMCI. Nearly 10%–15% of aMCI patients advance to probable AD every year.222324 Wolk et al.6 showed that the multiple-domain aMCI group had the highest proportion of amyloid-positive patients, as was relatively well explained that criteria for the multiple-domain aMCI are more similar to those for the clinical AD than are those for any other MCI subgroup. Older patients showed higher amyloid positivity rate in the aMCI group. Patterson et al.25 whose study was to find the relationship between age, amyloidosis, and amyloid-beta kinetics in the central nervous system of humans revealed that age negatively correlated with beta-amyloid turnover rate. And slowing of beta-amyloid turnover rate is more likely to result in amyloidosis. Also, it is well known that as people age, AD becomes more prevalent. These can explain our result of the relationship between age and higher amyloid positivity rate.25
With age and age of onset, apoE4 carriers showed significantly higher amyloid positivity rate in the aMCI group, probably because apoE4 alleles clearly raise the risk of advancement from aMCI to AD. Individuals with 1 apoE4 allele have a 5–6-fold greater risk for advancing to AD, and those with 2 apoE4 alleles have up to 20 times greater risk for advancing to AD.12223 Male to female ratio in the aMCI group was as follow: In amyloid-positive aMCI, the male to female ratio was 25:31 = 0.8:1, and in the amyloid-negative aMCI group, the ratio was 30:50 = 0.6:1, relatively evenly distributed. The amyloid-positive and -negative aMCI groups had similar education, of approximately 9 years. The score of CDR and CDR-SOB showed no significant differences, perhaps because our subjects were restricted to MCI patients. Among risk factors, amyloid-positive aMCI group had less hypertension than amyloid-negative group which shows a tendency of significant value (p=0.051). This may be explained in that frequency of hypertension was higher in amyloid-negative group which could mean patients with subcortical vascular MCI or those of mixed MCI may be included. Others showed no relationships with amyloid positivity. Because, throughout our study, age and apoE4 allele showed significant differences between the amyloid negative and positive groups, we further analyzed amyloid positivity according to age and apoE4 subgroups. Unlike our expectation, there were no significant differences except for patients older than age 65.
Our study has some limitations. First, it was cross-sectional. Even though we investigated the clinical characteristics or risk factors that may impact the amyloid positivity rate more, we could not verify a practical effect of these factors on conversion to Alzheimer's dementia. Thus, a longitudinal study is needed. Second, our study was limited to the aMCI group, which cannot provide a difference compared to a normal control or AD group. Also, we defined amyloid positivity by a semi-quantitative method. Additional quantitative measures may render more precise information in amyloid positivity. Also, although we evaluated structural imaging, such as brain MRI, in patients who visited our memory clinic, our study did not include the volume of hippocampal or medial temporal atrophy or rate of brain atrophy, a predictive conversion factor to Alzheimer's dementia in the MCI group. Finally, with changes in structural MRI, additional evaluation of cerebrospinal fluid tau/phosphorylated tau, which is another indicator of neuronal injury, is needed.
In conclusion, our study evaluated amyloid PET imaging in patients with aMCI. One of our goals was to find a relationship between amyloid binding in different subgroups and clinical characteristics of aMCI. We found that amyloid-positive aMCI subjects were older, had the apoE4 allele. Further longitudinal follow-up study is needed to investigate if these factors can become predictors for advancement to Alzheimer's dementia in aMCI patients.
 XML Download