

 PDF
PDF ePub
ePub Citation
 Print
Print


INTRODUCTION
Subjective cognitive decline (SCD) is defined as self-experienced cognitive decline, but normal performance on standardized cognitive tests.1 Recent studies suggest that the preclinical neuropathological process of Alzheimer's disease (AD) starts several years to decades before the onset of clinical symptoms.2 Increasing evidence suggests that SCD is associated with biomarker abnormalities consistent with AD pathology,345and SCD has gained attention as a prognostic indicator of cognitive decline or dementia. According to the SCD Initiative, SCD may reflect the initial effects of AD pathology on cognitive functioning, between the period of full compensation and the first decline.1 However, some experts insist that SCD is not associated with future memory decline, but is possibly associated with depression or changes in personality traits.678 Given the lack of consensus, it is important to identify whether individuals with SCD carry an increased risk of progression to dementia.
Even though the measurement of amyloid deposition based on positron emission tomography (PET) or cerebrospinal fluid studies has high sensitivity and specificity for the early detection of AD,9 structural magnetic resonance imaging (MRI) is less expensive and readily available, and facilitates quantification of changes in brain structure.10 Cortical thinning is one of the hallmarks of AD, and measurements of cortical thickness based on MRI are highly sensitive to small structural changes across the cortex.1112 Previous studies have revealed that cortical thinning in AD-vulnerable regions was associated with AD biomarkers including CSF amyloid and p-tau.131415A number of studies have shown that an AD-like pattern of cortical atrophy was associated with future cognitive decline, and that these cortical changes already existed in individuals with mild cognitive impairment (MCI) who progress to a clinical diagnosis of AD.161718
Based on these data reported previously, we evaluated cortical thinning patterns in individuals with SCD compared with healthy normal controls (NC). We additionally studied the differences in cortical thinning patterns between SCD subjects who progressed to MCI or dementia (pSCD) and subjects who remained stable (sSCD).
METHODS
Subjects
We retrospectively enrolled patients who visited the Department of Neurology in Seoul St. Mary's Hospital with memory impairment from January 2010 to December 2012. To be eligible for the current retrospective study, subjects had to meet the following criteria: 1) a self-experienced persistent decline in cognitive capacity compared with a previously normal status, but with normal performance on detailed neuropsychological tests; 2) clinical follow-up until December 2016 and at least one additional neuropsychological evaluation after baseline study; and 3) exposure to brain MRI within 3 months of clinical assessment. As a control group, healthy individuals without dementia were recruited from the general population by advertisement. NCs were defined by a Clinical Dementia Rating score of 0 and Mini-Mental State Examination (MMSE) >27. All NCs denied any memory impairment or decreased daily activity.
All participants underwent a medical history, physical and neurological examination, in addition to laboratory tests including measurement of vitamin B12 and folate levels, syphilis serology, and thyroid function test. Additionally, APOE-ε4 genotyping was performed in the SCD groups, but not in the healthy control group. Baseline neuropsychological assessment was conducted with the Korean version of the MMSE (K-MMSE) and the Seoul Neuropsychological Screening Battery (SNSB). The SNSB consists of a digit-span task (forward and backward), the Korean version of the Boston Naming Test, the Rey Complex Figure Test (composed of copying, immediate and 20-min-delayed recall, and recognition), the Seoul Verbal Learning Test (3 learning-free recall trials involving 12 words, a 20-min delayed recall trial of these 12 items, and a recognition test), the phonemic and semantic Controlled Oral Word Association Test, and the Stroop test (word and color reading of 112 items over a 2-min period). The status of Geriatric Depression Scale (GDS) was also assessed.19 We excluded subjects who had a neurological, psychiatric, or systemic illness that might affect cognition. Individuals with brain lesions related to cognition, such as those with large artery infarctions, brain tumors, or normal pressure hydrocephalus, were also excluded.
A total of 194 subjects were diagnosed with SCD from January 2010 to December 2012. Of these subjects, 63 were followed up until December 2016 and underwent at least one additional neuropsychological evaluation after baseline study. Based on the follow-up neuropsychological studies and clinical interview, we divided the SCD subjects into 2 groups: subjects who pSCD and sSCD. We defined pSCD subjects as those who scored 1.0 standard deviation (SD) or more under the mean on the K-MMSE and at least one subtest in the SNSB during the follow-up study, and also complained of worsening memory and functioning during daily activities.2021 Among 63 total SCD subjects, 19 progressed to amnestic MCI (n=10) or AD dementia (n=9) and 44 subjects remained stable. Finally, we included 35 SCD subjects (14 in pSCD and 21 in sSCD) because no brain MRI data were available for 28 SCD subjects (5 in pSCD and 23 in sSCD).
MRI data acquisition and analysis
MRI was performed with a 1.5-Tesla MRI (Signa Excite 11.0; GE Medical Systems, Milwaukee, WI, USA) using a single-shot, spin-echo, echo-planar, diffusion-weighted sequence within 1 month after initial neuropsychological test. Three-dimensional spoiled gradient-recalled in the steady state anatomic images were acquired. Parameters were as follows: the repetition time=11.9 ms, the echo time=5.0 ms, matrix=256×224 mm, field of view=240 mm×240 mm, number of excitations=1, slice thickness=1 mm with no inter-slice gap.
Each MRI dataset was processed using FreeSurfer v5.3.0 (http://surfer.nmr.mgh.harvard.edu), an image processing software tool, for 1) an automated model-based reconstruction and segmentation of the brain's cortical surface and subcortical structures and 2) morphometric analysis. Finally, a variety of morphometric measures were computed across 180 anatomically-defined brain regions as MRI features for classification, including cortical and subcortical volumes, mean cortical thickness (and its SD), surface area, and curvature.22
Following completion of the automated FreeSurfer pipeline, all scans were reviewed to assess the quality of skull stripping and ensure that cortical surfaces followed the gray and white matter boundaries. Manual edits were performed to improve segmentation and parcellation accuracy, as needed. The editing procedure was conducted by a single researcher blinded to the diagnostic status of the subjects.
Statistical analysis
To compare baseline demographic characteristics and neuropsychological test results between the 3 groups (pSCD, sSCD, and NC) we used 1-way analysis of variance followed by the Bonferroni post hoc test. For comparison of cortical thickness between the groups, analysis of covariance (ANCOVA) test followed by a post hoc Duncan test, adjusting for age, was used. We repeated ANCOVA adjusting for age and mean cortical thickness to evaluate the differences in relative cortical thickness between the pSCD and the sSCD groups. All statistical analyses were performed using SPSS Statistics 20, release version 18 (SPSS Inc., Chicago, IL, USA). The statistical significance threshold was set at p < 0.05.
RESULTS
Baseline demographics and neuropsychological test results
Table 1 shows the baseline demographic characteristics. The pSCD group was significantly older than both the sSCD and the NC groups (mean age [year]: pSCD, 78.07±3.65; sSCD,70.71±6.11; NC, 69.45±5.30; p=0.000). There was a preponderance of females in all groups. The mean follow-up duration was 5.14±0.93 years in the pSCD group and 5.26±0.87 years in the sSCD group. The prevalence of hypertension was higher in the pSCD group compared with the sSCD and NC groups (pSCD, 57.14%; sSCD, 19.04; NC, 17.24; p=0.013). The pSCD group had higher scores on the GDS (pSCD,17.64±9.00; sSCD, 10.48±6.31; NC, 9.97±5.96; p=0.003). The APOE-ε4 genetic status was analyzed only in the SCD groups, and was slightly higher in the pSCD group compared with the sSCD group, but there was no statistically significant difference (pSCD, 42.85%; sSCD, 23.80%; p=0.283).
Table 1
Baseline demographic and neuropsychological test results
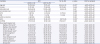
Data are presented as mean±standard deviation for continuous variables or number (%) for categorical variables.
SCD: subjective cognitive decline, pSCD: subjective cognitive decline subjects who progressed, sSCD: subjective cognitive decline subjects who remained stable, NC: normal controls, F/U: follow-up, HTN: hypertension, DM: diabetes mellitus, GDS: Geriatric Depression Scale, K-MMSE: Korean-version of the Mini-Mental State Examination, RCFT: Rey Complex Figure Test, COWAT: Controlled Oral Word Association Test.
*Variables differ significantly (p<0.05) between SCD and NC; †Scores of neuropsychological tests are shown in percentile scores.
![]()
Table 1 also shows the differences in baseline cognitive measures between all the groups.
No difference in baseline MMSE score was found between the groups. In comprehensive neuropsychological test, the SCD groups (both pSCD and sSCD) showed poorer performance on the verbal delayed recall test (pSCD, 51.10±27.91; sSCD, 68.25±25.31; NC, 86.26±12.58; p<0.001) and verbal recognition test (pSCD, 54.37±24.42; sSCD, 68.07±24.69; NC, 77.82±18.01; p=0.006) compared with the NC group.
Cortical thickness comparison
Table 2 shows the age-adjusted means of cortical thickness in different regions of each hemisphere in all the study participants. Among all groups, the sSCD group showed the lowest mean cortical thickness in bilateral hemisphere (left pSCD, 2.27±0.04; sSCD, 2.22±0.03; NC, 2.31±0.02; p=0.032 and right pSCD, 2.24±0.04; sSCD, 2.21±0.02, NC, 2.28±0.02; p=0.05). Compared with NC group, the sSCD group showed diffuse cortical atrophy in the bilateral fronto-parieto-temporal area. However, the pSCD group showed more characteristic cortical atrophy in AD-vulnerable regions including the inferior parietal gyrus (pSCD, 2.14±0.05; NC, 2.25±0.04; p=0.026), inferio temporal gyrus (pSCD, 2.53±0.06; NC, 2.69±0.04; p=0.014), and middle temporal gyrus (pSCD, 2.65±0.05; NC, 2.72±0.04; p=0.031) compared with the NC group. Between the pSCD and sSCD groups, there were differences in cortical thinning of multiple areas across the bilateral fronto-parietal-temporal lobe in the sSCD group.
Table 2
Age-adjusted means (±standard error) of cortical thickness between SCD and NC
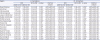
Data are presented as mean±standard deviation for continuous variables.
Lt: left, Rt: right, SCD: subjective cognitive decline, pSCD: subjective cognitive decline subjects who progress, sSCD: subjective cognitive decline subjects who remained stable, NC: normal controls.
*Variables differ significantly (p<0.05) between SCD and NC.
![]()
We performed additional analysis of differences in relative cortical thickness between the 2 groups (pSCD vs. sSCD) by adjusting the mean cortical thickness and age (Table 3, Fig. 1). We found that the thickness of bilateral medial orbitofrontal gyrus (left pSCD, 2.48±0.04; sSCD, 2.33±0.03; p=0.017 and right pSCD, 2.46±0.05; sSCD, 2.30±0.04; p=0.014) was significantly lower in the sSCD group and the thickness of the left precentral (pSCD, 2.23±0.03; sSCD, 2.31±0.02; p=0.034) and right inferior temporal cortex (pSCD, 2.48±0.04; sSCD, 2.57±0.03; p=0.044) was significantly lower in the pSCD group.
Table 3
Cortical thickness adjusted for age and mean cortical thickness between pSCD and sSCD
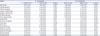
Data are presented as mean ± SD for continuous variables.
Lt: left, Rt: right, pSCD: subjective cognitive decline subjects who progress, sSCD: subjective cognitive decline subjects who remained stable.
*p<0.05 (pSCD < sSCD); †
p<0.05 (pSCD > sSCD).
![]()
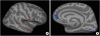 | Fig. 1Cortical thickness adjusting mean cortical thickness between pSCD and sSCD. The SCD subjects who progressed showed cortical thinning in the inferior temporal area (A), in the other hand, the SCD subjects who remained stable showed cortical thinning in the bilateral medial frontal area (B).pSCD: subjective cognitive decline subjects who progress, sSCD: subjective cognitive decline subjects who remained stable, SCD: subjective cognitive decline.
|
DISCUSSION
In the present study, we found that individuals who progress from normal cognition to MCI or dementia already showed cortical atrophy in the inferior parietal, inferior temporal, and middle temporal regions, which are known as regions vulnerable to AD,16 approximately 5 years before they showed objective clinical symptoms. Several studies have investigated the association between SCD and structural changes in the brain. Peter et al.23 found that individuals with subjective memory impairment (SMI) showed greater similarity to AD gray matter patterns compared with control subjects without SMI. Schultz et al.24 showed that middle-aged adults with SMI had significantly thinner cortices in the entorhinal, fusiform, posterior cingulate, and inferior parietal regions compared with individuals without SMI. Meiberth et al.25 also showed that subjects with SMI exhibited reduced thickness in the left entorhinal cortex. Our results are consistent with previous findings and validate the hypothesis that SCD is the first presentation of AD. Previous studies have shown that amyloid beta deposition is associated with cortical thickness reduction in parietal and posterior cingulate regions extending into the precuneus, which are known to be AD-susceptible brain regions.15262728 These findings suggest that individuals with cortical thinning in the AD-vulnerable brain regions represent a population that is at increased risk for progression to AD.
Interestingly, the SCD subjects who remained stable showed diffuse cortical thinning patterns across the fronto-parieto-temporal area compared with the pSCD subjects as well as the NC subjects. Cortical thickness is influenced by multiple factors such as genetics,29 aging,30 traumatic brain injury,31 physical activity,32 and cardiovascular disease.33 Although these factors induce cortical thinning in brain and affect cognition, they do not reflect ongoing pathology, and do not affect disease progression in SCD subjects. Therefore, we suggest that the distribution of relative cortical thinning rather than the overall cortical thickness may be a more sensitive prognostic biomarker of progression in subjects with SCD.
In our study, the pSCD group showed a lower performance in verbal memory test compared with the sSCD and NC groups. Amariglio et al.4 found that SMC patients exhibited decreased episodic and working memory. Scheef et al.34 also found a decline in episodic and immediate verbal memory in SMC patients. Similar to medial temporal lobe atrophy, deficits in verbal episodic memory are an early feature of AD.35 Therefore, our findings suggest that decreased performance in episodic memory also correlated with progression in SCD subjects.
We showed that the pSCD group scored higher on the depression score compared with the other groups. Hollands et al.8 insist that subjective ratings of cognitive impairment are strongly associated with depressive and anxiety symptoms more than amyloid pathology.8 However, rather than possible memory deterioration due to depression, depression may be common in SCD subjects because it is known to be associated with the early stages of AD.36
Our study has limitations that should be addressed in future studies of patients with SCD. First, we did not confirm the presence of amyloid pathology based on amyloid PET scan or CSF study. The SCD is a heterogenous group with a multifactorial etiology, and therefore, the pSCD group may also include patients diagnosed with other neurodegenerative diseases such as frontotemporal dementia or Lewy body dementia. Second, our mean follow-up duration was 5.14±0.93 years in the pSCD group and 5.26±0.87 years in the sSCD group. Pettigrew et al.37 showed that cortical thinning in AD-vulnerable regions was associated with an increased risk of progression from normal cognitive status to clinical symptom onset within 7 years of baseline, but not exceeding 7 years from baseline. Becker et al. 26 suggested significant association between MRI thickness and time-to-symptom onset in individuals who advanced to MCI.
Accordingly, our follow-up duration might be too short to observe cognitive changes in all of the SCD subjects and it is possible that some of the sSCD subjects will progress to MCI or AD in the future. Finally, our study was not prospective, and had a relatively small sample size, particularly in the pSCD group. Thus, the causal relationship is unclear. Nevertheless, it is meaningful in demonstrating the differences in cortical thinning patterns between SCD subjects who progressed and those who remained stable because the SCD group is very heterogenous.
In conclusion, our results showed that SCD subjects exhibit different cortical thinning patterns according to their prognosis. The SCD subjects who eventually progress to MCI or dementia already showed cortical thinning in the brain regions vulnerable to AD. These results suggest that SCD represents a potential preclinical stage of AD and SCD subjects with distinct cortical thinning patterns should receive greater attention.
 XML Download