

 PDF
PDF Citation
 Print
Print


INTRODUCTION
Sjögren's syndrome (SS) is a complex heterogeneous disease clinically defined by the presence of salivary and lacrimal gland dysfunction. In addition to sicca symptoms such as xerostomia and xerophthalmia, SS is characterized by autoimmune features including hypergammaglobulinemia and abundance of autoantibodies (1-3). Whether the presence of focal lymphocytic infiltrates in exocrine glands is a critical feature of SS is still the subject of debate, because of the fact that approximately 20% of patients with primary SS do not have such infiltrates (4). SS can occur in isolation or as a secondary feature of other autoimmune diseases, particularly systemic lupus erythematosus and rheumatoid arthritis (RA). The prevalence of secondary SS among RA patients varied from 4% to 31%, depending on studies (5-7). Coexistence of RA with SS seems to lead to a poor prognosis, since such patients have a 2-fold increased risk of non-Hodgkin's lymphoma and a tendency toward increased mortality compared with RA patients without secondary SS (8).
Although the pathogenic processes leading to the SS exocrinopathy have not been fully elucidated, it is generally agreed that a repertoire of autoreactive lymphocytes is established in the peripheral immune system of genetically predisposed individuals, presumably as a result of the breakdown of self-tolerance (9). Such autoreactive cells are activated upon exposure to autoantigens and give rise to effector T cells and Ab-producing cells. These effector cells and/or their products migrate to glandular tissues and cause histopathologic changes, finally leading to loss of glandular functions. However, the exact basis of the effects of the effector cells, in particular the types of effector cells involved and the types of active molecules and kinetics of the immune responses, remains to be clarified.
Many studies with humans and mice have suggested that the Th17 subset of CD4+ T effector cells is implicated in the pathogenesis of SS. Th17 cells are present in the glandular tissue of patients with primary SS, with some evidence linking their activity to disease severity (10). In mouse models of SS, Th17 cells orchestrate inflammatory responses in glandular tissues by stimulating other cells, such as stromal cells, epithelial cells, and endothelial cells, to release proinflammatory cytokines and matrix metalloproteases (11). In addition to such a cell-mediated mechanism, Th17 cells may contribute to humoral immune responses, since they are able to regulate isotype class switching of activated B cells, glycosylation of autoreactive Abs, and germinal center formation (12-14). However, it is unclear whether these indirect effects of Th17 cells are also involved in the pathogenesis of SS.
The SKG strain of mice is a BALB/c congenic line bearing a W163C mutation of Zap70, which is a typical model of autoimmune arthritis reminiscent of human RA (15). Due to the loss-of-function mutation, thymic selection is compromised and a substantial number of highly self-reactive T cells develop. When the mice are exposed to β-glucan, an agonist of the Dectin-1 receptor on dendritic cells, the self-reactive T cells are activated and preferentially differentiated into Th17 cells (16,17); arthritogenic Th17 cells then migrate to distal joints and play a pivotal role in the development of chronic inflammatory arthritis. More recently, SKG mice have been shown to develop diseases other than RA-like arthritis, such as spondylarthritis and ileitis (18). This suggests that SKG autoimmunity has a broader impact, but whether it is sufficient to precipitate the SS pathology remains unknown.
This study was undertaken to determine whether SKG mice are susceptible to SS, and if so, what mechanism underlies this effect. We found that Th17-elicited SKG mice develop xerostomia in a manner independent of local inflammation. This is associated with elevated levels of autoantibody against the muscarinic type 3 receptor (M3R). Moreover, the sera containing anti-M3R IgG were able to block M3R-mediated Ca2+ signaling, which is essential for salivation. Thus, our results provide evidence of how Th17-driven production of autoantibody contributes to hypofunction of the salivary glands and how xerostomia can occur without the focal lymphocytic infiltrates seen in a substantial proportion of patients with SS.
MATERIALS AND METHODS
Mice
The breeders of SKG mice on a BALB/c background were originally kindly donated by Dr. Shimon Sakaguchi (Osaka University, Japan), and their descendants were bred and maintained in a specific pathogen-free (SPF) barrier facility at Hanyang University. This study was approved by the Institutional Animal Care and Use Committee (HY-IACUC-2017-0082 and -2018-0155). All animal experiments were carried out in strict accordance with guidelines and regulations.
Disease induction and evaluation
Purified curdlan was purchased from Wako (Osaka, Japan) and resuspended in PBS. Female SKG mice at 7–8 weeks of age were injected intraperitoneally with curdlan at a dose of 3 mg/mouse (18). The mice were examined every week to measure the ankle thickness and disease scores of hind paws, as previously described, with modifications in the scoring scale (15). The maximal score per mouse was 7, and scores are expressed as the mean arthritic index on a given day. To measure saliva, mice were anesthetized and injected intraperitoneally with pilocarpine (Sigma-Aldrich, St. Louis, MO, USA) at 5 mg/kg body weight to induce saliva production. One min after injection, saliva was collected from the oral cavity for 3 min.
FACS analysis
Joint-draining (axillary and inguinal) and cervical lymph node (cLN) cells from SKG mice were analyzed by FACS, as previously described (19). Anti-CD4-PerCP, anti-IFNγ-FITC, and anti-IL-17A-PE were purchased from BD Biosciences (San Jose, CA, USA) or eBioscience (San Diego, CA, USA).
Histopathologic examination
Submandibular salivary glands were removed post mortem from SKG mice that had been injected with curdlan or PBS 8–10 weeks previously. Paraffin-embedded tissue sections were prepared and stained with H&E as described (19). In some experiments, tissue sections were stained with anti-CD45 IgG (Leica Biosystems, Newcastle, UK) or with anti-mouse IgG-biotin (Sigma-Aldrich), and examined by standard immunohistochemical methods, as described (19). Hematoxylin was used for counter staining.
ELISA and ELISPOT assay
Sera were collected from curdlan- or PBS-injected SKG mice, diluted 1:1,000 in PBS, and assayed by standard sandwich ELISA, as described (19). Salivary gland extracts were prepared and used as a source of Ags in ELISA. The mouse serum containing the highest titer of each Ab was serially diluted and used as a standard. Ab-secreting cells were enumerated by standard ELISPOT methods (19). Data are presented as numbers of Ab-secreting cells per 2×10⁵ cells, with background subtracted.
Microfluorometry
A human submandibular salivary gland cell line obtained from Dr. Miyazaki (20) was used to measure the carbachol-evoked increase in the concentration of cytosolic Ca2+ ([Ca2+]i) using digital video microfluorometry with a camera (C11440; Hamamatsu, Shizuoka, Japan) coupled to a microscope (IX70; Olympus, Center Valley, PA, USA) and a computer with Metafluor software (Universal Imaging, Bedford Hills, NY, USA), as described (21) with modifications. In brief, cells were placed on glass coverslips in a solution of 0.1 mg/ml poly-L-ornithine (Sigma-Aldrich) and incubated for 90 min with 1:10-diluted serum collected from either curdlan- or PBS-injected SKG mice 8–10 weeks after injection. The cells were incubated with 2 μM fura-2 acetoxymethyl ester (Molecular Probes, Eugene, OR, USA) for 40 min at 37°C. After washout, the coverslips were placed on the platform of a perfusion chamber on the stage of a microscope and perfused with extracellular solution in the presence or absence of 100 μM carbachol at a flow rate of 3 to 5 ml/min. Single cells were excited every 500 msec with 340 nm and 380 nm light, and emission at wavelength 510 nm was measured. The ratio of fluorescence intensity at 340 nm to that at 380 nm (F340/F380), which represents [Ca2+]i, was recorded. Approximately 100 light-sensitive cells per coverslip were recorded individually, and 2–3 coverslips per sample were examined.
Amylase assay
The anterior lobes of parotid glands were isolated from normal C57BL/6 mice, incubated in RPMI 1640 medium supplemented with 10% FBS for 60 min in the presence of 1:5-diluted mouse serum, and treated with 1 μM carbachol for 15 min. The culture supernatants were assayed to measure α-amylase activity using Amylase Assay Kit (Sigma-Aldrich), according to the manufacturer's instructions. Amylase activity was displayed as mU/ml per mg wet weight, as described (22).
RESULTS AND DISCUSSION
SKG mice exhibit xerostomia upon systemic exposure to curdlan.
SKG mice are a model of autoimmune arthritis in which Th17 cells directly orchestrate chronic inflammatory responses in the synovia. Inflammatory responses occur spontaneously under standard conditions or can be induced by administration of β-glucans such as curdlan and laminarin under SPF conditions. The SKG mice remained healthy in our SPF facility, and none developed spontaneous diseases such as arthritis, spondylarthritis, ileitis, and sicca symptoms. When they were injected with curdlan, Th17 cells developed with variable kinetics depending on the location of lymph nodes (LNs). The proportion and number of IL-17+IFN-γ−CD4+ Th17 cells increased markedly at 3 weeks post-injection in joint-draining LNs and at 8 weeks post-injection in cLNs (Fig. 1A-C). The increase in the proportion of IL-17−IFN-γ+CD4+ Th1 cells was also evident at 3 weeks post-injection in joint-draining LNs but not at 8 weeks post-injection in cLNs (Fig. 1A-C). In a parallel approach, clinical manifestations of joints and salivary glands were examined by measuring ankle thicknesses and arthritic indexes of hind paws and amounts of saliva, respectively. Symptoms of arthritis in the curdlan-injected mice were evident from week 2 post-injection and reached a peak in week 5 post-injection, at which time saliva flow rate was not altered (Fig. 1D and E). However, the saliva flow rate was significantly reduced in the curdlan-treated mice 8 weeks after curdlan treatment. Therefore, the onset of xerostomia is delayed by approximately 6 weeks with respect to the onset of arthritis, and this delay is consistent with the later emergence of Th17 cells in cLNs than in joint-draining LNs. These results together suggest that Th17 cells elicited by curdlan administration are associated with the development of secondary SS as well as arthritis.
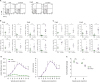 | Figure 1Arthritis and xerostomia of curdlan-injected SKG mice. SKG mice were injected with curdlan or PBS. (A-C) Joint-draining LNs (B) and cLNs (A and C) at weeks 3 and 8 post-injection were assayed by FACS. Representative FACS profiles gated on CD4+ cells and percentages and numbers of IL-17+IFNγ− CD4+ and IL-17−IFNγ+ CD4+ cells are shown. (D) Ankle thickness and arthritic indexes were measured every week (n=3–4/group). (E) Mice were injected with pilocarpine, and saliva was collected at the indicated time. Graphs display means±SEMs (B-D) or ±SDs (E) with symbols representing the values of individual mice. All data are representative of more than 3 independent experiments.NS, not significant.
*p<0.05, **p<0.01, ***p<0.001 by 2-way ANOVA (D) and Student's t-test (B, C, and E).
|
Salivary glands from curdlan-treated SKG mice contain IgG deposits without focal leukocyte infiltrates
We next enquired by histopathologic methods whether the xerostomia shown in the SKG mice was associated with inflammatory damage to the salivary glands. Despite reduced saliva production, the salivary glands from curdlan-treated mice contained almost no immune cell infiltrates as tested in both the H&E and anti-CD45 staining assays (Fig. 2A and B). However, IgG deposits were clearly more prominent in the serous acini of salivary glands from the curdlan-injected SKG mice than those from the PBS-injected controls (Fig. 2C). Thus, these results demonstrate that xerostomia occurs in a manner independent of inflammatory attack by immune cells, and suggest that IgG deposits play a role in triggering dysfunction of the salivary glands.
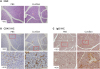 | Figure 2IgG deposition without immune cell infiltration in salivary glands from curdlan-injected SKG mice. SKG mice were injected with curdlan or PBS and subjected to histopathologic examination 8 weeks later. Tissue sections of salivary glands were stained with H&E (A), anti-CD45 Ab (B), and anti-IgG Ab (C). Photographs are representative of more than 3 individuals. Original magnifications are ×100 and ×400. The boxed areas were magnified in ×400 images.IHC, immunohistochemistry.
|
Serum titers of autoantibodies specific for salivary glands are elevated in curdlan-injected SKG mice
The evidence for IgG deposition in the salivary glands of curdlan-treated SKG mice prompted us to examine the profiles of the autoantibodies present in these mice. The serum titer of whole IgG was significantly elevated 5–10 weeks after curdlan injection, indicative of the hypergammaglobulinemia that is a hallmark of SS (Fig. 3A). Abs reactive to salivary gland extracts were also more abundant at 8–10 weeks, but not at 5 weeks, post-injection (Fig. 3B). The titer of anti-SSA/Ro IgG was too low to be detectable (not shown), and the level of anti-SSB/La IgG was not significantly altered by curdlan injection (Fig. 3C). Importantly, the titer of anti-M3R IgG was significantly elevated 8-10 weeks after injection with curdlan (Fig. 3D). IgG1 was the predominant subclass of anti-M3R IgG, and there was little IgG2a and IgG3 (Fig. 3E). Consistent with this, cells secreting anti-M3R IgG were significantly more numerous in the spleens, but not in the cLNs and bone marrow, of curdlan-treated SKG mice than in their counterparts (Fig. 3F). Thus, these results demonstrate that, although whole Ab responses were enhanced early after Th17 cells were elicited, the production of salivary gland-specific autoantibodies was delayed. And, importantly, this autoantibody production coincided with reduced saliva production. The reason for the delay is unclear, but we speculate that the production of salivary gland-specific autoantibodies may require epitope spreading, which takes place as a result of initial glandular tissue injury. The predominance of IgG1 among the IgG subclasses of anti-M3R Ab supports the idea that the activities of Th17 cells are involved in its production, in agreement with previous reports indicating that the class switching effect of Th17 cells is more pronounced for IgG1 than for IgG2a or IgG3 (12).
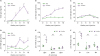 | Figure 3Features of autoantibody production in curdlan-injected SKG mice. SKG mice were injected with curdlan or PBS. (A-E) Serum was collected at the indicated times and assayed by ELISA to measure titers of total IgG (A), anti-SGE IgG (B), anti-SSB IgG (C), anti-M3R IgG (D), and subclasses of anti-M3R IgG (E). (F) Spleen, cLNs and BM were harvested 8 weeks post-injection, and assayed by ELISPOT to enumerate anti-M3R Ab-secreting cells per 2×10⁵ cells. Graphs display means±SEMs with or without symbols representing the values of individual mice.Data are pools of 3 (A-D, n=6–8 per group) or 2 (F) independent experiments, and representative of 2 independent experiments (E).
AU, arbitrary units; NS, not significant; BM, bone marrow; SGE, salivary gland extract.
*p<0.05, **p<0.01, ***p<0.001 by Student's t-test.
|
Serum from curdlan-injected SKG mice inhibits M3R-mediated Ca2+ signaling in salivary gland cells
M3R is exclusively expressed on exocrine glands, and M3R-mediated signals are essential for saliva production by salivary acinar cells (23,24). Cholinergic stimulation of M3R triggers a signaling cascade that starts with an increase in [Ca2+]i and ends in secretion of saliva. We hypothesized that the anti-M3R IgG autoantibody enriched in the curdlan-injected SKG mice is deposited on salivary acinar cells, binds to M3R, and inhibits M3R-mediated signaling, so leading to xerostomia. To test this idea, we examined by microfluorometry the effect of serum from curdlan-treated mice on the carbachol-evoked increase in [Ca2+]i in salivary gland cells. After exposure to 100 µM carbachol for 15 s, F340/F380, which represents [Ca2+]i, increased transiently. The magnitude of the increase [Δ(F340/F380)] in individual cells varied from <0.01 to >0.05, pointing to variable responsiveness of individual cells to cholinergic stimulation (Fig. 4A). Importantly, the proportion of cells exhibiting Δ(F340/F380) of <0.01 was significantly higher, and the proportions of cells exhibiting Δ(F340/F380) of 0.01–0.02 and 0.02–0.03 were significantly lower among the cells pretreated with serum from curdlan-injected SKG mice than among those pretreated with serum from control SKG mice (Fig. 4B). When salivary gland cells were exposed to carbachol for 2 min, they showed persistent Ca2+ oscillations (Fig. 4C), as shown previously (25). Pretreatment of cells with serum from curdlan-treated mice resulted in a greater reduction in the frequency of oscillating waves than pretreatment of cells with serum from control mice (Fig. 4D).
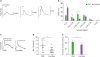 | Figure 4Inhibition of M3R-mediated Ca2+ signaling by serum from curdlan-injected SKG mice in salivary gland cells. (A-D) Submandibular salivary gland cells were pretreated with serum from PBS- or curdlan-injected SKG mice for 90 min. The cells were loaded with fura-2, perfused with CCh for 15 s (A and B) or 2 min (C and D), and assayed by microfluorometry. (A) Representative graphs displaying the F340/380 values of 3 cells. Values of Δ(F340/F380) are indicated by arrows. (B) Percentages of cells showing each range of Δ(F340/F380). Data are displayed as means±SEM of 2–3 independent experiments. (C) Representative profiles of Ca2+ oscillating waves. (D) Numbers of oscillating waves. The data are representative of 2–3 independent experiments. (E) Parotid salivary glands were pretreated with serum from PBS- or curdlan-injected SKG mice and assayed to measure amylase activity (mU/ml) per wet weight (mg) of the gland (n=5 per group pooled from 2 independent experiments).CCh, carbachol.
*p<0.05 and **p<0.01 by Student's t-test.
|
Next, we examined the effect of serum from curdlan-treated mice on the carbachol-induced saliva secretion by salivary glands. To this end, parotid salivary glands were incubated with serum from either curdlan- or PBS-treated mice, and the carbachol-evoked secretion of amylase, an abundant salivary component, was assessed. We found that amylase secretion was significantly reduced in the glands preincubated with serum from curdlan-treated mice, compared to those from PBS-treated controls (Fig. 4E).
These results demonstrate that serum from curdlan-injected SKG mice dampens M3R-mediated signaling, and suggest that the anti-M3R IgG Ab enriched in the serum acts as an antagonist to M3R engagement with cholinergic stimulators. This is in line with previous studies showing that IgG from patients with SS inhibited carbachol-evoked Ca2+ influx (26,27). Therefore, the hypothesis based on findings in the SKG salivary glands appears to be applicable to the pathogenesis of SS in humans.
Given that IgG deposition onto target tissue is usually accompanied by complement- and FcR-mediated inflammatory responses, it is puzzling why the salivary gland tissue of the treated mice showed no signs of inflammation. We believe the answer lies in the result showing that anti-M3R Ab is mostly of the IgG1 subclass, since murine IgG1 is ineffective in terms of complement and FcR activation (28). Furthermore, it even prevents interaction of other IgG subclasses with C1q and interacts preferentially with the classical IgG inhibitory receptor FcγRIIb. In the light of this, it seems likely that the anti-M3R IgG1 deposited in salivary glands prevents complement- and FcR-mediated inflammation, while serving as an antagonistic Ab.
In summary, we have demonstrated that SKG mice develop secondary SS without any focal leukocyte infiltrate in the salivary glands. The mechanism underlying this phenomenon includes Th17-mediated production of anti-M3R IgG1 autoantibody, which interferes with cholinergic signals essential for salivation and leads to hypofunction of the salivary glands. This effect is similar to that seen in myasthenia gravis, in which autoantibody specific for the nicotinic acetylcholine receptor causes dysfunction of the target tissue (29). We also showed for the first time that the function of Th17 cells in SS development in the SKG mice is different from that in arthritis development in these mice, as well as from that in SS development in other models in which Th17 cells orchestrate inflammatory responses in target tissue. In this context, our study identifies SKG mice as a further example of the pathophysiology of human secondary SS occurring without focal leukocyte infiltration.
 XML Download