

 PDF
PDF ePub
ePub Citation
 Print
Print


Introduction
The emerging practicality of digital modeling has prompted ongoing research into the accuracy of the technique. Analyses using models must be accurate to ensure proper diagnosis and treatment planning. Therefore, many studies have evaluated the precision of tooth measurements made using digital models and reported that digital models appear to be clinically acceptable and reproducible for making orthodontic diagnoses, similar to conventional models.1234 In recent years, digital models have been applied to simulate virtual tooth alignment and to fabricate orthodontic appliances such as clear aligners and indirect bonding trays using 3-dimensional (3D) printers.5 However, problems with the suitability of appliances can emerge if the accuracy of these models is lower than that of the plaster models conventionally used to manufacture appliances.
An alternative method is to construct a digital model using cone-beam computed tomography (CBCT), which is a volume scanning method that can acquire data quickly without being influenced by the shape of the subject around the area of undercut and proximal contact.6 In recent years, CBCT has been more frequently used, and the resolution of CBCT has improved to 0.07–0.1 mm for 3D analysis and diagnosis of the maxillofacial region.7 Thus, digital model fabrication using scans of patient impressions obtained with CBCT in a dental office is a way to create a model without the aid of an intraoral scanner or a special model scanner, and without directly irradiating the patient. If necessary, digital models and plaster models can be fabricated using a single impression.8
In previous studies, the dimensional accuracy of digital models obtained from CBCT scans of alginate impressions was examined according to the elapsed time.89 However, no published study has evaluated the dimensional accuracy of digital models obtained using CBCT. Therefore, there is a lack of studies investigating the accuracy of digital models produced using CBCT, and the width of individual teeth and the entire arch obtained using a digital model must be validated.
The purpose of this study was to evaluate the accuracy of measurements of the total dental arch by comparing the total arch geometry and tooth size in plaster models with scanned digital models constructed from CBCT scans of polyvinyl siloxane (PVS) impressions.
Materials and Methods
The subjects were 20 patients (5 men, 15 women; mean age, 23.8 years) who visited the Department of Orthodontics, College of Dentistry, Yonsei University. All subjects provided informed written consent. The study was approved by the University's Institutional Review Board Ethics Committee (IRB CRNo:2-2016-0021). All subjects fulfilled the following criteria: complete permanent dentition from first molar to first molar; no fixed orthodontic treatment history; and <6 mm of crowding. Patients with a history of orthognathic surgery, missing teeth, or mixed dentition were excluded.
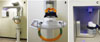
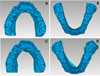
A pair of impressions was made using a plastic tray and PVS in each patient. Within 1 hour after taking the impression, the impression was scanned using CBCT (Rayscan α+, Ray Co., Ltd., Seongnam, Korea) with the following imaging parameters: a spatial resolution of 100 µm, 14.0 seconds, 70 kVp, and 16 mA (Figs. 1A and B). Cast models were fabricated using standard methods by pouring plaster (Rhombstone White; Ryoka Dental, Mie, Japan). Each plaster cast was scanned using a blue-light-emitting diode model scanner with ±7 µm precision (Identica Hybrid; Medit Co, Seoul, Korea, Fig. 1C) and a digital model of the cast was obtained (Figs. 2A and B). The obtained CBCT data were also converted into stereolithography (STL) files using the RayDent converter program (Ray Co., Ltd., Seongnam, Korea) and stored (Figs. 2C and D). Linear values of the digital models were measured using reverse engineering software (Geomagic Control 2015; 3D Systems, Rock Hill, SC, USA) and saved to an accuracy of 1/100 mm.
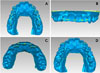
Tooth width was measured at the greatest width in the occlusal view for the posterior teeth and the labial view for the anterior teeth (Figs. 3A and B). Before making the measurements, it was confirmed that the line between the 2 measuring points was parallel to the central groove and perpendicular to the axis of the crown when measuring the posterior teeth. It was confirmed that the line between the 2 measuring points was perpendicular to the axis and that both measuring points were in the middle of the labio-lingual distance on the incisal view (Fig. 3C). If this was not the case, the measurement was repeated (Table 1).
Arch width was defined as the distance between the central fossae of both first molars and between the tips of the cusp of the canines. The anterior and overall Bolton ratios were calculated for each model (Fig. 3D). Two examiners working independently repeated all measurements twice 2–3 weeks later.
To compare the cast scan model and the CBCT scan model of each participant, the 2 models were superimposed using the best-fit method using reverse engineering software, and a 3D comparative analysis was performed to ascertain differences between the 2 models using the nearest-neighbor method. The distance from 50,000 to 70,000 points was measured according to the resolution. The absolute value of 5% to 95% of the deviation values, excluding the 5% upper and lower values, was statistically processed.
Intraclass correlation coefficients (ICCs) were calculated to confirm reproducibility, after which the Shapiro-Wilk test was used to test the normality of the distribution of data for differences between the cast scan model and the CBCT scan model. Once a normal distribution was confirmed, each measured value was divided into upper and lower parts using the paired t-test. The anterior Bolton ratio and overall ratio were compared using the paired t-test. Differences in the digital model overlays according to the scanning method are reported as descriptive statistics (median, mean, standard deviation [SD], maximum [max], minimum [min]). All statistical analyses were performed using SPSS version 23 (IBM Corp., Armonk, NY, USA).
Results
The range of ICC values for the two observers (0.987–0.999) indicated that the measurements were reliable. The differences in the measurements of the cast scan models ranged from −0.15 mm to 0.16 mm for the CBCT scan models. Statistically significant differences between the maxillary cast scan models and the CBCT scan models were found for the right first molar (P<0.05) and inter-canine width (P<0.05). For the mandibular models, a statistically significant difference was found for the left canine (P<0.05) between the cast scan models and the CBCT scan models; however, no difference exceeded 0.2 mm (Table 2).
The differences in the Bolton ratio between the cast scan models and CBCT scan models were −0.87 mm for the anterior Bolton ratio and −0.72 for the overall Bolton ratio. The anterior and overall Bolton ratios of the cast scan models were smaller than those of the CBCT scan models; however, the difference was not statistically significant (Table 3).
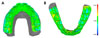
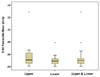
Based on the analysis of superimposed models, a significant difference was found between the interproximal area and the cusp of the tooth in the maxillary canines and the mandibular first and second molars (Fig. 4). A quantitative analysis of the superimposed models revealed average differences of 56 µm at the maxilla, 50 µm at the mandible, and 53 µm at the maxillary and mandibular arches (Fig. 5).
Discussion
There was a significant difference between the cast scan models and the CBCT scan models in the mesio-distal width of the maxillary right first molar and mandibular left canine, as well as in the maxillary inter-canine width. However, inconsistent results have been reported in previous studies regarding discrepancies in tooth size between plaster and digital models.610 Such discrepancies can result from variety in teeth alignment patterns, as well as variation in tooth anatomy and the direction of visual inspection. In many studies comparing plaster and digital models, differences in tooth width measurements of <0.20 mm to 0.27 mm relative to manual measurements have been considered clinically acceptable.14111213 In this study, the mean difference in tooth width was within 0.15 mm, which was clinically acceptable.
In the present study, the differences between the 2 models for the anterior and overall Bolton ratios were 0.87 and 0.72, respectively; however, these differences were not statistically significant. In a previous study, plaster models, CBCT scan models, and intraoral scan models demonstrated differences in the anterior and overall Bolton ratios of 0.98 and 0.82, respectively.10 In this study, similar differences were found. It is believed that the error in the Bolton ratio was larger than its magnitude for individual teeth because it is calculated from the sum of many tooth widths.
Extreme discrepancies were excluded from the evaluation of arch distortion(s) and dimensional discrepancies of the cast scan and CBCT scan models. During impression-taking and model-making, bubbles can be generated, which lead to errors, and a significant deviation was observed in the optimal superposition of the 2 models. To compensate for this error, the average of the remaining values, except for the upper and lower 5% deviation values, was calculated to yield an average difference of 53 µm. In a previous study, the 10% upper and lower deviation values were excluded.14 In contrast, by excluding only the upper and lower 5% of deviation values, this study took a more conservative approach to the comparison and analysis.
Overall, there was a significant difference between the interproximal area and the cusp of the tooth. In scans using a model scanner based on blue LED light, diffuse reflection occurs at the undercut and line angle, resulting in an inaccurate 3D representation of the adjacent tooth.6 Therefore, if there is severe crowding, the optical approach to the adjacent region in the model may be limited, possibly leading to errors in the mesio-distal width of the tooth or in the model analysis.15 There was no reference model in this study; therefore, the degree to which the accuracy of the interproximal area of the CBCT scan model could be evaluated was limited.
Instead of an alginate impression material, which has large variation in deformation with respect to elapsed time and ambient humidity after setting, PVS was used to improve the accuracy of model fabrication because of its high volumetric consistency and fine-detail reproducibility. In previous studies, the rate of volume change in PVS impression material over time was reported to be 0.02% for 1 hour and 0.07% for 24 hours,16 and CBCT was performed within 1 hour of the impression to minimize time-dependent deformation. However, extended-pour alginate with high volumetric stability can be scanned using CBCT to produce a digital model.89 Although it is generally recommended to perform the CBCT scan immediately after impression taking, it can be delayed up to 2 or 3 hours when a high-stability impression material is used.9
This study performed CBCT scans at a resolution of 0.1 mm, which improved the accuracy of the digital models relative to those obtained by scanning at resolutions of >0.15 mm to 0.3 mm, as performed in previous studies.81718 Nevertheless, the differences in tooth width measurements found in this study are comparable to those from previous studies. This is because distances are measured on 2-dimensional images even if those images are derived from a 3D model; therefore, deciding on the measurement point, reference axis, and/or teeth inclination is more complicated.3 Meanwhile, the accuracy of the 3D models, assessed using the superimposition method, improved to 53 µm because the program optimally superimposed the 2 digital models, and the measurement points were configured automatically using the nearest-neighbor algorithm.
The highest available resolution of CBCT is 100 µm, which enables only a precise examination of 2 or 3 teeth within a 5 cm×5 cm of field-of-view (FOV); however, CBCT scan data of the entire arch model could not be obtained using this scanning mode. In the object scanning mode used in the present study, the FOV was enlarged to 5 cm×8 cm to capture the dental model or the entire body of the impression, while maintaining a resolution of 100 µm. Nevertheless, the surfaces of the CBCT scan models had an irregular texture compared with the surfaces of the cast scan models. This appears to have been due to the difference in resolution between CBCT (100 µm) and the model scanner (7 µm), and the smoothing algorithm in the software of the model scanner used to obtain a uniform surface after scanning an image. In addition, the quality of CBCT was diminished by the presence of noise, including scattering radiation, the beam-hardening effect, and artifacts generated during image processing. In this study, a conversion algorithm was applied with the expected maximization algorithm, marching cube algorithm, and smoothing algorithm, which were used to improve the transformation of CBCT impression data into 3D surface data in the STL format.19 However, revised algorithms for the software need to be developed in order to improve surface precision and smoothness in a way that achieves the accuracy of a model scanner.
Recent developments in industrial CBCT technology and improvements in STL conversion algorithms have supported the clinical use of digital models based on CBCT.1018 Therefore, applying CBCT technology for these purposes is advantageous because it does not require the purchase of an additional model scanner or intraoral scanner. In addition, CBCT scans are acquired using a volume scan method, instead of a surface scan method using a laser or LED source; therefore, CBCT scans are not affected by the angle of irradiation or the shape of the subject. CBCT can even be used in cases of crowding without managing raw scanned data.
An average of 22 minutes is required for plaster modeling, including pouring and trimming, after a conventional alginate impression.20 In this study, the digital models were acquired within 5 minutes after a rubber impression, with 14 seconds for the CBCT scan of the impression, 1 minute for CBCT file export, and 2 minutes for conversion to an STL file for each arch. In terms of efficiency, digital modeling using CBCT appears to be clinically feasible and is associated with a reduction in laboratory time.
In conclusion, no significant differences were found in most measurements between the cast scan models and CBCT digital models (the mesio-distal width difference was <0.15 mm). Furthermore, the average model superimposition difference was 53 µm, which was clinically acceptable. Therefore, CBCT may be suitable for use in clinical practice because of its advantages, including a reduced working time for digital model production.


 XML Download