

 PDF
PDF ePub
ePub Citation
 Print
Print


Introduction
The human gut microbiota plays an important role in nutrition and physiology, and is closely related to health and disease [12]. The gut microbial composition differs depending on age, geography, lifestyle, and health status [234]. The methods of analysing human gut microbiota have rapidly advanced as new technologies have been developed; in particular, next generation sequencing (NGS) plays a key role in improving our perspective on gut microbiota [5]. The characteristics of the gut microbiota in health and disease have been extensively studied, and their importance in intestinal diseases such as inflammatory bowel disease, as well as various systemic diseases such as diabetes, obesity, and cardiovascular disease, has been established [678].
Clostridioides difficile infection (CDI) is a major focus of research in the study of gut microbiota [9]. Despite the recent major increase in the incidence and severity of CDI, treatment with antibiotics such as metronidazole and oral vancomycin have remained the most effective strategy [10]. However, in recurrent CDI, antibiotic treatment is associated with a high recurrence rate [11]. Recently, van Nood et al. reported the first randomized controlled trial of faecal microbiota transplantation (FMT) in patients with recurrent CDI. FMT showed much better treatment outcomes than antibiotic treatment [12]. This indicated that CDI is associated with a collapse of the healthy gut microbiota, and that faecal material from a healthy donor can restore the gut microbiota of patients [13]. Currently, an important focus of research is the investigation of the nature of microbial changes in CDI patients, and is connected with the development of new treatment strategies that are more effective and convenient [14].
In Korea, the incidence of CDI is also increasing; FMT has been introduced to treat recurrent and refractory CDI [15]. However, there is a lack of research studying the gut microbiota of healthy people and patients with CDI in Korea. The characteristics of the gut microbiota differ in different countries; therefore, it is necessary to investigate the characteristics of the gut microbiome in Korean subjects. Several studies showed the characteristics of the gut microbiome in healthy Korean populations have significant differences from other countries [1617].
VRE and C. difficile are both major nosocomial pathogens and thus have similar risk factors including antibiotic exposure and hospitalization [18]. Previous studies showed the prevalence of VRE in CDI subjects is 10-20% [1920]. To better identify the specific characteristics of the gut microbiota of CDI, it is necessary to compare CDI group with other groups having antibiotics exposures and hospitalization such as subjects with VRE colonization.
The purpose of this study was to investigate the characteristics of gut microbiota in patients with CDI compared to patients with colitis other than CDI, patients with vancomycin-resistant enterococci (VRE) colonization, and healthy controls. We expect that the results of this investigation may lead to the establishment of novel diagnostic and treatment strategies in patients with CDI in Korea.
Materials and Methods
1. Study population and sample collection
This study was conducted at a 2,500 beds tertiary hospital of Korea. Stool samples were collected from hospitalized patients with CDI (CD+), hospitalized patients with loose stool negative for C. difficile (CD−), hospitalized patients with VRE colonisation, and healthy controls between December 2014 and March 2015. CD+ and VRE groups included only patients who were first diagnosed as CDI or VRE colonization. CDI was diagnosed in subjects with diarrhea (passage of three or more unformed or loose stools per day for more than 2 days) and who satisfied at least one of the following criteria: a toxin-producing C. difficile strain was successfully cultured, or a toxin gene of C. difficile was detected by PCR [2122]. It was confirmed that subjects in the CD+ and CD− groups did not have VRE colonisation within their stool samples. Likewise, subjects in the VRE group were confirmed to be without CDI. Subjects with both VRE and CDI were excluded. Healthy controls were recruited from individuals visiting the Severance Hospital for routine health check-ups who had no malignancy or gastrointestinal disease and no history of antibiotics or chemotherapy for 3 months prior to investigation. Healthy controls were confirmed to be without CDI or VRE colonisation. All of the participants were over 20 years old. The Institutional Review Board (IRB) of the Severance Hospital approved the study (IRB #4-2014-0792). The participants for this study provided informed signed consent. All methods in this study were performed in accordance with the Declaration of Helsinki.
2. Microbiological tests
Stool specimens were cultured to confirm the presence of toxigenic C. difficile. Before inoculation, each specimen was pre-treated using the alcohol-shock method, mixed with an equivalent volume of alcohol, and incubated for 30 min. Alcohol-shocked specimens were inoculated into C. difficile selective agar (BD Co., Franklin Lakes, NJ, USA) and incubated at 35°C for 48 h under anaerobic conditions. Colonies suspected of being C. difficile were identified using a VITEK 2 automated microbiology system (bioMérieux, Marcy l'Etoile, France). After isolating C. difficile, PCR was performed to determine the presence of C. difficile toxin genes (tcdA, tcdB, cdtA and cdtB) as previously described [2324]. The presence of the C. difficile toxin B gene in patient samples was examined by real-time PCR using the GeneXpert DX system (Cepheid, Sunnyvale, CA, USA).
The identification of enterococcal growth was performed using the VITEK 2 automated system (bioMérieux), and antibiotic susceptibility was determined using a VITEK 2 antibiotic susceptibility test card (bioMérieux).
3. DNA extraction
DNA extraction was performed using the QIAamp DNA mini kit (Qiagen, Hilden, Germany) according to the manufacturer's instructions. Stool samples stored at −70°C since the day of sample collection were used for DNA extraction. First, 500 μg (wet weight) stool sample was collected, 10 ml PBS was added, and the solution was vortexed vigorously until the stool sample was thoroughly homogenized. Then, the diluted sample was filtered through a cell strainer (Falcon, Corning Inc, Corning, NY, USA) and centrifuged at 1,300 rpm for 10 min. The sample was resuspended in AL buffer (Qiagen) and disrupted the bacterial cell walls by bead-beating according to the manufacturer's recommendations. The quantity and quality of DNA was confirmed by measuring the absorbance at 260 and 280 nm using a NanoDrop ND-1000 spectrophotometer (NanoDrop Technology, Rockland, DE, USA).
4. PCR amplification and pyrosequencing
PCR amplification was performed using primers targeting the V1 to V3 regions of the bacterial 16S rRNA gene. For bacterial amplification, barcoded primers of 9F (5′-CCTATCCCCTGTGTGCCTTGGCAGTC-TCAG-AC-AGAGTTTGATCMTGGCTCAG-3′; underlined sequence indicates the target region primer) and 541R (5′-CCATCTCATCCCTGCGTGTCTCCGAC-TCAG-X-AC-ATTACCGCGGCTGCTGG-3′; ‘X’ indicates the unique barcode for each subject). Amplification was carried out under the following conditions: initial denaturation at 95°C for 5 min, followed by 30 cycles of 95°C for 30 s, 55°C for 30s, and 72°C for 30s, with a final elongation at 72°C for 5 min. The PCR product was confirmed by 2% agarose gel electrophoresis and visualized under a Gel Doc system (BioRad Laboratories, Hercules, CA, USA). The amplified products were purified with the QIAquick PCR purification kit (Qiagen). Equal concentrations of purified products were pooled, and short fragments (non-target products) were removed with the Ampure beads kit (Agencourt Bioscience, Beverley, MA, USA). The quality and size of the products was assessed on a Bioanalyzer 2100 (Agilent Technologies, Santa Clara, CA, USA) using a DNA 7500 chip. Mixed amplicons were analysed by emulsion PCR, and then deposited on Picotiter plates. Sequencing was carried out using the GS Junior Sequencing system (Roche Diagnostics, Basel, Switzerland) according to the manufacturer's instructions.
5. Pyrosequencing data analysis
Basic analysis was conducted as described previously [252627]. The obtained reads from the different samples were sorted based on the unique barcodes of each PCR product. The sequences of the barcode, linker, and primers were removed from the original sequencing reads. Any reads containing two or more ambiguous nucleotides, low-quality reads (average score < 25), or reads shorter than 300 bp, were discarded. Potential chimeric sequences were detected using the Bellerophon method, which compares the BLASTN search results between forward half and reverse half sequences [28]. After removing chimeric sequences, the taxonomic classification of each read was assigned against the EzTaxon-e database (http://eztaxon-e.ezbiocloud.net) [29], which contains the 16S rRNA gene sequences of type strains with valid published names and representative species level phylotypes of either cultured or uncultured entries in the GenBank database with complete hierarchical taxonomic classification from the phylum to the species level. The richness and diversity of samples were determined by Chao1 estimation and Shannon diversity index at the 3% distance. Random subsampling was conducted to equalize the read size of samples to compare different read sizes among samples. The overall phylogenetic distance between communities was estimated using Fast UniFrac [30] and visualized using PCoA. To compare operational taxonomic units (OTUs) between samples, shared OTUs were obtained by XOR analysis in the CLcommunity software (Chunlab Inc., Seoul, Korea).
6. Statistical Analysis
Statistical tests were performed using SPSS version 19 (SPSS Inc., Chicago, IL, USA) and CLcommunity (ChunLab Inc.). Data are shown as the mean ± standard deviation (SD). The statistical significance of continuous variables was assessed using Student's t-test or the Mann-Whitney U test between two groups. One-way analysis of variance (ANOVA) and the Kruskal-Wallis test were used to evaluate the differences between more than two groups. A value of P <0.05 was considered statistically significant.
Results
1. Characteristics of study subjects
We collected stool samples from hospitalized patients with CD+, hospitalized patients with CD−, hospitalized patients with VRE colonization, and healthy controls. A total of sixty-six stool samples were collected from twenty-four patients with CD+, eighteen patients with CD−, eleven patients with VRE colonization, and thirteen healthy controls. The baseline characteristics of each group are shown in Table 1. The mean age was 59.6 years and there were 35 male patients (53.0%). The Charlson comorbidity index was the lowest in the healthy controls (CD+: 4.2; CD−: 2.1; VRE: 4.1; Healthy: 0.5). The rate of hospitalization in the 3 months prior to the investigation was 79.2% in CD+, 44.4% in CD−, 90.9% in VRE, and 0% in healthy controls. The mean white blood cell count was highest in the CD+ group (CD+: 11232.6 (/μL); CD−: 7680.6; VRE: 7147.3; Healthy: 5701.5) and the mean albumin was the lowest in the CD+ group (CD+: 3.0 (g/dL); CD−: 3.1; VRE: 3.6; Healthy: 4.2). The clinical symptoms of the patients are also shown in Table 1.
Table 1
Demographic and clinical characteristics of subjects
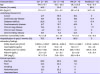
CD, Clostridioides difficile; VRE, vancomycin-resistant enterococci, BMI, body mass index, CRP, C-reactive protein.
![]()
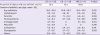
The proportion of patients who had used antibiotics in the 3 months prior to this study was 95.2% in CD+, 83.3% in CD−, and 100% in VRE (Table 2). The total duration of antibiotic use was the longest in VRE patients (CD+: 26.2 (days); CD−: 20.9; VRE: 45.2). The duration of treatment with each antibiotic class is also shown in Table 2.
Table 2
History of antibiotic use in subjects within 3 months before the start of experiments
![]()
2. Species richness and diversity of intestinal microbiota
The alpha diversity of the bacteria in the analysed samples is shown in Table 3 and Fig. 1. The species richness, as estimated by the Chao1 index, was significantly lower in the CD+ group compared to that in the healthy control (P <0.001), but did not differ significantly between the CD+ group and any other group. Microbial diversity, as calculated by the Shannon index, was significantly lower in the CD+ group compared to that in the healthy control group (P = 0.001), but did not differ significantly between the CD+ group and any other group.
Table 3
Alpha diversity and relative abundance within each group at the phylum and genus level
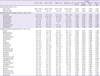
aOverall P value shows P values calculated by one-way analysis of variance (ANOVA) or Kruskal-Wallis test to evaluate the differences between CD+, CD−, VRE, and healthy groups.
CD, Clostridioides difficile; VRE, vancomycin-resistant enterococci.
![]()
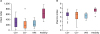 | Figure 1Alpha diversity of analysed bacterial samples. (A) Chao1 index to determine species richness. (B) Shannon index to determine microbial diversity.CD+, hospitalized patients with Clostridioides difficile infection; CD−, hospitalized patients with colitis not due to C. difficile; VRE, hospitalized patients with vancomycin-resistant enterococci colonisation.
|
Principal coordinate analysis (PCoA) was used to evaluate the beta diversity within each group (Fig. 2). Healthy controls were clustered separately from the CD+, CD−, and VRE group, while the CD+, CD−, and VRE groups could not be separated.
 | Figure 2Principal coordinate analysis (PCoA) was used to evaluate the beta diversity of each group of bacteria.CD+, hospitalized patients with Clostridioides difficile infection; CD−, hospitalized patients with colitis not due to C. difficile; VRE, hospitalized patients with vancomycin-resistant enterococci colonisation.
|
3. Relative abundance of intestinal microbes
A comparison of the mean relative abundance of each major phylum is shown in Table 3. Phylum Firmicutes was predominant in all groups. In the healthy group, Actinobacteria was the second-most abundant. The abundance of Actinobacteria was significantly lower in the CD+ group (P = 0.001) compared to that in healthy control, but there was no difference in its abundance between the CD+ group and any other group. Proteobacteria was the second-most predominant phylum in the CD+, CD−, and VRE groups. The proportion of Proteobacteria was slightly higher in the CD+, CD−, and VRE groups than in healthy controls, but not significantly (12.8% in CD+; 23.6% in CD−; 17.5% in VRE; 3.5% in healthy control). Compared to that in the VRE group, the proportion of Bacteroidetes was higher in the CD+ and CD− groups, but not significantly (7.1% in CD+; 5.9% in CD−; 2.7% in VRE; 4.3% in healthy control, P = 0.673). Verrucomicrobia was detected at a proportion of 2.5% in the CD+ group, but was below the detection threshold in the CD−, VRE, and healthy groups.
At the genus level, genera with a mean relative abundance of >1.0% (based on healthy controls) were analysed, as described in Table 3. Compared to those in the healthy group, the CD+ group showed significantly lower proportions of Blautia, Bifidobacterium, Faecalibacterium, Anaerostipes, Dorea, Collinsella, Eubacterium_g5, Fusicatenibacter, Prevotella, Roseburia, Subdoligranulum, GQ871709_g, Catenibacterium, Clostridium, Ruminococcus_g2, Dialister, and Ruminococcus_g5. However, the proportions of Streptococcus, Escherichia, and Bacteroides in the CD+ group were higher than those in the healthy control, but not significantly. Compared to those in the CD− group, subjects in the CD+ group showed no significant difference in the abundance of any bacteria at the genus level. Compared to those in the VRE group, subjects in the CD+ group showed a significantly higher proportion of Anaerostipes.
Discussion
This study evaluated the characteristics of faecal microbiota in patients with C. difficile-associated diarrhea. It is well known that the disruption of the gut microbiota is a major cause of CDI, and previous studies have consistently shown that a reduction in the diversity and abundance of faecal microbiota is a common phenomenon in CDI patients [313233]. Exposure to antibiotics is a major cause of gut microbiota disruption and CDI. Antibiotic use also promotes and maintains a high density of enterococci, including VRE [3435]. To better characterize changes in the gut microbiota due to CDI, we included VRE-colonised subjects in addition to healthy controls and subjects with CD− loose stool. Although CDI subjects showed a lower bacterial richness and diversity than the healthy controls, the species richness and diversity of intestinal microbiota was not significantly different in the CD+, CD−, and VRE groups. Patients in these groups had similar levels of antibiotic exposure, and antibiotic exposure itself is known to decrease bacterial richness and diversity, regardless of CD toxin positivity or VRE colonisation. In our comparison of the composition of bacterial phyla and genera between groups, there was also no observable difference in composition between the CD+, CD−, and VRE groups. Taken together, this study could not find any differences in the microbiota between CD+, CD−, and VRE patients with similar histories of antibiotic exposure.
FMT has become an effective treatment for recurrent CDI [1236]. Recently, FMT has been attempted to eliminate intestinal colonisation by multi-drug resistant organisms (MDRO) such as extended spectrum β-lactamase (ESBL)-producing and carbapenemase-producing Enterobacteriaceae (CPE), VRE, and methicillin-resistant Staphylococcus aureus (MRSA) [373839]. These attempts have shown considerable successes, and FMT has emerged as a promising therapy for intestinal MDRO decolonisation. The identification of any key microbiome components associated with CDI or VRE would allow researchers to apply this microbiome factor to develop more specific probiotics to treat dysbiosis. Although we could not find any specific phyla to differentiate between CDI and VRE colonisation, the proportion of Verrucomicrobia was slightly higher in the CD+ group, and Synergistetes was detected only in the CD+ group, but not in the VRE group. At the genus level, the CD+ group showed a significantly higher proportion of Anaerostipes compared to that in the VRE group.
Consistent with previous studies, decreased diversity and richness were characteristic of the microbiota in CDI patients compared to those in healthy controls [33]. However, the microbial composition at the phylum and genus levels for CDI patients was not fully consistent with previous results. A recent study in Korea compared the composition of the gut microbiota in patients with toxigenic CDI and healthy controls [33]. They showed that the proportion of Proteobacteria was significantly higher in CDI than in healthy controls at the phylum level, and several genera, such as Phascolarctobacterium, Lachnospira, Butyricimonas, Catenibacterium, Paraprevotella, Odoribacter, and Anaerostipes, were not detected in most CDI patients. Decreased Bacteroidetes and increased Proteobacteria in CDI have been observed in previous studies [3240]. In our study, the proportion of Proteobacteria was insignificantly higher in CD+ patients than in healthy controls, and the proportion of Actinobacteria was significantly lower in the CD+ group compared to that in healthy controls. The proportion of Bacteroidetes was not significantly different between CD+ group and healthy control. Bacteroidetes was the third-most predominant phylum in our study, but was the second-most predominant phylum in CDI samples in the previous study. The identified intestinal microbiome characteristics of Koreans with CDI compared to other patients with antibiotic exposure and healthy control might help to develop microbiome based diagnostic and treatment modalities.
This study had several limitations. First, the small number of subjects was a major limitation in this study. Second, we could not control the effects of sample storage and interval between sample collection and DNA extraction on the analysis of microbiome. Third, we could not adjust confounding factors such as antibiotic use, hospital days, comorbidities, etc. which may affect the microbiota of subjects. Fourth, we could not compare the characteristics of microbiota according to the type of C. difficile toxin and the genotype of VRE. Furthermore, we could not evaluate paired samples to compare microbiome characteristics before and after CDI. The diet of the subjects may also have affected the characteristics of the microbiome, but we could not collect data to investigate this.
 XML Download