

 PDF
PDF ePub
ePub Citation
 Print
Print


INTRODUCTION
Autoantibodies to extractable nuclear antigens (ENAs) are important diagnostic markers for autoimmune diseases, such as systemic lupus erythematosus (SLE), Sjögren's syndrome (SjS), and systemic sclerosis (SSc).123 These anti-ENAs exhibit strong clinical associations with several systemic autoimmune rheumatoid diseases (SARDs). Anti-Sm is considered to be a highly specific marker for SLE, anti-Scl-70 for SSc, and anti-RNP for SLE, SSc, and mixed connective tissue disease (MCTD).45 Therefore, accurate detection of anti-ENAs plays a key role in the differential diagnosis of SARDs.
Several methods are available for the detection of anti-ENAs; however, no gold standard has been established due to the following reasons: 1) variations in substrates and fixatives, 2) differences in methods and quantitation of results, and 3) difficulty of establishing reference ranges.6 Over the years, gel-based immunoprecipitation techniques and ELISA have been widely used for the detection of anti-ENAs.78 ELISA assays are highly sensitive in measurements of the levels of antigens or antibodies in various clinical samples, and it is one of the most commonly used diagnostic test in clinical and research laboratories.91011 Despite the advantages of ELISA assay, it is limited by laborious and long protocols. Several new methods with accurate results and simplified laboratory procedures have been evaluated in various institutions to substitute conventional testing methods for the detection of anti-ENAs.1213
Herein, we studied the overall performance of the automated fluorescent enzyme immunoassay (FEIA) technique for the detection of anti-ENAs and diagnosis of SARDs and compared the results with those of microplate ELISA.
Go to : 
MATERIALS AND METHODS
Serum samples
In this study, we collected non-duplicated and non-selected sera from 100 patients who underwent anti-ENA testing at one university hospital from December 2011 to January 2012. The appropriate sample size with which to evaluate the performance of the diagnostic tools was determined based on a previous report.14 Of the 100 patients, 60 patients were diagnosed with well-defined SARDs [25 SLE, 24 SjS, 5 rheumatoid arthritis (RA), 4 MCTD, and 2 SSc]; 17 were diagnosed with non-SARD autoimmune disease, such as Raynaud disease, autoimmune carpal tunnel syndrome, or autoimmune disease with no criteria met for an exact diagnosis; 22 suffered from non-autoimmune diseases, such as osteoarthritis, allergic rhinitis, and hypertensive heart disease; and 1 patient's diagnosis was not available. The diagnosis of each patient with autoimmune disease was determined by expert rheumatologists. We received ethical approval of this study from the Institutional Review Board of Severance Hospital (IRB No. 1-2019-0013).
Autoantibody profiling methods
We detected the most commonly measured ENA specificities, such as anti-SS-A/Ro, anti-SS-B/La, anti-RNP, anti-Sm, and anti-Scl-70. Table 1 lists the nature of the antigens in the two tests that were evaluated.
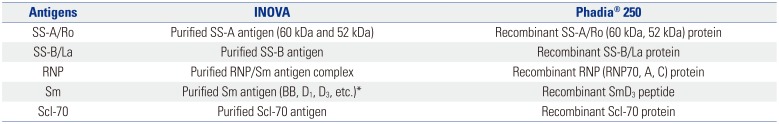
Table 1
The Composition of Antigens in INOVA and Phadia® 250
![]()
Microplate ELISA
Microplate ELISA for detecting five different anti-ENAs were conducted using QUANTA Lite™ ELISA kits (INOVA Diagnostics, San Diego, CA, USA). Laboratory procedures were performed by expert technicians according to the manufacturer's instructions, and manual sample preparation and manual distribution on the microplate initiated the wet process. After the procedure, the optical density (OD) of each reaction was measured by an ELISA reader, and the levels of autoantibodies were calculated using the values of OD from the patients' sera and positive controls. According to the manufacturer's instructions, the results were reported in three categories: negative, weak positive, and positive. Semi-quantitative results of less than 20 units were classified as negative, 20–39 units as weak positive, and more than 40 units as positive. For statistical analyses, weak-positive results were considered positive results.
Automated FEIA
As previously described in the literature, the Phadia® 250 assay (Phadia, Uppsala, Sweden) utilizes polystyrene EliA™ wells precoated with targeted antigens (SS-A/Ro protein, SS-B/La protein, RNP protein, SmD3 peptide, and Scl-70 protein, respectively).15 The fluorescence emitted from the conjugate of the autoantibody was detected by a built-in fluorometer, and the estimated value was expressed in EliA U/mL. The results were classified in three categories: negative, equivocal, and positive. According to the cutoff values provided by the manufacturer, results less than 7 EliA U/mL were classified as negative, 7–10 EliA U/mL as equivocal, and more than 10 EliA U/mL as positive. For statistical analyses, equivocal results were considered positive results.
Statistical analyses
The statistical tests in this study were conducted using Analyse-it® 3.90.4 (Analyse-it Software, Ltd., Leeds, UK) and R 3.5.3 (R Foundation for Statistical Computing, Vienna, Austria). Agreement between qualitative results from the two assays was assessed using kappa coefficients. Recommended interpretations of kappa values were as follows: poor agreement, 0.01–0.20; fair agreement, 0.21–0.40; moderate agreement, 0.41–0.60; substantial agreement, 0.61–0.80; and almost perfect agreement, 0.81–0.99.16 Degrees of association between quantitative values from the two tests were assessed using Spearman's correlation coefficients. A p value less than 0.05 was considered statistically significant. Sensitivity and specificity for each test were determined with two-by-two contingency tables. To define true positive, true negative, false positive, and false negative, a true event was defined as diagnosis of the patient with correlated disease. The sensitivities and specificities for the two methods were compared by estimation of confidence intervals for differences in paired sensitivities and paired specificities.1718 If the confidence limits for the differences in sensitivities or specificities did not include zero, there was evidence that the sensitivities or specificities were statistically different.18 As the clinical data of one patient was not available, analyses of diagnostic sensitivities and specificities were conducted with results from 99 patients.
Go to :
RESULTS
Patients
The demographic data for the 99 patients are detailed in Table 2. Fifty-eight SARD patients were female (58/60, 96.7%), and 29 non-SARD patients were female (29/39, 74.4%). The average age of the SARD patients was 37.0 years, with a standard deviation (SD) of 17.3, and in non-SARD patients, the average age was 47.5 years, with a SD of 17.8. Sixty SARD patients comprised five different clinical diagnoses: SLE (n=25), SjS (n=24), RA (n=5), MCTD (n=4), and SSc (n=2). Non-SARD patients were subdivided into a non-SARD autoimmune disease group (n=17) or non-autoimmune disease group (n=22).
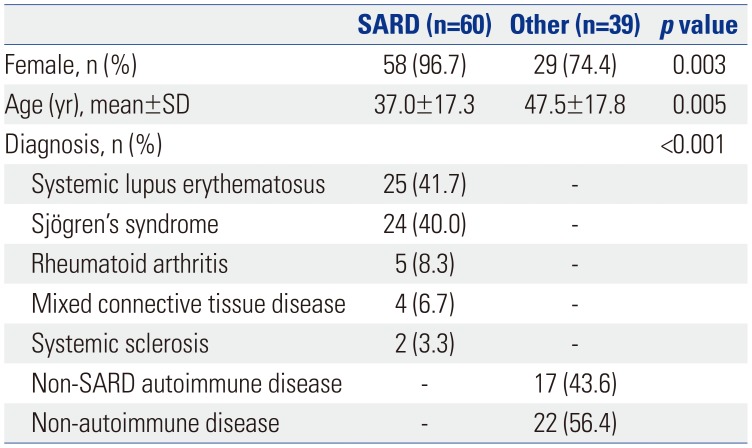
Table 2
Demographic Data of the 99 Patients
![]()
Agreement between Phadia® 250 and microplate ELISA
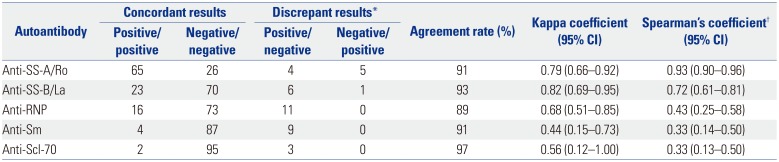
Overall agreement values between Phadia® 250 and ELISA assay are listed in Table 3. Based on values of concordant and discrepant results, the agreement rates between ELISA and Phadia® 250 ranged from 89% for anti-RNP to 97% for anti-Scl-70. The estimated kappa coefficients for agreement between the results by the two assays had a minimum value of 0.44 for anti-Sm and a maximum value of 0.82 for anti-SS-B/La. In detection of anti-Scl-70 and anti-Sm, the two methods showed moderate agreement with kappa coefficients of 0.56 and 0.44, respectively. For anti-SS-A/Ro and anti-RNP, the two methods demonstrated substantial agreement. Correlation of signal to cut-off ratios was analyzed with Spearman's rank correlation coefficients to document the degree of association between the two tests (Fig. 1). Spearman's coefficients between the results by the two methods were 0.93 for anti-SS-A/Ro, 0.72 for anti-SS-B/La, 0.43 for anti-RNP, 0.33 for anti-Sm, and 0.33 for anti-Scl-70.
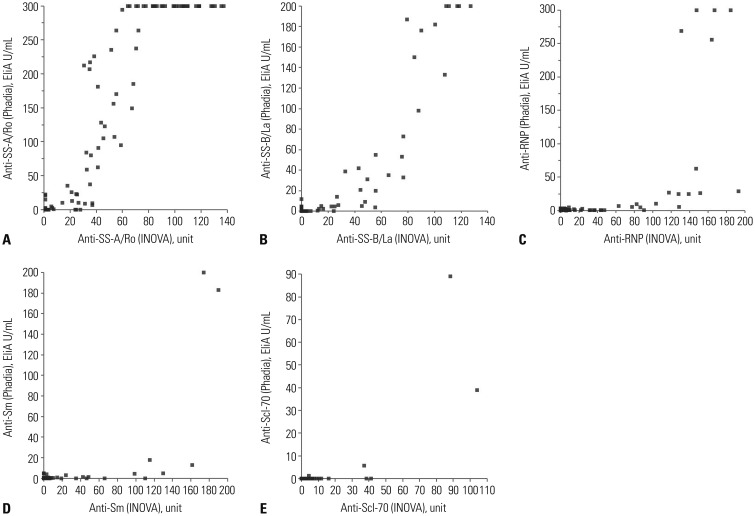 | Fig. 1Spearman's correlation plots of results from INOVA and Phadia® 250 for the five anti-ENAs. (A) anti-SS-A/Ro, (B) anti-SS-B/La, (C) anti-RNP, (D) anti-Sm, and (E) anti-Scl-70. ENAs, extractable nuclear antigens.
|
Table 3
Comparison of the Results for Antibodies to Extractable Nuclear Antigens in INOVA and Phadia® 250 for a Total of 100 Serum Samples
CI, confidence interval.
*Shown as “no. of respective results by ELISA/Phadia® 250.” Weak positive samples (20–39 units) by ELISA and equivocal samples (7–10 EliA U/mL) by Phadia® 250 were included as positive results, †Spearman's rank correlation analysis was performed with signal to cut-off ratio values of the results by ELISA and Phadia® 250, p values were <0.0001 for all autoantibodies.
![]()
Diagnostic performance of the two assays
The sensitivities and specificities of ELISA and Phadia® 250 in the detection of each anti-ENA antibody are shown in Table 4. As stated in the Materials and Methods section and Table 4, a true event in the evaluation of the diagnostic sensitivity and specificity of anti-SS-A/Ro was a diagnosis with SLE or SjS (total n=49). The rest of the diagnostic accuracy criteria for each autoantibody are detailed in the Table 4. According to the Clinical and Laboratory Standards Institute guideline EP12-A, we used 95% confidence intervals to determine statistically different differences.18 In general, in the provided clinical context in Table 4, more false positive cases were observed with the ELISA assay. Phadia® 250 showed higher sensitivity and specificity for the detection of anti-SS-A/Ro and anti Scl-70, although the difference was not statistically significant. Overall, there were no significant differences between the two assays, except for the specificity of anti-RNP and sensitivity of anti-Sm.
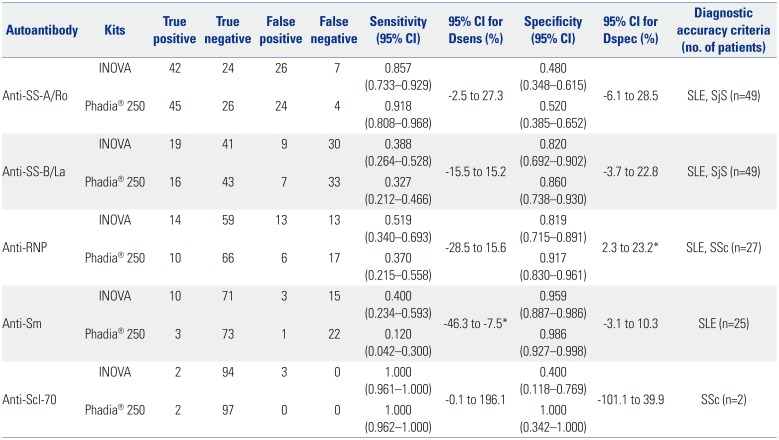
Table 4
Comparison of Sensitivity and Specificity of Anti-ENA in a Clinical Context with a Total of 99 Serum Samples
ENAs, extractable nuclear antigens; CI, confidence interval; Dsens, difference between paired sensitivities; Dspec, difference between paired specificities; SjS, Sjögren's syndrome; SLE, systemic lupus erythematosus; SSc, systemic sclerosis.
*Values show statistical data with significant differences.
![]()
Go to :
DISCUSSION
In this study, we attempted to compare the overall performance of two laboratory platforms for the detection of anti-ENAs. Automated Phadia® 250 for the detection of anti-ENAs showed comparable performance with conventional microplate ELISA in that the two methods showed overall good analytical agreement and that the diagnostic performance showed no statistically significant differences, except for anti-RNP and anti-Sm. Although there are no evaluation reports comparing the exact same methods of FEIA and ELISA in detecting anti-ENAs, our results are in line with a recent study comparing FEIA methods with enzyme immunoassays (EIA) and with a study comparing multiplexed flow immunoassay with conventional ELISA assay.1213 In the previous study comparing EIA-based assay with FEIA, the two showed good agreement (kappa coefficient=0.70), and regarding clinical implications, the two showed comparable results.12 In a study comparing FEIA with conventional indirect immunofluorescence assay, the percent agreement between the two assays was 79.2%, and FEIA showed higher sensitivity.19 In this context, where newly developed methods show comparable or even better performance than conventional immunoassays, practical consideration of the testing platform based on the simplicity of the procedure, turnaround time, etc. could help to decide which platform to use in the laboratory.
The clinical sensitivities of anti-Sm with Phadia® and ELISA were 0.120 and 0.400, which was a significant difference. Anti-Sm has high diagnostic specificity in SLE patients, and clinical sensitivity has less correlation with establishing the diagnosis.5 Even so, clinical correlation with diagnostic symptoms in patients prevents misdiagnosis with false negative results. The discrepant results in detecting anti-RNP (Table 3) could raise a question of misdiagnosis when using Phadia® 250. Out of 11 discordant cases in the detection of anti-RNP, the diagnoses and semi-quantitative antibody titers, described as positive or weak positive, varied among the cases: SLE (weak positive, n=2; positive, n=2), SjS (weak positive, n=2; positive, n=2), MCTD (weak positive, n=1), and non-systemic autoimmune disease (weak positive, n=1; positive, n=1). As anti-RNP is a diagnostic marker for SLE and SSc and since a high level of anti-RNP is diagnostic of MCTD, this result could suggest the possibility of false positive cases according to clinical diagnoses, leading to misdiagnosis using the ELISA method.5 The problem of false-positive anti-ENA tests has been continuously raised, and it is recommended that testing be performed with two different methods to avoid false-positive results.2021 Clinical correlation with anti-ENA results can be another solution for avoiding false-positive results.
Our study is limited by the small number of patients with SARD and by the absence of normal healthy controls. Also, due to the high number of negative results for anti-Sm and anti-Scl-70 (Table 3), we cannot accurately determine the degree of association between the two methods in detecting these two antibodies. Well-designed studies with a larger pool of patients would be helpful to determining the true diagnostic performances of the two methods.
In this study, we evaluated and compared the analytical performances of the automated FEIA platform Phadia® 250 and microplate ELISA (INOVA Diagnostics) for the detection of the five most commonly used anti-ENAs. Phadia® 250 showed comparable performance with conventional microplate ELISA. Since the selection of an assay for use in a clinical laboratory depends on several factors, such as protocol time, turnaround time, and simplicity of use by laboratory technicians, as well as the accuracy of test results, we believe that Phadia® 250 could be a useful and efficient method, as it shows comparable efficacy and good agreement with previous methods, along with a shorter protocol time, a shorter turnaround time, and better ease of use than microplate ELISA.
Go to :
 XML Download