

 PDF
PDF ePub
ePub Citation
 Print
Print


INTRODUCTION
The use of transcatheter aortic valve replacement (TAVR) in patients with severe aortic stenosis (AS) who are ineligible for or are at high risk for surgical aortic valve replacement (sAVR) has increased exponentially since it was first introduced in 2002.1 To date, TAVR has been reported to result in a prompt decrease in left ventricular (LV) afterload2 without the disturbing effects of major surgery and clinical improvement in severe symptomatic AS.345 Notwithstanding, although the impact of sAVR or TAVR on LV function has been studied using various imaging modalities, the effects of TAVR on diastolic function remain controversial,2678 and data are limited on the effect of TAVR on serial changes in LV diastolic function during follow-up immediate and early after the procedure. This study aimed to assess and compare the effects of TAVR and sAVR on recovery of LV diastolic function in patients with symptomatic severe AS through serial echocardiographic examinations prior to, immediately after, and 3 months after the procedures.
MATERIALS AND METHODS
Study population
We consecutively enrolled 38 patients with symptomatic severe AS who underwent transfemoral TAVR between 2011 and 2013 at our institute (TAVR group). We also enrolled 27 patients who were older than 75 years and underwent sAVR during the same period. The TAVR group consisted of patients treated with TAVR if their aortic valve area was <1 cm2, their European System for Cardiac Operative Risk Evaluation score (EuroSCORE) was >20%, or their EuroSCORE was ≤20% and the following criteria were met: contraindicated for surgery, severely reduced pulmonary function (defined as forced expiratory volume in 1 second <1 L), liver cirrhosis (Child A or B), and severe pulmonary hypertension (pulmonary systolic pressure > 60 mm Hg). Exclusion criteria included: known contraindications to antiplatelet agents or anticoagulant therapy, allergic reaction to nitinol or contrast media that could not be premedicated, any sepsis, history of AVR, any condition considered a contraindication to extracorporeal assistance, symptomatic carotid or vertebral artery disease (>70% stenosis), abdominal aortic aneurysm, bleeding diathesis or coagulopathy, creatinine clearance <20 mL/min, and life expectancy <1 year. Patients with significant coronary artery disease were completely revascularized by percutaneous coronary intervention before TAVR.
All 38 patients in the TAVR group and 27 patients in the sAVR group exhibited New York Heart Association (NYHA) functional class ≥II symptoms, and their echocardiographic findings were consistent with severe AS (aortic valve area <1 cm2 with or without a transvalvular mean pressure gradient ≥40 mm Hg).9 The decision for TAVR or sAVR was made for each patient based on clinical symptom severity combined with comorbid disease, physical performance status, and echocardiography parameters. The patients were selected for TAVR after they were considered inoperable or at high risk as assessed by a multispecialty team.
TAVR was executed with fluoroscopy and transesophageal echocardiography guidance under general anesthesia using standard techniques.10 Pre-procedural echocardiography and multi-slice computed tomography were used to measure aortic annulus size. Immediately after prosthetic valve deployment, transesophageal echocardiography was performed to confirm good motion of the prosthetic valve and identify any paravalvular leakage.
Echocardiographic and doppler measurements
All patients were investigated using two-dimensional transthoracic echocardiography (TTE) before the procedure (TAVR or sAVR), immediately after the procedure, and 3 months after the procedure. In the TAVR group, TTE follow-up was performed 1 day after the procedure. The short-term effects of sAVR were evaluated using echocardiography 5–7 days after the procedure.
Standard two-dimensional pulsed-wave Doppler and pulsed-wave Doppler tissue imaging (DTI) echocardiographic parameters were collected from parasternal and apical acoustic windows based on American Society of Echocardiography (ASE) guidelines11 using an IE33 (Phillips, Andover, MA, USA) or vivid E9 (Vinmed; General Electric, Milwaukee, WI, USA). All patients were investigated in the left lateral supine position under electrocardiographic monitoring.
M-mode tracing obtained just below the mitral valve leaflets was acquired in the parasternal short-axis view. We measured LV end-diastolic (LVED) and end-systolic (LVES) dimensions, such as interventricular septal wall thickness, posterior wall thickness, and LVED and LVES diameters.12 LVED and LVES volumes were acquired from apical two- and four-chamber views using the biplane modified Simpson's rule, while LV ejection fraction (EF) was calculated according to ASE recommendations.12 LA volume indices (LAVI) were also measured using the biplane Simpson's method. LV mass was calculated using the Devereux formula and indexed to body surface area calculated using the Mosteller formula. Relative wall thickness (RWT) was calculated as 2×LV diastolic posterior wall thickness/LVED diameter and was regarded as abnormal when >0.42. Relative wall thickness and LV mass index (LVMI) were applied to evaluate LV geometry.
Continuous-wave Doppler examinations were evaluated for peak instantaneous velocity. The mean and maximum aortic valve pressure gradients were assessed for all patients using the modified Bernoulli equation with flow velocity-time integrals over the ejection period in continuous-wave Doppler recordings with a 100 mm/s time scale. Aortic valve area was calculated using the continuity equation following ASE recommendations.13 Aortic and mitral regurgitation were evaluated based on ASE recommendations.14
LV filling variables were achieved from pulsed-wave Doppler recordings of transmitral flow velocity. The sample volume was allocated at the tips of the mitral valve leaflets. Doppler velocity recordings of three cardiac cycles at a paper speed of 100 mm/s were digitized, and the variables were averaged. LV diastolic function was evaluated using pulsed-wave Doppler and pulsed-wave DTI recordings based on ASE/European Association of Cardiovascular Imaging recommendations.15 Transmitral flow was attained to gather peak early (E) and atrial (A) flow velocities. We used the mean peak early diastolic (e′) velocity obtained from the septal side of the mitral annulus in the four-chamber view with appropriate DTI settings. Systolic (s′) and late diastolic velocity (a′) and isovolumic relaxation time were computed utilizing pulsed-wave DTI at the septal insertion sites of the mitral leaflets in the apical four-chamber view. The E wave to e′ ratio (E/e′) was calculated to determine LV filling pressures. Tricuspid regurgitation pressure gradient was measured on color-flow Doppler imaging using parasternal RV inflow view.
Accordingly, diastolic function was determined based on the 2016 recommendations.15 Diastolic function was then classified into grade I, grade II, grade III, and indeterminate/normal grade considering early-late ventricular filling velocities (E/A) ratio, E/e′ ratio, tricuspid regurgitation velocity, and LAVI. In patients with indeterminate grade diastolic dysfunction and depressed LV ejection fraction (LVEF), the systolic/diastolic pulmonary venous flow velocity ratio was utilized.
Arterial hemodynamics and global LV afterload
Systolic and diastolic blood pressure was estimated utilizing an arm-cuff sphygmomanometer at the time of the Doppler echocardiography examination. To assess the elastic properties of the ascending aorta, the systolic and diastolic aortic diameters were evaluated 1 cm above the sinotubular junction by two-dimensionally guided M-mode transthoracic echocardiography in the parasternal long-axis view.16 The ratio of stroke volume index to brachial pulse pressure (the difference between systolic and diastolic blood pressure) was utilized as an indirect measure of total systemic arterial compliance (SAC).17 Systemic vascular resistance (SVR) was determined by the following formula: (80×MAP)/CO, where MAP is the mean arterial pressure and CO is the cardiac output.17 To assess global LV afterload, valvuloarterial impedance (Zva) was computed as the sum of the systolic arterial pressure and the mean transvalvular pressure gradient divided by the stroke volume index.18
Statistical analysis
Continuous variables are expressed as means±standard deviations, while categorical variables are expressed as frequencies and percentages. Statistics were calculated using SPSS version 19.0 (IBM Corp., Armonk, NY, USA). Intergroup comparisons were undertaken utilizing a two-tailed Student's t test or Welch test and non-parametric methods depending on the data distribution. Categorical variables were compared utilizing Fisher's exact test. Since diastolic function grade was an ordinal variable, comparisons involving this variable utilized the exact Jonckheere-Terpstra test. We performed a repeated-measured analysis of variance to determine differences between groups and over time. p values <0.05 were considered statistically significant.
RESULTS
Baseline clinical characteristics and echocardiography findings
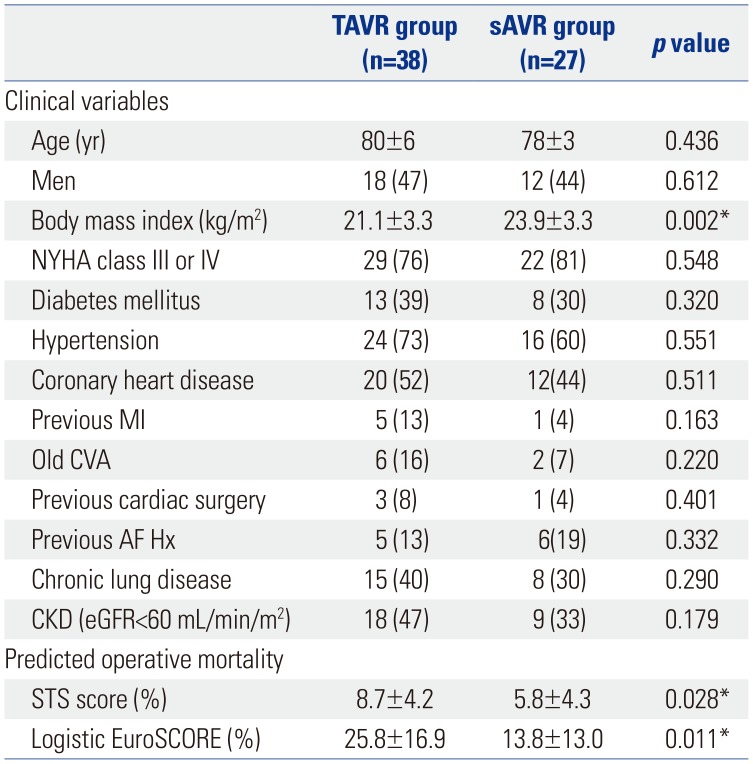
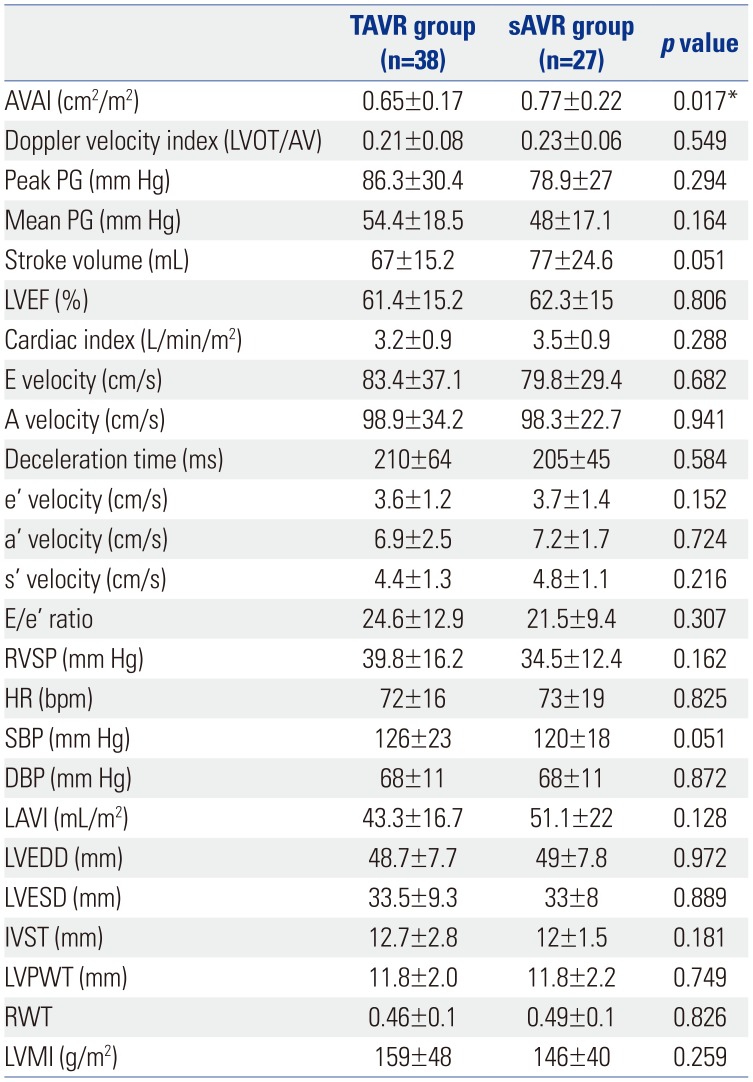
The baseline patient characteristics are presented in Table 1. We included 38 patients who underwent TAVR (TAVR group: mean age, 80±6 years, male:female=18:20) and 27 patients who were older than 75 years and underwent sAVR during the same period (sAVR group: mean age, 78±3 years, male:female=12:15). A CoreValve (Medtronic CoreValve Percutaneous System; Medtronic Inc., Minneapolis, MN, USA) was inserted in all patients in the TAVR group. As expected, the Society of Thoracic Surgeons risk score (8.7±4.2 vs. 5.8±4.3, p=0.028) and logistic EuroSCORE (25.8±16.9 vs. 13.8±13.0, p=0.011) in the TAVR group were higher than those in the sAVR group. Furthermore, patients in the TAVR group had a lower mean body mass index (TAVR, 21.1±3.3 vs. 23.9±3.3 kg/m2, p=0.002). There were trends toward more patients with chronic lung disease (40% vs. 30%, p=0.290) and chronic kidney disease (estimated glomerular filtration rate <60 mL/min/m2) in the TAVR group than in the sAVR group (47% vs. 33%, p=0.179) (Table 1). At baseline examination, the TAVR group consisted of 33 (87%) patients in sinus rhythm and 5 (13%) with atrial fibrillation (AF), whereas the sAVR group had 21 (79%) patients in sinus rhythm and 6 (21%) with AF. The baseline echocardiographic findings are presented in Table 2. No significant intergroup differences were found in chamber size, geometry, and function, except for lower aortic valve area index, in the TAVR group (0.65±0.17 vs. 0.77±0.22 cm2/m2, p=0.017).
In the sAVR group, all patients received a bioprosthesis (Carpentier Edwards Bioprosthesis in 13; Carpentier Edwards Perimount Magna Bioprosthesis in 2; and Saint Jude epic Bioprosthesis in 12). All surgical patients had a favorable postoperative state without any serious 30-day complications.
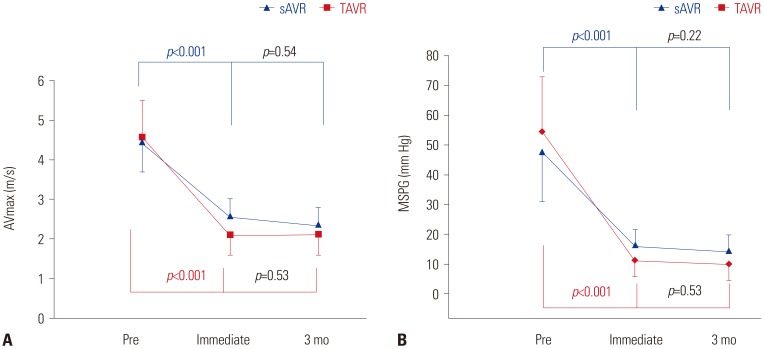
Hemodynamic improvement after TAVR and sAVR
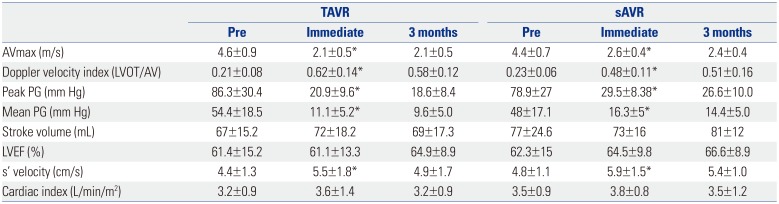
Early hemodynamic improvement was comparable between the groups: peak AV velocity (AVmax: TAVR, from 4.6±0.9 to 2.1±0.5 vs. sAVR, from 4.4±0.7 to 2.6±0.4 m/s, p<0.001) (Table 3, Fig. 1A) and mean systolic pressure gradient (MSPG: TAVR, from 54.4±18.5 to 11.1±5.2 vs. sAVR, from 48±17.1 to 16.3±5 mm Hg, p<0.001) (Table 3, Fig. 1B). Moreover, these improvements were maintained after 3 months without significant changes (Table 3, Fig. 1A). In addition, LVEF, SV, and cardiac index tended to increase in both groups over time after 3 months (LVEF: TAVR, from 61.4±15.2% to 64.9±8.9% vs. sAVR, from 62.3±15% to 66.6±8.9%; SV: TAVR, from 67±15.2 to 69± 17.3 vs. sAVR, from 77±24.6 to 81±12 mL; cardiac index: TAVR, from 3.2±0.9 to 3.2±0.9 vs. sAVR, from 3.5±0.9 to 3.5±1.2 L/min/m2, p=NS) (Table 3). In addition, we noted significant improvements in s′ velocity immediately after and 3 months after the procedure in both groups (TAVR, from 4.4± 1.3 to 5.5±1.8 vs. sAVR, from 4.8±1.1 to 5.9±1.5 cm/s, p=0.001) (Table 3).
Comparison of recovery of diastolic function after TAVR and sAVR during serial follow up
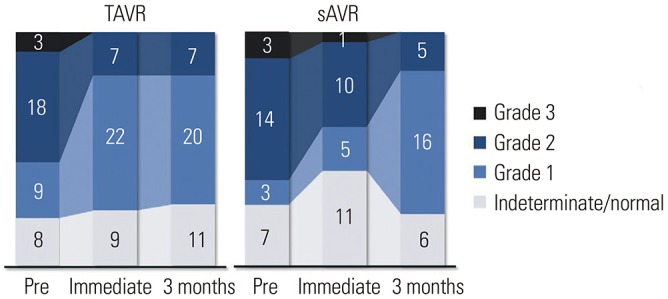
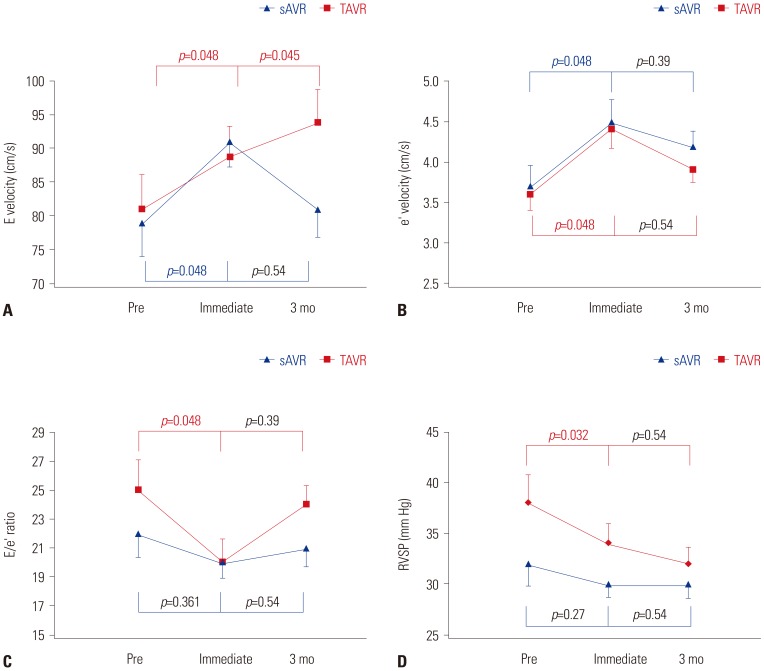
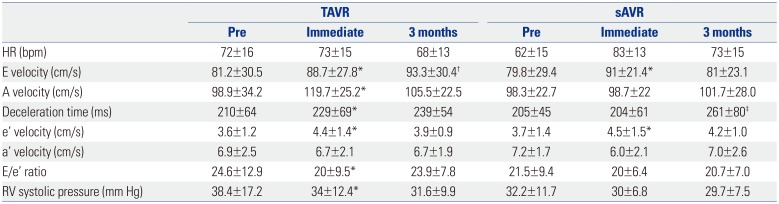
Immediately after AVR, 16 patients (42%) showed improvement in LV diastolic function grade in the TAVR group versus only 3 patients (11%) in the sAVR group. Early improvement in diastolic function grade was seen immediately after TAVR (p=0.018) (Fig. 2), but no further improvement was found after 3 months. However, a small improvement was found immediately after sAVR (p=0.04) (Fig. 2), although no further improvement was noted 3 months later (p=0.99) (Fig. 2). E velocity (from 81.2±30.5 to 88.7±27.8 vs. from 79.8±29.4 to 91±21.4 cm/s, p=0.048) and e′ velocity (from 3.6±1.2 to 4.4±1.4 vs. from 3.7±1.4 to 4.5±1.5 cm/s, p=0.048) (Table 4, Fig. 3A and B) were significantly increased in the TAVR group versus the sAVR group. Deceleration time (DT) increased significantly immediately after TAVR (from 210±64 to 229±69 ms, p=0.008) (Table 4), but only at 3 months after sAVR (204±61 vs. 261±80 ms, p=0.033) (Table 4). Unlike the sAVR group (from 21.5±9.4 to 20±6.4, p=0.361), E/e′ ratio decreased significantly in the TAVR group immediately after the procedure (from 24.6±12.9 to 20 ±9.5, p=0.048) (Table 4, Fig. 3C). Moreover, immediately after the procedure, a significant decrease was found in right ventricular systolic pressure in the TAVR group, compared with the sAVR group (TAVR, 38.4±17.2 vs. 34±12.4, p=0.032 vs. sAVR, 32.2±11.7 vs. 30±6.8 mm Hg, p=0.27) (Table 4, Fig. 3D).
Changes in global LV afterload after TAVR and sAVR
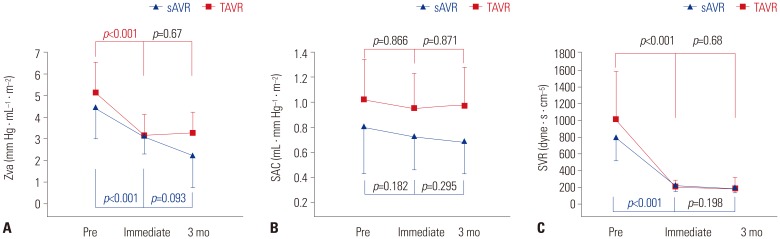
Valvuloarterial impedance (Zva) was significantly decreased immediate after the procedure in both groups (from 5.1±1.4 to 3.1±1.0 vs. from 4.5±1.5 to 3.1±0.8 mm Hg · mL−1 · m−2, p<0.001) (Fig. 4A) but a further decrease was observed only in the sAVR group (from 3.1±0.8 to 2.2±1.5 mm Hg · mL−1 · m−2, p=0.093) (Fig. 4A). In addition, SVR was significantly decreased immediately after the procedure (from 1044±628 to 198±100 vs. from 747±270 to 214±76 dyne · s · cm−5, p=0.001) (Fig. 4C), although no further decrease was noted 3 months later in either group. Although the SAC of TVAR was greater than that of sAVR at baseline (1.06±0.27 vs. 0.76±0.37 mL · mm Hg−1 · m−2, p=0.02) (Fig. 4B), there was no change in SAC immediately after the procedure or 3 months later in either group (from 0.76±0.37 to 0.7±0.29 vs. from 1.06±0.27 to 0.94±0.29 mL · mm Hg−1 · m−2, p=0.295) (Fig. 4B).
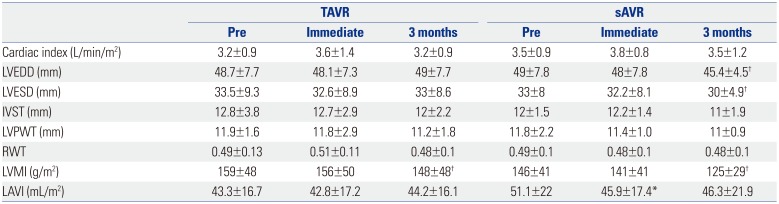
LA and LV structural changes after TAVR and sAVR
In both groups, LV chamber size, including LV end-diastolic diameter (LVEDD), LV end-systolic diameter (LVESD), and the thicknesses of the septum and posterior wall, did not change significantly over time, except for LVEDD and LVESD at 3 months after sAVR (LVEDD, from 49±7.8 to 45.4±4.5 mm; LVESD, from 33 ±8 to 30±4.9 mm, p<0.05, respectively) (Table 5). LV mass and LVMI were unchanged immediately after the procedures. Meanwhile, however, LVMI decreased significantly and RWT tended to be lower 3 months after the procedures (LVMI: TAVR, from 159±48 to 148±48 vs. sAVR, from 146±41 to 125±29 g/m2; RWT: TAVR, from 0.49±0.13 to 0.48±0.1 vs. sAVR, from 0.49±0.1 to 0.48±0.1, p=0.001 vs. p=NS) (Table 5). LAVI significantly changed only immediately after sAVR (from 51.1±22 to 45.9± 17.4 mL/m2, p=0.015) (Table 5).
Clinical outcomes
All sAVR and TAVR patients had a favorable postoperative course without any 30-day mortality. During the 3-year follow-up period, 5 patients (13%) died in the TAVR group versus 3 patients (11%) in the sAVR group (p=0.186). Stroke occurred in 3 patients (11%) in the sAVR versus no patients in the TAVR group (p=0.081). Major bleeding events developed in 5 patients (13%) in the TAVR group and 4 patients (15%) in the sAVR group (p=0.628). Complete atrioventricular block requiring permanent pacemaker insertion developed in 5 patients (13%) in the TAVR group and 2 (7%) in the sAVR group (p=0.341). There were 3 pericardial effusions (8%) in the TAVR group and 1 episode of ventricular tachycardia requiring defibrillation in the sAVR group. There was a significant intergroup difference in the prevalence of clinically related pleural effusion (80% in the sAVR group vs. 29% in the TAVI group, p<0.001) immediately after the procedure. Post-procedurally, aortic regurgitation was observed in 26 patients (68%) in the TAVR group only, the degrees of which were all less than moderate.
DISCUSSION
This study demonstrates the possible contrasting effects of TAVR and sAVR on diastolic function over time, especially those immediately after the procedure and 3 months later in cases of high-risk AS. We found more significant and earlier improvement in diastolic function in the TAVR group versus the sAVR group. We noticed that this improvement was achieved through a marked decreased in PG across AV and led to an increase in E and e′ velocity, elongation of DT, and a decrease in E/e′ ratio in the TAVR, compared the sAVR group. In result, there was an early and rapid recovery of diastolic grade distribution immediately after the procedure in the TAVR group.
The major hemodynamic feature of AS is LV pressure overload. As a result of increased afterload and LV remodeling,1920 AS leads to LV diastolic dysfunction, increased filling pressures, and heart failure symptoms. Diastolic dysfunction occurs even in the early disease course, followed by an increase in LV mass.21 As observed in other previous studies, after TAVR, our patients showed significant increases in effective orifice area with marked reductions in transvalvular pressure gradients equivalent to a reduction in LV afterload.2 Accordingly, E and e′ reflecting early diastolic relaxation increased significantly and immediately after TAVR. These results are consistent with previously published data from Gonçalves, et al.2 and Guarracino, et al.,22 who calculated parameters of LV relaxation within minutes after TAVR. In our patients, DT also increased, suggesting that LV chamber compliance improved immediately after TAVR due to a reduction in LV afterload. All of our patients exhibited LV diastolic dysfunction before valve implantation, with grade II being the most prevalent (47.3%). Utilizing an integrative approach focusing on e′, E/A ratio, DT, and E/e′ ratio, almost half of the patients (42%) in the TAVR group improved by at least one grade, compared with 11% in the sAVR group. This is because E wave velocity and DT increased which might be the consequence of increased relaxation and improved LV compliance due to almost complete normalization of the afterload. Interestingly, these effects were more prominent immediately after TAVR than sAVR, and the differences therein may be explained by a higher-pressure gradient across AV and more marked reduction in PG versus sAVR. E/e′ ratio, which is a parameter for the evaluation of LV filling pressure,23 slightly, but significantly, improved immediately after the procedure in only the TAVR group. The change in LA volume did not change, which supported the chronicity of diastolic dysfunction, and the procedure had no effect on LA volume in the TAVR group. In addition, change in LA size reflected the chronicity index for a long-term change. Our study population consisted of relatively acute-phase patients (up to 3 months). Therefore, although LA size was one of the parameters of diastolic function, it did not change during the study period, although because our study had a small sample size and had a retrospective design, selection bias might have occurred. Notwithstanding, the acute recovery in diastolic function parameters found in our study is in accord with that seen in a previous study,2 although the previous study measured function parameters during the procedure and did not compare them with a surgical group. Our study aimed to compare the effects of TAVR and sAVR immediately after the procedure and 3 months later based on transthoracic echocardiography findings in order to reflect the realworld situation of changes immediately after the procedure and the outpatient situation.
Although sAVR is the conventional and reference treatment in patients with symptomatic AS and clinical improvement is expected in patients undergoing sAVR, diastolic stiffness along with relaxation normalization are recognized in late follow-up.24 In our study, immediately after sAVR, patients also showed improvements in E and e′ velocity, but no increase in DT and no decrease in E/e′ ratio. These effects reflected the change in diastolic function grade immediately after the procedure. As a result, only 11% of the sAVR patients improved by at least one grade compared with TAVR (47%). The mean heart rate was faster in the sAVR group than in the TAVR group (83±13 vs. 73±15 bpm, p=0.003), and pleural effusion and pulmonary edema were more prevalent. After 3 months, the diastolic function distribution in the sAVR group was comparable to that in the TAVR group. A previous study showed that while TAVR did not influence RV function, it worsened in patients undergoing sAVR.25 RSVP did not deteriorate in our sAVR patients, although this does not indicate a lack of RV function deterioration, because we did not measure RV function, such as fractional area change and tricuspid annular plane systolic excursion. In sum, favorable effects on LV diastolic function could play a major part in reducing postoperative complications, such as pulmonary insufficiency, continued mechanical ventilation, renal insufficiency, myocardial dysfunction with demand for inotropes, and lengthened hospitalization, thus positively influencing the reported favorable short-term morbidity and mortality rates of surgery.26 In contrast, for patients allocated to sAVR, limited assumptions can be made. The normalization of LV diastolic function24 and improvements in ejection fraction, volumes, and hypertrophy have been observed in long-term follow-up,27 whereas short-term results appear to be limited by the effects of extracorporeal circulation, positive inotropic drug administration, and the existence of paradoxical septum.
Immediately after valve replacement, no significant interval change was found in RWT or LVMI, which are representative of ventricular remodeling parameters, in either of the study groups. The sAVR group had more profound LV mass regression after 3 months. Early regression in mass and reverse LV remodeling after TAVR were reported in a previous study.28 In addition, previous 6-month follow-up TTE studies demonstrated that TAVR results in LV and LA reverse remodeling and ameliorates LV relaxation and LA filling pressure in patients with severe AS and concentric hypertrophy.2930 However, in our study, LV mass regression occurred earlier, and LV mass tended to be lower immediately after the procedure than after 6 months. LV mass regression can be explained by reduced LV afterload and concomitant change in LV wall thickness. Although LVEDD, LVESD, and mitral regurgitation did not differ significantly between groups, smaller LVEDD and LVESD in the sAVR group, especially after 3 months, might be affected by less aortic regurgitation in sAVR than in TAVR, with more patients using diuretics frequently after surgery to manage pleural effusion and pulmonary edema. Other factors that could affect LV remodeling (e.g., hypertension, renal dysfunction, sex) and ventricular function warrant further study.
Limitations
This was a single-center study with a small number of patients and relatively short follow-up period. We found it difficult to find a matched surgical AVR group for head-to-head comparison with TAVI group in the TAVI era among TAVI candidate patients who were old and at high risk. Accordingly, we enrolled sAVR patients during the same period with the criterion of over 75 years of age for comparison with TAVR group. Because this study was not a randomized controlled trial, selection bias may be a factor due to patients with reduced EF not being included and patients with more advanced diastolic function being included. Furthermore, this was principally an echocardiographic study, and we were unable to manifest differences in clinical outcomes between subgroups, possibly due to differences in diastolic dysfunction grade. The potential impact on clinical outcomes must be evaluated in a larger prospective trial with a longer follow-up, and a multi-center, large number registry study will be need in the future.
Conclusion
Our results indicate that LV diastolic function improves more rapidly and immediately after TAVR despite higher baseline risk. In addition, noted improvements persisted for up to 3 months. Thus, in patients with severe AS with advanced diastolic dysfunction and at higher surgical risk, TAVR might be a better option than surgery and, potentially, the standard of care for severely symptomatic inoperable patients or for those at high risk of non-cardiovascular mortality after conventional surgery. These results might explicate the remarkable clinical improvement in improvements in advanced diastolic dysfunction immediately after the TAVR procedure than sAVR.
 XML Download