

 PDF
PDF ePub
ePub Citation
 Print
Print


INTRODUCTION
Healthcare-associated influenza transmission, particularly via healthcare workers (HCWs), is an important issue in healthcare-associated infection control. Annual influenza vaccination for HCWs has been proposed to be the most effective method to prevent nosocomial transmission.12) The Advisory Committee on Immunization Practices and many healthcare authorities recommend that all HCWs receive annual influenza vaccination to reduce influenza-related mortality and morbidity. However, many obstacles to the achievement of high vaccination rates, including lack of availability, vaccine avoidance, disbelief of vaccine efficacy, and lack of concern for influenza illness exist.3) Based on this background, several healthcare institutions and authorities recommend mandatory influenza vaccination for HCWs; however, some controversies on the exercise being ‘mandatory' still exist.45) Therefore, in order to improve voluntary vaccination rate from the viewpoint of autonomy, it is important to identify the characteristics and associating factors of influenza vaccination among HCWs.
This study was planned to investigate influenza vaccination rates for HCWs during the 2017–2018 influenza season in South Korea, where a non-mandatory vaccination exercise was conducted. We also explored the factors affecting influenza vaccination rates, including demographic and occupational characteristics.
MATERIALS AND METHODS
1. Study population and design
Three tertiary-care hospitals, National Health Insurance Service Ilsan Hospital (817 beds), Ilsan Paik Hospital (800 beds), and National Cancer Center (605 beds), in Goyang City of Gyeonggi Province, which has a population of 1,005,102 persons, participated in the study. All HCWs who worked in those hospitals were eligible for the study. The vaccination records on 2017–2018 influenza vaccine, age, sex, and occupational characteristics of HCWs during the vaccination campaign in each hospital, were collected retrospectively. HCWs who were 65 years or older were excluded from the study because they were also eligible for the national immunization program of seasonal influenza vaccination. Volunteers were excluded from the study because of lack of personal-identifiable data and service-related information. The study was approved by the Institutional Review Boards of the National Cancer Center (IRB No. NCC-2018-0119) and of the other participating hospitals. Requirements for informed consent were waived. All participant-identifiable data were deleted or modified prior to data analysis.
2. Categorization according to occupational characteristics
The occupational groups were divided into medical and non-medical groups. The medical group is defined as the occupational group that specializes in medical practice, and non-medical group is defined as the occupational group that conducts medical assistance or general service. The medical group was further divided into physicians, nurses, and health technicians. In the case of physicians, they were subdivided into medicine/pediatrics, surgery, intern doctor, and others subgroups. Others group included the specialist doctors of emergent department, radiology, pathology, laboratory medicine, dermatology and ophthalmology. Nurses were also subdivided into nurses working in in-patient wards, out-patient clinics, and other subgroups, depending on their workplace. Healthcare technicians included emergency paramedical personnel, laboratory staffs, nursing assistants, pathology technicians, radiology technicians, and rehabilitation therapists. For non-medical groups, the HCWs were divided according to the degree of frequent contact with patients. Group A (frequent contact with patients) included security agents, patient transfer agents, janitors, and clinical trial-related researchers; whereas laboratory researchers, general office workers, medical records staffs, nutritionists, facility management staffs, and bioengineering staffs were included in group B (less-frequent contact with patients).
3. Influenza vaccination campaign for HCWs
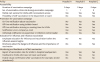
Prior to the 2017–2018 influenza season, influenza vaccinations were provided to all HCWs at each hospital. To increase the accessibility of vaccination, all hospitals have provided free influenza vaccinations through in-service carts to hard-to-reach staff, and medical HCWs in 2 out of the 3 hospitals were allowed self-vaccination in general wards. Each hospital encouraged the seasonal influenza vaccination through a campaign, educated, and promoted the need for vaccination; each hospital headquarters received reports on the HCW vaccination rates. In the case of on-site vaccination or mobile cart services, vaccines were kept in a cold box/freezer set with a thermometer (2°C and 8°C) until vaccination to maintain a ‘cold chain’. Table 1 summarizes the details of the campaign program of each hospital.
Table 1
Encouraging methods and affecting factors for influenza vaccination for HCWs by hospitals
4. Statistical analysis
Categorical variables were summarized with frequencies (percentages). To evaluate the association between categorical variables and vaccination rate, χ2 test was used for univariate analysis. A difference of at least 5% among the groups was considered to be different, and estimates with smaller differences were considered similar.6) P-value <0.05 was considered as statistical significance. Statistical analysis was executed using SPSS version 19 (IBM Corp., New York, NY, USA) and GraphPad Prism version 7.03 (GraphPad Software, La Jolla, CA, USA).
RESULTS
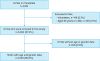
A total of 7,180 HCWs were eligible for the influenza vaccination campaign during the 2017–2018 influenza season. Volunteers (n=148) and HCWs whose ages were 65 years or older (n=38) were excluded. As a result, only 6,994 HCWs (97%) were included in this study. Information on occupation was accessible for all eligible HCWs, but information on age and sex were available for only 89% of all eligible HCWs (Fig. 1).
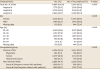
Overall, influenza vaccination rate among HCWs was 85%. Differences in the influenza vaccination rates existed among the hospitals (A, 85%; B, 91%; and C, 80%, P<0.001). Female HCWs were more likely to receive influenza vaccination than male HCWs (88% and 81%, P<0.001). By age, the vaccination rate among HCWs between 30 and 39 years was the lowest with 83%; whereas the rate among HCWs between 60 and 64 years was the highest with 92% (P<0.001). Even when looking at each hospital, it was observed that female HCWs had higher vaccination rates than male HCWs (A, 87% vs. 80%; B, 92% vs. 88%; and C, 86% vs. 73%, P<0.01). However, in the case of age, the vaccination rate was lowest in the 30s in the A and B hospitals, while the lowest in the 40s in the C hospital (20s, 87%; 30s, 83%; 40s, 75%; and 50s, 79%; P<0.01, Supplementary Tables 1 and 2). Analysis of the vaccination rates according to occupational groups showed that nurses had the highest rate with 92%, followed by health technicians with 88%, physicians with 84%, and non-medical HCWs with 79% (P<0.001, Table 2).
Table 2
Characteristics of study population
1. Subgroup analysis according to detailed occupational groups
Among physicians, vaccination rate of the medicine/pediatrics subgroup was the highest with 88%, followed by others subgroup with 84%, surgery subgroup with 80%, and intern doctor subgroup with 77%. The vaccination rate of the medicine/pediatrics and others subgroups was 86%, which was significantly higher than that of the surgery and intern doctor subgroup (79%) (P=0.013, Fig. 2A). No difference in the vaccination rate among the age groups within the physician group was noted (P=0.94). Female physicians seemed to have a higher influenza vaccination rate than male physicians, but there was no significant difference (87% and 82%, P=0.063). Among nurses, the vaccination rate of the out-patient clinic and in-patient ward subgroups, who frequently contact and care for patients, was significantly higher than that of the other nurse subgroups (93% and 87%, P<0.001, Fig. 2B). In the subgroup analysis, the vaccination rate of in-patient ward subgroups was 92% and that of out-patient clinic subgroup was 96%, which was statistically significant (P=0.003). Vaccination rate was highest in nurses who were at least 50 years (99%), followed by 40–49 years (94%), 20–29 years (93%), and 30–39 years (87%) (P<0.001). Female nurses seemed to have a higher influenza vaccination rate than male nurses, but there was no significant difference (92% and 88%, P=0.288). Among healthcare technicians, no difference in the vaccination rate according to age or sex was noted (data not shown).
Fig. 2
Different influenza vaccination rate according to occupational subgroup. (A) Physicians, (B) Nurses, and (C) Non-medical HCWs.
Abbreviation: HCW, healthcare worker.
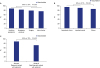
For non-medical HCWs, influenza vaccination rates were different, depending on the frequency of contact with patients. In the case of group A non-medical HCWs, who had frequent contact with patients, the vaccination rate (90%) was significantly higher than that (73%) of group B non-medical HCWs, who had less frequent contact with patients (P<0.001, Fig. 2C).
DISCUSSION
Compared with previous studies on mandatory influenza vaccination, non-mandatory influenza vaccination rate among Korean HCWs in this study is not as high as the mandatory vaccination. We observed that vaccination rates can differ according to HCWs' age, sex, and occupational characteristics.411)
Influenza vaccination rates among HCWs vary by country, region, and year. In general, vaccination rates in Europe are as low as less than 40% (range, 14–64%), but it is relatively high in North America (USA and Canada) with around 60–80% (range, 30–92%), with mandatory campaigns increasing the rate to 95–99%.457) In addition, some studies reveal that the annual influenza vaccination rate among HCWs is gradually improving.16) In South Korea, the vaccination rate among HCWs during the 2009–2010 season reported at 61% in a previous study conducted by Yoon et al.8) the rate increased to 85% during the 2017–2018 season in our study. Although differences in demographics and regional distributions between the studies have to be taken into account, this trend may be due to an increased awareness against nosocomial influenza transmissions and/or arousal of personal protection for influenza vaccination.9) To ensure that this trend is maintained, consecutive monitoring should be done for a longer period.
Different influenza vaccination rates according to specific occupational characteristics is one of the interesting findings in our study. Among physicians and nurses, the rate of vaccination was highest in medical doctors/pediatricians and out-patient/in-patient ward nurses, respectively. These medical HCWs are more likely to have contact with patients having the influenza illness than other medical HCWs. Therefore, they have a higher chance of infection and transfer of the influenza virus in the hospital. Moreover, among some non-medical HCWs, such as security agents and patient transfer agents in group A, their occupation exposes them to more contact with patients, since their range of work is broad in the hospital. As a result, the extent of possible exposure in the hospital could be larger. Therefore, influenza vaccination in these groups needs to be emphasized.
Meanwhile, the vaccination rates differed from 80% to 91% by hospital. This can be caused by demographic and occupational distribution of HCWs, differences in vaccination campaigns, or differences in perceptions of vaccination. However, the sex ratios of the 3 hospitals in this study were 28:72, which was the same, and the age structure was similar. In addition, C hospital, which had the longest vaccination campaign period and had many intervention items, showed the lowest vaccination rate among the 3 hospitals. This suggests that there are other factors that affect vaccination rates, including factors such as disbelief or misbelief about vaccination.410) In order to clarify this hypothesis, it is necessary to conduct a questionnaire survey on HCWs to evaluate the extent of recognition, knowledge, and attitude to vaccination.
This study had limitations. This 1-year observation study did not monitor the vaccination rate for years. Therefore, it is difficult to directly compare changes in vaccination rates over a long period of time. In addition, we could not identify the difference in vaccination rate according to the HCWs' awareness or attitude because the questionnaire used in the survey was not combined. Finally, in the subcategories of physicians, the others group includes a variety of specialty occupations, which may lead to different vaccination rates among them. However, there were limitations for subgroup analysis because there were many specialties in the physician's field and there were not enough number of specialists in each specialty. Therefore, we focused to identify the difference of vaccination rate between the medicine/pediatrics group and the surgeon group.
This study had several strengths. First, it gave the latest information about influenza vaccination rate among HCWs in Korea. Second, our data suggest that occupational characteristics may need to be considered when establishing an influenza vaccination strategy.310)
In conclusion, the influenza vaccination rate among HCWs for the 2017–2018 influenza season in Korea was 85%, which is higher than the previously reported non-mandatory vaccination rate in other countries. The vaccination rate may differ according to certain detailed characteristics. Therefore, a multifaceted approach is needed to increase the vaccination rate.
 XML Download