

 PDF
PDF ePub
ePub Citation
 Print
Print


INTRODUCTION
METHODS
Study subjects
Calculation of gap-fasting plasma glucose
Outcomes
Statistical analysis
Ethical statement
RESULTS
Changes in FPG and HbA1c
Table 1
Clinical Characteristics of Participants According to Baseline Gap-FPG
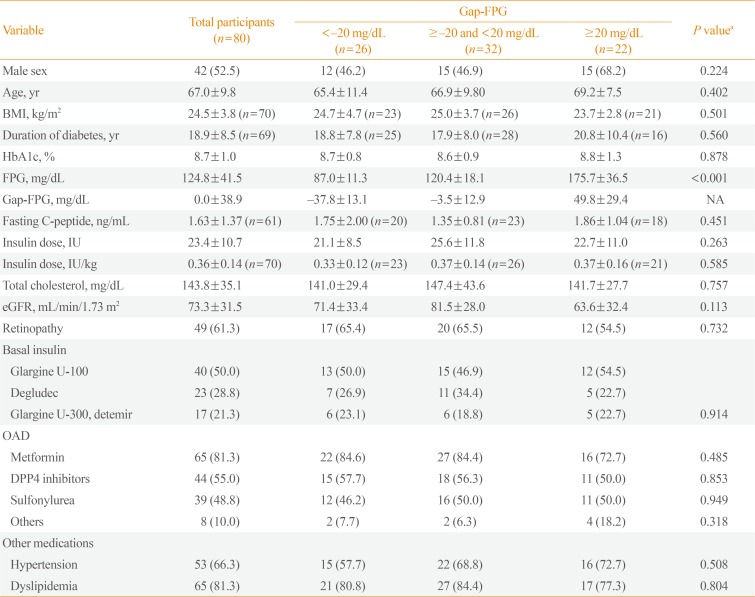
Values are expressed as number (%) or mean±standard deviation.
FPG, fasting plasma glucose; gap-FPG, gap between measured FPG and predicted FPG; BMI, body mass index; HbA1c, hemoglobin A1c; NA, not applicable; eGFR, estimated glomerular filtration rate; OAD, oral antidiabetic drug; DPP4, dipeptidyl peptidase IV.
aP values for overall differences among the three groups according to gap-FBS, analyzed by one-way analysis of variance and the chi-square test.
![]()
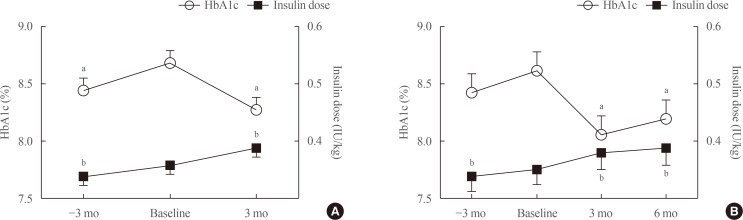 | Fig. 1Changes in hemoglobin A1c (HbA1c) levels and the insulin dose before and after the replacement of basal insulin with once-daily insulin degludec/insulin aspart (IDegAsp). (A) Changes up to 3 months after the replacement of basal insulin with once-daily IDegAsp. (B) Changes up to 6 months after the replacement of basal insulin with once-daily IDegAsp (n=35). a,bP<0.05 vs. baseline by post hoc analyses (the Bonferroni multiple comparison test and the Dunn multiple comparison test).
|
Different glycemic effects of IDegAsp according to gap-FPG
Table 2
Comparison of Insulin Doses and HbA1c Levels before and after the Change to Once-Daily IDegAsp from Basal Insulin According to Gap-FPG
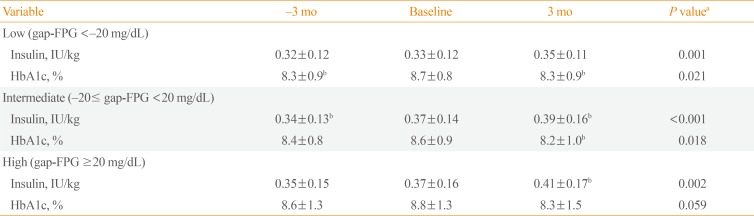
Values are expressed as mean±standard deviation.
HbA1c, hemoglobin A1c; IDegAsp, insulin degludec/insulin aspart; gap-FPG, gap between measured fasting plasma glucose (FPG) and predicted FPG.
aP values for overall differences among the three time points analyzed by repeated-measures analysis of variance; bP<0.05 vs. baseline by post hoc analyses (the Bonferroni multiple comparison test).
![]()
Different glycemic effects of IDegAsp according to insulin deficiency
Table 3
Comparison of Insulin Doses and HbA1c Levels before and after the Change to Once-Daily IDegAsp from Basal Insulin According to Insulin Reservoir
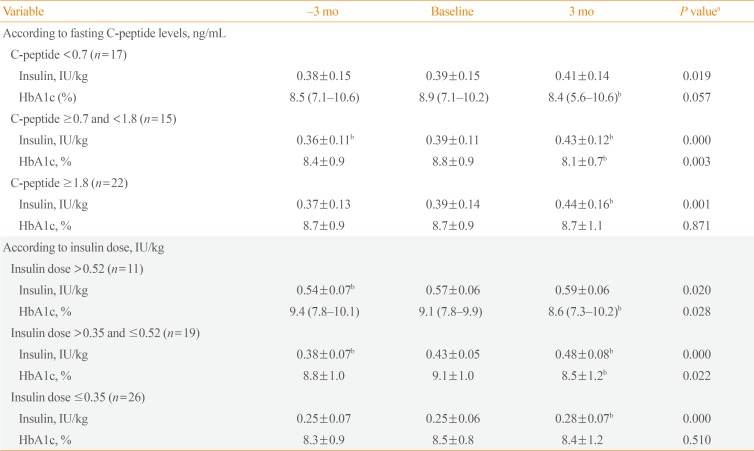
Values are expressed as mean±standard deviation or median (range).
HbA1c, hemoglobin A1c; IDegAsp, insulin degludec/insulin aspart.
aP values for overall differences among the three time points analyzed by repeated-measures analysis of variance and the Friedman test; bP<0.05 vs. baseline by post hoc analyses (the Bonferroni multiple comparison test and the Dunn multiple comparison test).
![]()
 XML Download