

 PDF
PDF ePub
ePub Citation
 Print
Print


INTRODUCTION
Pulmonary arterial hypertension (PAH) is a progressive, life-threatening disease affecting pulmonary vasculature, and has a grave prognosis.1) Although the pathogenesis of PAH is not completely understood, 3 factors are implicated in the increased pulmonary vascular resistance; vasoconstriction, pulmonary vascular remodeling, and thrombosis in situ.2)3) Thus, the current advanced PAH targeted therapies are directed at one of 3 intracellular pathways1): the endothelin, prostacyclin or nitric oxide pathway. Despite remarkable progress in the past 10 years, a late diagnosis and the late establishment of PAH-targeted therapy are partly responsible for the poor prognosis.4) The EARLY study clearly demonstrated that early therapeutic intervention with the endothelin receptor antagonist, bosentan, could delay clinical deterioration in PAH, and thus should be considered for the improved management and prognosis of PAH.5) However, no data are available regarding the histopathologic and hemodynamic advantages of early treatment with the endothelin receptor antagonist.
Recently, a new dual endothelin receptor antagonist macitentan (MAC) has become available for clinical use to delay disease progression, with clinical evidence of morbidity and mortality benefits.6) In the present study, we used a monocrotaline (MCT)-induced PAH rat model to explore hemodynamic and histopathologic benefits on the early initiation of MAC. We also evaluated the potential benefits of the early initiation of a combination therapy consisting of MAC as the main PAH-targeted therapy, and sildenafil (SIL), a selective inhibitor of phosphodiesterase type 5. SIL was chosen for the combination therapy because it is the most frequently prescribed PAH drug in the clinical practice. SIL is also known to improve exercise capacity and hemodynamics in patients with symptomatic PAH,7) and is known to exert additional pleiotropic effects, such as anti-hypertrophic and anti-apoptotic effects on myocytes, limiting myocardial remodeling in response to stress and thus attenuating heart failure development.8)9) Therefore, MAC and SIL could have additive beneficial effects on fibrosis, remodeling, and right ventricular (RV) hemodynamics during the early stage of PAH.
METHODS
Animal model
Male Sprague Dawley (SD) rats (n=62) with a body weight of 350–400 g were provided free access to tap water and standard rat chow, and were housed in a room with a 12:12-hour light cycle, a temperature of 21°C, and a humidity of 55%. The experimental protocols were approved by the Institutional Animal Care and Use Committee of Seoul National University Hospital.
Although no animal model fully reflects the pathophysiology of human PAH, rat models of PAH have been developed by either MCT injection or chronic hypoxia with pulmonary artery banding (with or without SU-5416).10) In the present study, MCT subcutaneous injection was chosen to induce PAH, as this model has been a mainstay for the study of new therapeutic interventions.4)11) Although the precise mechanism involved is unknown,4)10) MCT-induced PAH models also show similar histological findings to human PAH, such as the excessive proliferation of pulmonary arterial smooth muscle cells, endothelial dysfunction, and pulmonary vascular remodeling.
Since a high dose of MCT (80 mg/kg) is fatal within 3 weeks,12) a dose of 60 mg/kg was selected, as in previous studies.11)13) This resulted in a PAH rat model that developed over an extended period, more closely reflecting the chronic pathologic process of human PAH. MCT (Sigma/C2401; Sigma-Aldrich, St. Louis, MO, USA) was dissolved in 0.5 N of HCl, and the pH was adjusted to 7.4 with 0.5 N of NaOH. The solution was given as a single subcutaneous injection (60 mg/kg). Sham rats received an equal volume of isotonic saline.
Based on the preliminary experiment shown in the Supplementary Figure 1, the initiation of PAH-targeted therapy 3 weeks after MCT injection should be considered ‘late’. Therefore, the administration of PAH-targeted therapy in the current study was initiated one week after the MCT injection.
Study protocol
One week after MCT injection, rats were randomly assigned to receive one of three treatments as follows: 1) MAC administration (MAC group, n=16), 2) both MAC and SIL administration (MAC+SIL group, n=16), or 3) normal saline administration (MCT group, n=16). Twelve sham rats were included for comparison, in which normal saline was injected at the same dosage as the MCT. Cardiac function, exercise capacity, and body weight were monitored every 2 weeks. At the end of the study protocol, an invasive pressure-volume analysis via a Millar catheter system was conducted for hemodynamic assessment. Subsequently, hearts and lungs were rapidly dissected and weighed for histological analysis. The detailed experimental protocol is depicted in Figure 1.
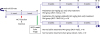 | Figure 1A schematic illustration of the preliminary experimental protocol is shown. Blue arrows indicate the time points at which body weight, echocardiography, and exercise capacity were assessed. The asterisk indicates the time point of the invasive pressure-volume hemodynamics assessment.MCT = monocrotaline; MAC = macitentan; N/S = normal saline; PAH = pulmonary arterial hypertension; SIL = sildenafil.
|
Drug administration
MAC 30 mg/kg/day (Actelion, Allschwil, Switzerland) was given orally by gavage once a day, based on previous studies regarding the maximal effective dose of MAC.14) Although this dosage is high for humans, rats metabolize MAC at a higher rate; thus a free endothelin-1 plasma concentration of 1.0 to 1.5 pg/mL is achieved, which is within the optimal therapeutic range for a dual ETA/ETB receptor antagonist.15) An oral dose of 100 mg/kg/day SIL citrate (Hanall Biopharma, Seoul, Korea) was given by gavage twice a day based on previous studies regarding the pleiotropic, vascular effects in pulmonary hypertension (PH) and heart failure models.8)9)16)
Physiological studies
Echocardiography
Transthoracic echocardiography was performed at 1 week before and 1, 3, 5, and 7 weeks after MCT injection. Non-intubated rats were placed in a dorsal recumbent position and were lightly sedated via inhalation of the lowest possible dose of isoflurane (initially 4%, then approximately 2–3%) mixed with oxygen. Images were acquired with a 9 MHz transducer connected to a Toshiba echocardiography machine (Nemio; Toshiba Co., Tokyo, Japan).8)17) RV free wall thickness and end-diastolic cavity dimensions were assessed using M-mode echocardiography at the papillary muscle level. RV fractional area change (RV-FAC) and tricuspid annular plane systolic excursion (TAPSE) were evaluated in the apical 4-chamber view, where tricuspid and mitral valves could be most clearly visualized. The absence of pulmonary stenosis was confirmed using continuous wave Doppler signal in the parasternal short axis view at the aortic valve level. The acceleration time of the pulmonary outflow Doppler signal (pulmonary artery acceleration time [PAAT]) was measured from the time of the onset of systolic flow to the time of peak pulmonary outflow velocity. The systolic RV-right atrial (RA) pressure gradient, a representative index of pulmonary artery systolic pressure (PASP), was calculated using the peak tricuspid regurgitation velocity (TR Vmax) using the simplified Bernoulli equation (ΔP=4×TRVmax2). True PASP could not be directly measured, as the inferior vena cava cannot be visualized in rats due to a relatively large liver volume.
All parameters were evaluated as an average of 5 consecutive beats. All echocardiographic studies were performed by an experienced echocardiographer with more than 5 years of animal experiment. The echocardiographer was blinded to the treatment group assignment. Two independent observers analyzed the echocardiographic images in a blinded fashion.
Exercise test and blood pressure monitoring
Maximal exercise capacity was evaluated using a Rota Rod Treadmill (Ugo Basile, Comerio, Italy). Rats ran to avoid falling off a knurled drum as the drum rotated. Animals were trained twice before testing to allow familiarization with the treadmill. Treadmill speed was gradually increased from 3 to 15 revolutions per minute every 1 minute. Exercise duration was recorded. An observer blinded to the study group recorded episodes of the immobility response due to exhaustion.
Systolic and diastolic blood pressures were measured in conscious rats via the tail-cuff method (Biopac System Inc., Goleta, CA, USA) at 1 week before and 1, 3, 5, and 7 weeks after MCT injection. At least a 1-day interval was allowed between blood pressure measurement and echocardiographic examination or exercise testing, minimizing the stress imposed on the animals.
Invasive hemodynamic assessment
At 7 weeks (56 days) post-MCT injection, invasive hemodynamic assessments were performed using a Millar pressure catheter (SPR-869; Millar Instruments, Houston, TX, USA) inserted into the RV. The rats were sedated via inhalation of a mixture of isoflurane (4%) and oxygen. Subsequently, endotracheal intubation was performed, and the animals were mechanically ventilated using a pressure-controlled respirator and a mixture of air and oxygen. The right jugular vein was cannulated for hypertonic saline (10%) infusion to determine parallel conductance. After a mid-sternal thoracotomy, the Millar conductance catheter was introduced into the RV and LV cavities via the apical approach (SRP-869 and SPR-847, respectively; Millar Instruments). A 3-0 surgical silk was passed around the inferior vena cava for transient occlusion during the protocol. After allowing for stabilization from the surgical preparation, data were continuously recorded on a personal computer using a pressure-volume unit (model MPVS-300; AD Instruments, Colorado Springs, CO, USA).
Heart rate, cardiac output (CO), RV end-diastolic/end-systolic volume and pressure, and LV ejection fraction (EF) were assessed via pressure-volume loops. The RV pressure upstroke (dP/dtmax) was calculated. The slope of end-systolic elastance (EES) was determined by linear regression. To determine Vo, additional loops were acquired during the injection of 100 µL of 10% hypertonic saline via the cannula placed in the left jugular vein. True volume was determined from the measurement of the aortic flow using an ultrasonic flow probe (Transonic systems, Maastricht, The Netherlands) around the descending thoracic aorta.8) Analyses of the pressure-volume loops were performed using a commercially available program, PVAN 3.5 (Millar Instruments).8)
Histopathological analysis
After the invasive hemodynamic measurements were completed, the rats were euthanized. The hearts and lungs were harvested and weighed.
Biochemical analysis of serum
Immunohistochemical analysis
The mid ventricle was removed for histopathology and was preserved in 4% paraformaldehyde and embedded in paraffin. The tissue was sectioned into 4 µm sections, and stained with Masson's trichrome to evaluate the degree of fibrosis. No correction was made for tissue shrinkage by the fixation procedure, as this factor is equal in all samples (Methods section of Supplementary Data).
Statistical analysis
Data are presented as mean±standard error of the means. The Kolmogorov-Smirnov test was performed to evaluate normality of all parameters. For normally distributed parameters, group differences were compared using unpaired t-tests or one-way analyses of variance, followed by post hoc analyses with Bonferroni correction. For non-normally distributed parameters, group differences were evaluated using the non-parametric Kruskal-Wallis test, followed by post hoc analyses with Mann-Whitney U test. A repeated measures analysis of variances was performed to evaluate changes over time in RV-RA pressure gradients, RV wall thickness, body weight and exercise capacity. A survival analyses were performed using the Kaplan-Meier method, and the Log-rank test was used for pairwise comparison. For the survival analysis, the first day of oral MAC administration was defined as day 0 and the rats were monitored for the entire experimental periods (7 weeks/56 days). All statistical analyses were performed using SPSS version 22.0 (SPSS Inc., Chicago, IL, USA), and a p<0.05 was considered statistically significant.
RESULTS
Survival and changes in body weight
A total of 62 rats were initially studied; however, one rat died during anesthesia for echocardiography and one rat with a poor echocardiographic window was excluded. Eight rats (50%) in the MCT group died during the study period, while no rats died in the sham group (p=0.009). Survival rates were comparable in the MAC and MAC+SIL groups (3 rats died in each group). In the Kaplan-Meier survival analysis, survival in the MCT group was significantly worse than that in the PAH-targeted medication groups (MAC and the MAC+SIL groups) (p=0.04) (Figure 2A).
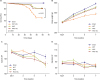 | Figure 2(A) Kaplan-Meier survival curves show a clear difference in survival between the MCT group and the MAC-based treatment groups (MAC and MAC+SIL groups) (p=0.04). (B) Serial changes in body weight over 7 weeks of MCT injection are shown. (C) Changes in systolic and diastolic blood pressure are compared among groups.MAC = macitentan; MCT = monocrotaline; SIL = sildenafil.
*p<0.05 vs. the sham group; †p<0.05 vs. the MCT group; ‡p=0.07 vs. the sham group.
|
Rats in the MCT group displayed a pronounced growth retardation, resulting in a significantly lower body weight at 7 weeks after MCT injection compared to that in the sham group (593.6±9.3 g for the sham group vs. 491.0±9.0 g for the MCT group, p<0.05). The slow weight gain in the MCT group became pronounced approximately 3 weeks after MCT injection (Figure 2B). Compared with the sham group, weight gain tended to be slower in the MAC and MAC+SIL groups, with no statistical significance (557.5±7.8 g for the MAC group and 550.7±7.8 g for the MAC+SIL group, both p>0.05) (Figure 2B).
Hemodynamic study
Heart rate and systemic blood pressure
There were no differences in the heart rate or systemic blood pressure between the sham and MCT groups throughout the study (Figure 2C and D).
Exercise capacity
There were no differences in exercise capacity prior to the first week after MCT injection. Beginning one week after MCT injection, exercise capacity became impaired in the MCT group, which was not observed in the sham group (at 7 weeks post-MCT injection, 601±19 seconds for the sham group vs. 342±17 seconds for the MCT group, p<0.05). In contrast, exercise capacity was relatively maintained in the MAC group and was significantly higher compared to that in the MCT group 7 weeks post-MCT injection (501±18 seconds for the MAC group vs. 342±17 seconds for the MCT group, p<0.05). The same trend was evident in the MAC+SIL group, and exercise capacity was comparable in the MAC+SIL groups at 7 weeks post-MCT injection (501±18 seconds for the MAC group vs. 483±18 seconds for the MAC+SIL group, Figure 3A).
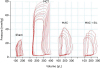
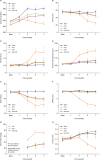 | Figure 3(A) Comparisons in exercise capacity. Exercise capacity began to deteriorate one week after MCT injection in the MCT group, but not in the sham group. In contrast, exercise duration was relatively preserved in the MAC group (p<0.05). Exercise capacity in the MAC+SIL group was comparable to that in the MAC group (p>0.05). (B) Serial assessments of RV-FAC. Serial echocardiography showed that rats with MCT-induced PAH rats had reduced RV-FAC beginning at 5 weeks. Treatment with MAC alone or combination with MAC and SIL attenuated the progression of RV systolic dysfunction. (C) Serial assessments of the RV-EDD on echocardiography. (D) Serial assessments of the RV wall thickness. (E) PAAT was measured from the time of the onset of systolic flow to the time of the peak pulmonary outflow velocity. Note the significant differences in the PAAT among the 4 groups beginning at 3rd weeks. (F) Serial assessments of the TAPSE. (G) Serial assessment of RV-RA PG. TR jet could be reliably quantified via continuous-wave Doppler around 3 weeks after MCT injection in the MAC and MAC+SIL groups. TR tracing was difficult to follow in the sham group, and thus, the RV-RA PG could not be reliably obtained in the sham group. (H) Serial assessment of LV-EDD. LV-EDD was smaller in the MCT group, where D-shaped LV at the parasternal short axis image was clearly visualized, indicating development of severe pulmonary hypertension. In contrast, both the MAC and the MAC+SIL groups showed no significant decrement in LV dimension with preservation of the LV geometry.LV = left ventricular; LV-EDD = left ventricular end-diastolic dimensions; MCT = monocrotaline; MAC = macitentan; PAH = pulmonary arterial hypertension; PAAT = pulmonary artery acceleration time; RA = right atrial; RV-FAC = right ventricular fractional area change; RV = right ventricular; RV-EDD = right ventricular end-diastolic dimension; RV-RA PG = right ventricular-right atrial pressure gradient; SIL = sildenafil; TAPSE = tricuspid annular plane systolic excursion; TR = tricuspid regurgitation.
*p<0.05 vs. the sham group; †p<0.05 vs. the MCT group.
|
RV remodeling after MCT injection as assessed noninvasively
There were no group differences in baseline RV diameter, RV free wall thickness, or RV systolic function (as assessed by RV-FAC, PAAT, and TAPSE) (Figure 3B-3F). In almost all rats, a tricuspid regurgitation (TR) jet was not observed on baseline echocardiography. TR invariably developed in all rats with an MCT injection; however, the time point at which TR developed varied. Seven weeks after MCT injection, the MCT group exhibited a higher RV-RA pressure gradient (70.2±5.7 mmHg) vs. that in the MAC and MAC+SIL groups (all p<0.05). MAC administration decreased the RV-RA pressure gradient by 50% (35.04±5.5 mmHg) compared to that in the MCT group (p<0.05). Interestingly, the co-administration of MAC and SIL did not further reduce the RV-RA pressure gradient (MAC+SIL group, 33.64±8.0 mmHg; p<0.05 vs. the MCT group; p>0.05 vs. the MAC group) (Figure 3G). LV end-diastolic dimensions were smaller in the MCT group compared to that in the other groups (Figure 3H and Figure 4), with D-shaped LV at the parasternal short axis image visualized, indicating the development of severe PH. In contrast, both the MAC and MAC+SIL groups showed no significant reduction in LV dimensions and no changes in LV geometry. Conventional RV variables at 7 weeks after MCT injection revealed that the MCT group had developed a dilated and hypertrophied RV along with RV systolic dysfunction, as demonstrated by a significant reduction in RV-FAC, TAPSE, and PAAT in the MCT group compared to that in the sham group. MAC treatment attenuated the development of RV systolic dysfunction (RV-FAC 25±7% for the MCT group vs. 44±3% for the MAC group, p<0.05). Interestingly, the co-administration of MAC and SIL (i.e., the MAC+SIL group) showed no additional benefit regarding the preservation of RV systolic function compared to that in the MAC group (Figure 4). Thus, RV hypertrophy was prevented by MAC administration irrespective of SIL co-administration (Figure 3D).
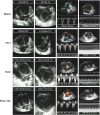 | Figure 4Representative echocardiographic images are shown for each group.LV = left ventricular; MCT = monocrotaline; MAC = macitentan; PAAT = pulmonary artery acceleration time; RV-RA PG = right ventricular-right atrial pressure gradient; SIL = sildenafil; TAPSE = tricuspid annular plane systolic excursion.
|
Invasive hemodynamic measurement
Invasive hemodynamic data are summarized in Table 1. There were no group differences in heart rate, systemic blood pressure, or dP/dtmax (mmHg/s). As expected, RV end-systolic (ESV, µL)/end-diastolic (EDV, µL) volumes, peak pulmonary artery pressure (mmHg), EES (mmHg/µL), Eed (mmHg/µL), end-systolic pressure volume relationship (ESPVR) (µL), lung weight (gm), and the RV/(LV+septum) weight ratio were significantly higher in the MCT group compared to that in the sham group (all p<0.05). The administration of MAC alone or in combination with SIL significantly reduced the RV/(LV+septum) weight ratio compared to that of the MCT group (21% reduction in the MAC and 20% reduction in the MAC+SIL groups, both p<0.05). Lung weight was also significantly decreased in the MCT and MAC+SIL groups compared to that in the MCT group (both by 30%; both p<0.05). Representative RV pressure-volume images are provided in Figure 5.
Table 1
Hemodynamic parameters 7th weeks after MCT injection

Data are means±standard error of the means.
MCT = monocrotaline; MAC = macitentan; MAC+SIL = combination therapy with macitentan and sildenafil; HR = heart rate; SBP = systolic blood pressure; DBP = diastolic blood pressure; RV = right ventricle; LV = left ventricle; ESV = end-systolic volume; EDV = end-diastolic volume; ESPVR = end-systolic pressure volume relationship; EF = ejection fraction; CO = cardiac output.
*p<0.05 vs. the sham group; †p<0.05 vs. the MCT group.
![]()
Histopathological analysis for myocardial fibrosis
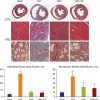
Histopathologic data are summarized in Figure 6. Gross pathological examination showed that the heart was significantly enlarged (especially, the RV) with RV hypertrophy in the MCT group at 7 weeks post-MCT injection (Figure 6). Cardiac and lung fibrosis were significantly increased in the MCT group compared to that in the sham group (mid and lower parts of Figure 6). RV hypertrophy and fibrosis were significantly reduced in both the MAC and MAC+SIL groups vs. the MCT group. The RV/(LV+septum) weight ratio was significantly higher in the MCT group compared to that in the MAC and MAC+SIL groups (both p<0.05). In addition, the lung weight was two times heavier in the MCT group compared to that in the sham group (p<0.05). The MAC group and MAC+SIL group did not significantly differ in the quantification of interstitial and perivascular fibrosis.
Serum biochemical analysis for drug safety assessment
The incidence of elevated aspartate aminotransferase (AST), total bilirubin, and serum creatinine levels at more than 2 times the upper normal limits were significantly higher in the MCT group compared to that in the other groups. As expected, the serum B-type natriuretic peptide (BNP) level was higher in the MCT group compared to that in the sham group. In addition, serum BNP levels were significantly attenuated in the MAC and MAC+SIL groups compared to that in the MCT group (Supplementary Figure 3).
DISCUSSION
The main strength of the current study is that, a Millar conductance catheter system was used along with noninvasive echocardiography for RV assessment, since echocardiography alone cannot reliably provide hemodynamic changes.
Despite recent advances in the genetics, pathophysiology, and treatment of PAH, the long-term prognosis is still suboptimal. Even in the contemporary PAH-targeted therapy era, the 1-year morbidity and mortality still approaches 15% in patients with idiopathic, familial/heritable PAH,2)6) and is much higher (approximately 30%) in patients with connective tissue disease-associated PAH.18)19) This may be because PAH diagnosis is usually made in World Health Organization Functional Class (WHO-FC) III or IV in daily practice.7)20)21) It is evident that patients with WHO-FC I or II PAH have a better long-term prognosis than those with WHO-FC III or IV PAH have.2)7)19)20)21) The EARLY study clearly demonstrated that the early initiation of bosentan treatment in patients with WHO-FC II PAH significantly improved pulmonary vascular resistance at 6 months Importantly, clinical and hemodynamic deterioration was clearly observed over the 6-month follow-up period in the placebo group, illustrating that PAH is a rapidly progressive disease, even at earlier stage.5) Therefore, an early diagnosis and early therapeutic intervention are both of crucial value.
MAC is a next generation endothelin-receptor antagonist recently approved for clinical use.6) MAC has several advantages over bosentan, including increased efficacy and improved safety profiles,22) and a low propensity for drug-drug interactions.23) Although the clinical efficacy of MAC was well proven in the SERAPHIN trial, the beneficial effects of early intervention with MAC in terms of the hemodynamics (by a Millar conductance catheter system) and histopathology have not yet been investigated.
Here, we showed that MAC administered at a less advanced stage of PAH significantly attenuated the development of RV systolic dysfunction, RV dilatation and RV hypertrophy; and PASP elevation. These hemodynamic benefits translated into the preservation of exercise capacity. In addition, interstitial and perivascular myocardial fibrosis were significantly reduced in the MAC and MAC+SIL groups. Based on the current data, the use of MAC at an earlier stage of PAH can be expected to delay the hemodynamic and histopathologic progression.
The AMBITION trial recently demonstrated that initial combination therapy with ambrisentan and tadalafil improved outcome compared to the ambrisentan or tadalafil monotherapy.24) Importantly, the AMBITION trial enrolled about 30% Fc II PAH patients (i.e., patients at an early stage of disease) and provided clinical evidence showing the beneficial effect of the combination therapy with ambrisentan and tadalafil at an early stage of disease course. The current study provides hemodynamic and histopathological evidences supporting early use of PAH-targeted therapy. Of note, in the current study, the combination therapy of MAC with SIL at an earlier stage of the disease did not result in better hemodynamic or histopathological profiles compared to that with MAC treatment alone. Although we cannot clearly explain the reason why the combination therapy in the earlier disease course had no additional benefit over MAC treatment alone, some speculations can be made. First, MAC may be potent enough to delay hemodynamic and histopathological progression when it is administered at an earlier stage of PAH, which may not be true at an advanced stage of the disease. This is partially supported by the results of the preliminary study (Supplementary Data 1), in where the survival rate in the MAC+SIL group was significantly better than that in the MAC group (Supplementary Figure 2A). Second, SIL may not be the most appropriate drug to combine with MAC at an earlier stage of PAH, given the beneficial effects of combination therapy with ambrisentan and tadalafil.24) As the authors of the AMBITION trial commented at the limitation section, the effects of the combination therapy can be different depending on the drugs used.24) Therefore, it is possible that SIL may not be the best combination with MAC. To further address this issue, future studies using a diverse combination of different types of PAH-targeted therapy in less advanced stages of PAH are needed.
Given the results of the current study and an earlier publication,5) an early diagnosis and the early establishment of PAH-targeted therapy are undoubtedly vital. Thus, it is important to identify and monitor patients at high risk for PAH development and to establish appropriate PAH-targeted therapy at the asymptomatic, subclinical or early stage of the disease. Here, we provide evidence that MAC-based therapy at an earlier stage of PAH exerts beneficial hemodynamic and histopathological effects. This strategy appears to be safe, as kidney and liver functions remained stable throughout the study period (Supplementary Figure 3). Therefore, MAC-based PAH treatment may be a particularly robust clinical option at an early stage of PAH.
A few limitations should be acknowledged. First, we did not demonstrate the exact molecular mechanisms underlying the benefits of MAC-based early treatment. Second, we did not provide potential explanations why the combination therapy with MAC and SIL was not effective to delay PAH progression. Until data on the best combination therapy are obtained, ambrisentan and tadalafil should be the first line combination therapy based on the AMBITION trial.24)
In conclusion, using a MCT-induced PAH rat model, the present study demonstrated that MAC-based early intervention in a less advanced stage of PAH can slow or delay the hemodynamic and histopathological deterioration of PAH with a good safety profile.
 XML Download