

 PDF
PDF ePub
ePub Citation
 Print
Print


INTRODUCTION
Breast cancer is the most common cancer in women worldwide, and it is also the most common cancer in Korean women [12]. Triple-negative breast cancer (TNBC) is defined as a breast cancer, which is negative for the expression of estrogen receptor, progesterone receptor (PR), and human epidermal growth factor-2 in immunohistochemical staining. TNBC accounts for about 10%-20% of all breast cancer cases and has a relatively poor prognosis compared to that of other breast cancer subtypes. The absence of targetable molecular markers and aggressive clinical behavior make the management and treatment of TNBC challenging for clinicians [345].
Angiogenesis is an important mechanism contributing to cancer growth, invasion, and metastasis [4]. It has traditionally been viewed as one of the targetable processes in cancer treatment, with the monoclonal antibody against vascular endothelial growth factor A (VEGF-A), bevacizumab, showing clinical benefit in case of non-small cell lung cancer and renal cell carcinoma [67]. In breast cancer, a combination of bevacizumab with chemotherapy resulted in an improvement in overall response rate and progression-free survival (PFS) [8]. Although there was no significant improvement in overall survival (OS), patients who received bevacizumab-containing regimens exhibited prolonged 1-year OS [9]. Additionally, a survival gain was also detected in patients with TNBC who received bevacizumab-containing chemotherapy as a second-line treatment [3]. These reports imply that in certain subpopulations of metastatic breast cancer, such as TNBC or rapidly progressing breast cancer, angiogenesis may play a crucial role in cancer progression, and targeting angiogenesis could be associated with clinical response and survival benefit in patients suffering from these conditions. However, there are no established predictive biomarkers to identify patients with tumors that exhibit a dependency on angiogenesis, and may therefore benefit from blocking angiogenesis.
The Notch pathway is a highly conserved regulatory signaling pathway which crosstalks with other oncogenic signaling pathways, such as the VEGF pathway, and is involved in cell proliferation and angiogenesis [10]. This pathway regulates angiogenesis during tumor proliferation and repair of ischemic damage [11]. The Notch pathway also induces neovascularization in pulmonary arterial endothelial cells (ECs)and human umbilical vein ECs [12]. Notch1 homozygous mutants cause severe defects in angiogenic vascular remodeling [13]. In tumor mouse models of colon cancer and lung carcinoma, inhibition of the Notch pathway induces defects in the formation of tumor vasculature, resulting in a reduction in tumor volume due to reduced blood flow to the tumor [14]. The upregulation of the Notch pathway in lung cancer is associated with increased tumor vascular density relative to that observed in the normal lung tissue [15]. The expression of Notch ligand, Dll4, is significantly increased in bladder cancer and is significantly correlated with that of vascular factors such as VEGF, CD34, and α-smooth muscle actin [16]. It has been demonstrated that the Notch pathway is involved in the regulation of EC proliferation, migration, and vascular development.
MicroRNAs (miRNAs) are non-coding small RNAs composed of 20–24 nucleotides that are known to regulate various oncogenes and tumor-suppressor genes. Among the various miRNAs, the miRNA-34a (miR-34a) acts as a tumor suppressor in TNBC, and has been linked to various signaling axes. It is known to regulate breast cancer cell proliferation, epithelial-mesenchymal transition, and tumor cell invasion [17]. Moreover, miR-34a targets the Notch1 signaling pathway and regulates cell proliferation, EC apoptosis, and angiogenesis in malignancies such as brain tumors [18] and osteosarcoma [19], and in benign conditions, such as during angiogenesis in the lung and in the formation of ECs in the cardiac microvasculature [20].
TNBC has high microvascular density (MVD) and anti-angiogenic treatments show more clinical benefit for patients with TNBC compared to that in patients with other breast cancer subtypes [4]. This finding suggests that there is a strong correlation between the survival and development of TNBC and angiogenesis than that between other breast cancer subtypes and angiogenesis. Both Notch1 and miR-34a are associated with cancer progression and angiogenesis, but little is known about their predictive or prognostic roles in malignancies, including in breast cancer. In this study, we analyzed Notch1 expression in the intra-tumoral ECs and miR-34a expression in whole tumor sections and studied their association with recurrence and survival of TNBC.
METHODS
Patients
From January 2009 to December 2014, the medical records of 114 patients who were diagnosed with TNBC in Seoul St. Mary's Hospital, The Catholic University of Korea were retrospectively reviewed. All patients underwent adequate surgical resection and received appropriate adjuvant chemotherapy based on their surgical stage. Patients who received neoadjuvant chemotherapy were excluded. Archival tumor tissues were reviewed by a senior pathologist to confirm the pathological parameters, including histological grading, histological subtype, and lymph node metastases; they also selected representative areas of the tumor tissue. This study was approved by the Institutional Review Board (IRB) of Seoul St. Mary's Hospital, Catholic University of Korea (IRB No. KC18SESI0010). The requirement for formal written informed consent was waived by the IRB. Investigations were carried out as per the rules of the Declaration of Helsinki of 1975, revised in 2013.
RNA extraction and quantitative real-time polymerase chain reaction (qRT-PCR)
The total RNA from each TNBC patient sample was extracted from 10 µm sections of formalin-fixed paraffin-embedded blocks using an RNA extraction kit (Ambion, Austin, USA) as per the manufacturer's protocols. For quality control, RNA purity and integrity were evaluated based on the absorbance ratios at 260/280 nm and 260/230 nm that were analyzed using a Nanodrop ND-1000 spectrophotometer (Thermo Fisher Scientific, Waltham, USA).
For miRNA expression analysis, 10 ng total RNA was used along with miR-34a-specific primers supplied with the miR-34a TaqMan miRNAAssay (Applied Biosystems, Foster City, USA). The complementary DNA was synthesized using a TaqMan miRNA Reverse Transcription kit (Applied Biosystems), and qRT-PCR analysis was performed on the LightCycler 96 system (Roche, Basel, Switzerland). The U6 small nuclear 6B (RNU6B) miRNA was used as an endogenous control. Each miRNA assay was performed in triplicate. The expression of miRNA has been reported as the delta Ct value 2−∆Ct (−∆Ct: Ct value of RNU6B – Ct value of miR-34a). The cutoff value of miR-34a was set at 0.90, which was the median expression value. We classified the tumors into miR-34a high or low based on the cutoff expression value of miR-34a.
Immunohistochemistry and pathologic analysis
All 114 pathological tissue specimens were formalin-fixed and stored as paraffin blocks in the Seoul St. Mary's Hospital, The Catholic University of Korea. Paraffin blocks were serially sectioned into 4 µm sections for immunohistochemical staining of CD34 and Notch1. The primary antibodies used were anti-CD34 mouse monoclonal antibody (clone QBEnd 10, 1:100 dilution; Dako, Glostrup, Denmark) and anti-Notch1 rabbit monoclonal antibody (clone D1E11, 1:50 dilution, CST, Danvers, USA). CD34 staining was performed using the DAKO Omnis automated immunohistochemistry system (Dako). For Notch1 staining, tissue sections were deparaffinized with xylene 3 times for 10 minutes and rehydrated using 100%, 95%, and 70% graded ethanol for 5 minutes each after incubation in an oven at 60°C for 1 hour. Antigen retrieval was carried out in a pressure cooker (Electric Pressure Cooker CPC-600; Cuisinart, East Windsor, USA) for 20 minutes using 1× citrate buffer (pH 6.0). The endogenous peroxide activity was blocked by methanol-diluted 3% hydrogen peroxide for 15 min. Sections were incubated with the primary antibody for 1 h at room temperature (22–25°C) in a humidified chamber. The immunoreaction signal was amplified and revealed using the Polink-2 HRP DAB Broad-2 Detection system kit (GBI, Mukilteo, USA). Subsequently, these sections were counterstained with Harris's hematoxylin (YD Diagnostics, Yongin, Korea). The Notch1 staining set included a positive control sample (human tonsil tissue).
For the measuring the microvessels, we counted the microvessels present in the tumor stroma or at the invasive front, and sections were screened in accordance with the method described by Weidner et al. [21]. To identify Notch1 positivity in microvessels the highest Notch1 positive neovascularization areas (hot spots) in the Notch1 immunostained slides were identified by scanning the entire slide (40×) and 3 images were taken at 200× magnification. In the CD34 immunostained slides, images of matched areas with Notch1 were also taken. With the hot spot images of Notch1 and matched images of CD34, Notch1 positive microvessels and CD34 positive microvessels were counted, respectively. We considered any brown-stained ECs or EC clusters that were clearly separable from adjacent microvessels, tumor cells, and other connective tissue elements as a single countable microvessel [21]. The average number of Notch1 positive microvessels within each Notch1 hot spot was considered as Notch1 positive MVD and that of CD34 positive microvessels within the matched area was considered CD34 MVD. The ratio of Notch1 positive MVD to CD34 MVD was defined as endothelial Notch1 (EC Notch1). The cutoff value of EC Notch1 was set at 0.15, which was the median expression value. EC Notch1 was classified into an EC Notch1 low and an EC Notch1 high group based on the cutoff value.
A pathologist (A.L) and a researcher (D.K.) who were experts in interpreting immunohistochemical staining, independently evaluated the immunohistochemical staining data in a blinded fashion.
Statistical analysis
All of the statistical analyses were performed using SPSS 24.0 software (SPSS Inc., New York, USA). The relationship between protein expression and clinicopathological features was analyzed by the χ2 test. Spearman correlation was used to analyze the interaction between prognostic factors. The Kaplan–Meier method was used to estimate the OS, disease-free survival (DFS), metastasis-free survival (MFS), and the differences were compared using the log-rank test. OS was defined starting from the date of diagnosis to the last follow-up date (or the patient's death). DFS was defined starting from the date of primary surgery to the date of cancer recurrence (local recurrence of distant recurrence or patient's death), supported by an imaging study such as chest or abdomen computed tomography scan. MFS was defined starting from the date of primary surgery to the date of distant recurrence (metastasis), supported by an imaging study or pathological confirmation. The prognostic factors were analyzed using the multivariate Cox regression method, including those that were statistically significant in the univariate analysis. Statistical significance was set at p < 0.05. The results were reported as odds ratios with 95% confidence intervals (CI).
RESULTS
Patient characteristics
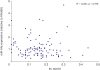
Between January 2009 and December 2014, 114 patients who were diagnosed with TNBC and underwent adequate surgical intervention, were enrolled for the study. Adequate archival surgical tissue samples were available for all the patients so that we could proceed for the pathological review. The baseline patient characteristics have been described in Table 1. The median follow-up time for all patients was 61 months (range, 0-161 months). The median age of the total patient population was 52 years. More than half of the patients (73 patients, 64.0%) had a tumor size > 2 cm, and 28.9% of the total patient population had lymph node metastases. Most of the patients (86.8%) were diagnosed with poorly differentiated carcinoma with histologic grade 3. The expression levels of miR-34a in the 114 TNBC samples are shown in Figure 1. The expression of miR-34a ranged from a minimum of 0.21 to a maximum of 4.69 (expressed as 2-ΔCt), and was classified into low and high based on a cutoff value of 0.90. Based on the cutoff value for miR-34a expression, 58 of the 114 patients (50.9%) were classified as being miR-34a low and 56 patients (49.1%) were classified as miR-34a high. The correlation between the expression of miR-34a and various clinicopathological variables in the 114 TNBC patients has been summarized in Table 1. The expression of miR-34a was significantly associated with histological grade (G1 and G2 vs. G3, p = 0.044) and Ki-67 levels (<20 vs. ≥20, p = 0.046). Other categories were not significantly associated with miR-34a expression.
Table 1
Association between EC Notch1 and miR-34a expression and clinicopathological characteristics in 114 patients with TNBC
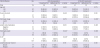
EC Notch1 = the ratio of Notch1 positive MVD to CD34 MVD; EC = endothelial cell; MVD = microvessel density; miR-34a = miRNA-34a; TNBC = triple-negative breast cancer.
*p < 0.05.
![]()
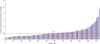 | Figure 1Quantitative real-time polymerase chain reaction analysis of miR-34a expression levels in 114 TNBC tissues. The relative miR-34a expression level (value of 2−∆Ct) in each sample was calculated based on a comparative Ct method with normalization to RNU6B RNA. Each data point represents the mean 2−∆Ct values from 3 independent assays.miR-34a = miRNA-34a; TNBC = triple-negative breast cancer; RNU6B = U6 small nuclear 6B.
|
Immunohistochemical staining for Notch1 and CD34 was performed on the 114 archival TNBC tissues (Figure 2). The expression levels of EC Notch1 in the 114 TNBC samples have been shown in Figure 3A. The expression of EC Notch1 ranged from a minimum of 0.00 to a maximum of 0.44, and was categorized into low and high based on a cutoff value of 0.15. Based on the cutoff value for EC Notch1 expression, 61 of the 114 patients (53.5%) were classified as EC Notch1 low and 56 patients (46.5%) were classified as EC Notch1 high (Figures 2 and 3B). The correlation between expression of EC Notch1 and various clinicopathological variables in the 114 TNBC patients has been summarized in Table 1. The expression of EC Notch1 was significantly associated with pathological stage (I and II vs. III, p = 0.029). Age and tumor size were well balanced regardless of EC Notch1 expression.
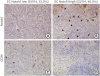 | Figure 2Immunohistochemical staining of CD34 and Notch1 in microvessels of TNBC tissues. Representative staining of Notch1 immunostaining (DAB substrate, brown) in (A) EC Notch1 low group and (B) EC Notch1 high group (original magnification ×200). Representative staining of CD34 immunostaining (DAB substrate, brown) in (C) EC Notch1 low group and (D) EC Notch1 high group (original magnification ×200). Arrowheads mark microvessels (Notch1-positive).TNBC = triple-negative breast cancer; DAB = diaminobenzidine; EC Notch1 = the ratio of Notch1 positive MVD to CD34 MVD; EC = endothelial cell; MVD = microvessel density.
|
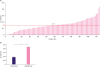 | Figure 3(A) The distribution of EC Notch1 and (B) expression level of EC Notch1 in 114 TNBC patients.EC Notch1 = the ratio of Notch1 positive MVD to CD34 MVD; EC = endothelial cell; MVD = microvessel density; TNBC = triple-negative breast cancer.
*p < 0.001.
|
The expression levels of Notch1, EC Notch1, and miR-34a in TNBC tissues were compared. No significant correlation was observed between Notch1 and miR-34a in the analysis (data not shown). Before the analysis, we hypothesized that there might be a direct association between the expression of miR-34a and EC Notch1 in the tumor tissue. However, no significant association between EC Notch1 and miR-34a expression was observed in the tumor sections (Figure 4).
Survival outcomes associated with expression of EC Notch1 and miR-34a
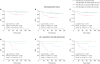
Patients with low expression of EC Notch1 (≤ 0.15) showed higher survival outcomes than those with high EC Notch1 (> 0.15) expression (Figure 5). Further, patients with low expression of EC Notch1 showed significantly longer OS (5-year survival rate [5y SR], 96.5%) than those with high expression of EC Notch1 (5y SR, 85.0%) (p = 0.041, Figure 5A). Moreover, patients with low EC Notch1 expression also exhibited longer DFS (5y SR, 88.1% vs. 78.2%, respectively; p = 0.09; Figure 5B) and MFS (5y SR, 93.2% vs. 84.0%, respectively; p = 0.063; Figure 5C), with a borderline statistical significance than those with high EC Notch1 expression.
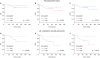 | Figure 5Association between EC Notch1 and survival outcomes in TNBC.(A) OS, (B) DFS, (C) MFS in patients with TNBC; based on EC Notch1 expression level. (D) OS, (E) DFS, (F) MFS in patients with locally advanced TNBC; based on EC Notch1 expression level.
EC Notch1 = the ratio of Notch1 positive MVD to CD34 MVD; EC = endothelial cell; MVD = microvessel density; TNBC = triple-negative breast cancer; OS = overall survival; DFS = disease-free survival; MFS = metastasis-free survival; LN = lymph node.
|
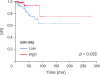
In patients with locally advanced tumors (positive for lymph node metastases), low EC Notch1 expression exhibited longer OS (5y SR, 93.3% vs. 65.5%, respectively, p=0.088; Figure 5D) with a borderline statistical significance than those with high EC Notch1 expression. Moreover, patients with low expression of EC Notch1 resulted in significantly higher survival benefit in terms of DFS (5y SR, 93.3% vs. 64.7%, respectively; p = 0.024; Figure 5E) and MFS (5y SR, 93.3% vs. 69.7%, respectively; p = 0.044; Figure 5F) than in those with high EC Notch1 expression. In patients with early-stage cancer (negative for lymph node metastasis), EC Notch1 expression was not significantly associated with survival outcomes (data not shown). In this analysis, patients with high expression of miR-34a showed higher survival benefit in terms of OS, DFS, and MFS compared to patients with low expression of miR-34a (Figure 6). In patients with total population, miR-34a expression was not significantly associated with survival outcomes (Figure 6A-C). On the other hand, In the case of patients with locally advanced TNBC, the miR-34a-high group showed a marginal benefit in terms of OS, DFS, and MFS (Figure 6D-F). However, no statistically significant association was observed between survival and miR-34a expression in patients with early stage TNBC (OS: 5y SR, 97.4% vs. 94.7%; p = 0.580, DFS: 5y SR, 87.1% vs. 84.5%; p = 0.772, and MFS: 5y SR, 94.9% vs. 89.5%; p = 0.409). For validation, we analyzed the association between the expression of miR-34a and patient prognosis using The Cancer Genomic Atlas (TCGA) data [22]. The miR-34a expression data were obtained from the Genomic Data Commons data portal (https://portal.gdc.cancer.gov/). The miR-34a expression was analyzed using the British Columbia Genome Sciences Centre profiling pipeline (https://github.com/bcgsc/mirna) and normalized count in reads-per-million-miRNA-mapped. The clinical data were gathered using the cgdsr R package. We analyzed 109 cases that were classified as the basal-like type by Prediction Analysis of Microarray 50 profiling. The miR-34a expression was grouped into miR-34a-high or miR-34a-low, based on the median expression value. In the TCGA database, high expression of miR-34a showed a statistically superior survival benefit in terms of DFS (p = 0.022, Figure 7) compared to that in patients with low miR-34a expression.
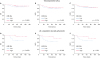 | Figure 6Association between miR-34a expression and survival outcomes in TNBC.(A) OS, (B) DFS, (C) MFS in patients with TNBC; based on miR-34a expression level. (D) OS, (E) DFS, (F) MFS in patients with locally advanced TNBC; based on miR-34a expression level.
miR-34a = miRNA-34a; TNBC = triple-negative breast cancer; OS = overall survival; DFS = disease-free survival; MFS = metastasis-free survival; LN = lymph node.
|
Combination of EC Notch1 and miR-34a, and their association with prognosis
We classified the 114 patients into the following 3 groups based on the expression levels of miR-34a and EC Notch1: group 1, miR-34a high and EC Notch1 low (n = 32); group 2, miR-34a high and EC Notch1 high or miR-34a low and EC Notch1 low (n = 55); and group 3, miR-34a low and EC Notch1 high (n = 27).
Combined expression of miR-34a and EC Notch1 was significantly associated with OS (p = 0.032) and DFS (p = 0.011) in the overall patient population (Figure 8A and B). The miR-34a high and EC Notch1 low group (green) showed statistically higher OS (5y SR, 96.8% vs. 79.6%, respectively; p = 0.036; Figure 8A) than that of the miR-34a low and EC Notch1 high group (red), but showed only a marginal benefit in terms of DFS (Figure 8B) and MFS (Figure 8C).
 | Figure 8Kaplan–Meier analysis of survival of patients with TNBC stratified according to the expression of miR-34a and EC Notch1.(A) OS, (B) DFS, (C) MFS in patients with TNBC; based on the expression of miR-34a and EC Notch. (D) OS, (E) DFS, (F) MFS in patients with locally advanced TNBC; based on the expression of miR-34a and EC Notch1.
TNBC = triple-negative breast cancer; miR-34a = miRNA-34a; EC Notch1 = the ratio of Notch1 positive MVD to CD34 MVD; EC = endothelial cell; MVD = microvessel density; OS = overall survival; DFS = disease-free survival; MFS = metastasis-free survival; LN = lymph node.
|
In patients with locally advanced TNBC, the miR-34a high and EC Notch1 low group showed significantly higher survival benefit in terms of OS (5y SR, 100% in miR-34a high and EC Notch1 low (group 1) vs. 84.9% in miR-34a high and EC Notch1 high or miR-34a low and EC Notch1 low (group 2) vs. 55.6% in miR-34a low and EC Notch1 high (group 3); p = 0.026; Figure 8D), DFS (5y SR, 100% vs. 86.7% vs. 44.4%, respectively; p = 0.009; Figure 8E), and MFS (5y SR, 100% vs. 86.7% vs. 51.9%, respectively; p = 0.038; Figure 8F) compared to the other patient groups. The miR-34a high and EC Notch1 low group (green) showed significantly higher OS (p = 0.037), DFS (p = 0.015), and MFS (p = 0.029) than the miR-34a low and EC Notch1 high group (red) (Figure 8D-8F). In our analysis, combining the expression levels of EC Notch1 and miR-34a in surgical tissue revealed their potential for predicting survival outcomes in patients with locally advanced TNBC. However, in patients with early stage TNBC, grouping of patients based on EC Notch1 and miR-34a expression did not reveal an association with OS, DFS, or MFS (data not shown).
In the overall patient population, the miR-34a low and EC Notch1 high group showed the worst survival outcomes when compared to the other 2 groups. The correlation between the groups and various clinicopathological parameters in the 114 TNBC patients has been summarized in Supplementary Table 1.
For further analysis of the relationship between the clinicopathological variables and survival outcome, a Cox regression analysis was performed. The miR-34a low and EC Notch1 high group (high-risk group) was associated with lower OS, DFS, and MFS than that of the other 2 groups (low-risk group) (for OS: hazard ratio [HR], 4.84; 95% CI, 1.29–18.06; p = 0.019, for DFS: HR, 3.57; 95% CI, 1.44–8.84; p = 0.006, for MFS: HR, 3.31; 95% CI, 1.10–9.98; p = 0.033). When adjusted for age and the lymph node metastases, the high-risk group still showed a significant association with reduced OS, DFS, and MFS (for OS: HR, 4.67; 95% CI, 1.22–17.85; p = 0.024, for DFS: HR, 3.88; 95% CI, 1.54–9.78; p = 0.004, for MFS: HR, 3.36; 95% CI, 1.07–10.50; p = 0.037) (Table 2).
Table 2
Univariate and multivariate analysis of survival outcomes
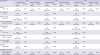
miR-34a = miRNA-34a; EC Notch1 = the ratio of Notch1 positive MVD to CD34 MVD; EC = endothelial cell; MVD = microvessel density; OS = overall survival; DFS = disease-free survival; MFS = matastasis-free survival; HR = hazard ratio; CI = confidence interval.
*p < 0.05; †MiR-34a high, EC Notch1 low (group1) & miR-34a low, EC notch1 high or miR-34a high, EC Notch1 high (group2); ‡MiR-34a low, EC Notch1 high (group3).
![]()
DISCUSSION
Angiogenesis is a key feature of cancer cell invasion and progression. Among all breast cancer types, TNBC is closely associated with angiogenesis [4], and combining anti-angiogenic agents with cytotoxic chemotherapy has shown relatively superior outcomes than conventional chemotherapy in a few clinical trials [3]. Various genes, miRNAs, and long noncoding RNAs (lncRNAs) have been suggested as being potential prognostic or therapeutic markers for breast cancer [23]. However, there are no validated biomarkers for selecting the individuals who will benefit most from anti-angiogenic treatment in breast cancer. In this study, we identified EC Notch1 and miR-34a as potential markers to predict the prognosis of TNBC, especially its locally advanced form. miR-34a is a tumor suppressor and is downregulated in the TNBC cell lines [17]. In breast cancer, miR-34a is directly linked to Notch1 expression, and is associated with tumor invasion, migration, and prognosis [5]. Notch1 is highly expressed in breast cancer, especially in the basal subtype [10]. Previous studies have reported that Notch1 expression in cancer cells is associated with a poor histological grade and reflects rapid progression and poor survival [24]. Inhibition of Notch1 expression in TNBC cell lines or patient-derived xenograft mouse models resulted in shrinkage of the tumor volume and a reduction in cancer stem cell proliferation [25]. VEGF increases the expression of Notch during vascular development under hypoxic conditions, leading the differentiation of endothelial progenitor cells into arterial cells [10]. Notch activation in ECs also induces endothelial senescence, leading to neointimal hyperplasia and tumor cell entry into the circulation [26]. Based on the previous reports, we focused our research on miR-34a and Notch1 as potential markers reflecting angiogenesis in during the development of breast cancer, and analyzed whether they may have a role in the prognosis of TNBC. Other than Notch1 expression in tumor cells, our study focused on Notch1 expression in the blood vessels (EC Notch1) because we hypothesized that micro-vascularization of the tumor may play a role in the development and progression of the tumor due to its paracrine nature.
In our study, low EC Notch1 expression was associated with better survival outcomes and early pathological stage of TNBC. Especially in case of locally advanced TNBC, patients with low EC Notch1 showed higher DFS and MFS compared to that in patients with early TNBC who showed a marginal association with higher OS. This result is concordant with a previous report on melanoma, which reported that low expression of EC activated Notch1 receptors is correlated with early-stage and better PFS [26]. Considering EC Notch1 staining was observed in peritumoral vasculature in whole tumor sections, high EC Notch1 may represent increased vessel formation in an advanced pathologic stage in our analysis. Although there are few reports describing the role of Notch1 in peritumoral vasculature, our report supports its role in peritumoral angiogenesis during tumorigenesis and progression of TNBC.
High expression of miR-34a in locally advanced TNBC showed slight benefit in terms of OS, DFS, and MFS. Although our database showed a small association between miR-34a and survival outcome, high expression of miR-34a was significantly associated with higher DFS in TCGA dataset. In a previous report, high circulating miR-34a in the blood was associated with improved survival outcomes in metastatic breast cancer [27]. Although our result showed only a small association with survival outcomes, previous reports and TCGA data showed conclusive results on the role of miR-34a as a prognostic factor. In our analysis, high miR-34a expression correlated with a low histologic grade. High miR-34a expression in tumor tissue is inversely related to factors such as Ki67 and PR expression [28], and circulating miR-34a is known to be associated with the histologic grade of breast cancer [27]. Regarding the role of miR-34a as a tumor suppressor in breast cancer, we assume depletion of miR-34a in breast cancer cells may influence aggressive tumor cell behavior.
Considering that miR-34a is a regulator of Notch1 in various tumors [20], we presumed a direct association between miR-34a and Notch1. However, a statistical correlation between these 2 markers was not observed. This result may be due to the complex interaction of miR-34a and Notch1 with their upstream or downstream regulators. As mentioned previously, miR-34a acts as a tumor suppressor by regulating various genes. Other than Notch1, miR-34a targets Twist-related protein 1, Zinc finger E-box-binding homeobox 1 and regulates cell-cycle arrest, senescence, and apoptosis besides angiogenesis [28]. Previous reports suggest that miR-34a acts as a key tumor suppressor regulating multiple tumor suppressor genes, but Youness et al. [23] reported that miR-34a was regulated by a higher tier regulator, sONE, which is a lncRNA acting as a tumor suppressor in TNBC. Upregulated sONE induced miR-34a expression, however, miR-34a was also regulated by other tumor-associated genes such as TP53 or c-Myc resulting in tumor cell viability, proliferation, migration, and invasion. These results suggest that miR-34a regulates various tumor suppressor genes and is in turn controlled by other upstream agents and genes related to tumor proliferation, resulting in a complex network involving miR-34a during tumor cell-cycle arrest, senescence, and apoptosis. Notch1 also has diverse roles during carcinogenesis and is regulated by various upstream regulators such as the miR-497-195 cluster and miR-200c, as well as miR-34a [29]. These complex interactions between lncRNAs, miRNAs, and various genes may explain the main results of our study.
Both miR-34a and EC Notch1 showed a high ability to predict the prognosis of TNBC but with modest power. We combined miR-34a and EC Notch1 as a new marker to form the miR-34a high and EC Notch1 low group; miR-34a low and EC Notch1 high group; and miR-34a high and EC Notch1 high or miR-34a low and EC Notch1 low group. In the total patient population, the miR-34a high and EC Notch1 low group showed superior OS compared to other patients, but there was no significant association with DFS or MFS. In the locally advanced TNBC group, the miR-34a high and EC Notch1 low group showed the best OS, DFS, and MFS when compared to other patients. The miR-34a low and EC Notch1 high patients showed the worst survival outcomes among the 3 patient groups. In addition, the miR-34a low and EC Notch1 high group (high-risk group) was associated with inferior OS, DFS, and MFS in a multivariate analysis. When combined, miR-34a and EC Notch1 showed a powerful ability to estimate the survival outcome in TNBC, especially in locally advanced patients.
In our study, we defined EC Notch1 as a novel marker for use in estimating the prognosis of TNBC, and we combined miR-34a and EC Notch1 as a prognostic marker in locally advanced TNBC patients. In TNBC, angiogenesis has a major role in tumor initiation, progression, and metastasis. Targeting angiogenesis with anti-angiogenic agents such as bevacizumab in TNBC has shown some clinical benefit but with modest activity. To enhance the effect of anti-angiogenesis agents during the treatment of TNBC, various efforts are being made. Trials combining bevacizumab with other agents such as anti-programmed death ligand 1 agents or cytotoxic chemotherapies are ongoing [30]. Other than novel combination strategies, a biomarker-based selection of patients who might respond to anti-angiogenetic treatment can be considered. We primarily focused on the role of EC Notch1 and miR-34a expression as a prognostic marker in locally advanced TNBC. Given that miR-34a and Notch1 have key roles in breast cancer development and progression involving angiogenesis [17], we hypothesized that patient subgroups with high expression of angiogenesis-associated biomarkers might benefit from anti-angiogenic treatment such as bevacizumab. Based on this result, we are planning to carry out follow-up studies to establish the role of EC Notch1 and miR-34a as potential biomarkers to predict the effect of anti-angiogenic treatment in TNBC.
There are some limitations in our study. In this study, we enrolled stage I, II, and III TNBC patients for the analysis. Although the subtype for analysis was homogeneous, the patient population is relatively small, requires careful interpretation. Second, we did not demonstrate an inverse relationship between miR-34a and EC Notch1 expression. Although other reports have proven an inverse relationship between miR-34a and Notch1 [1820], there was no statistical association in our analysis. This may be due to the different approach taken to quantifying Notch1 expression. Previous reports have focused on Notch1 expression in tumor cells, but we focused on Notch1 expression in stromal and peritumoral vasculature. This difference in approach may have influenced the study outcome. Furthermore, the relatively small sample size of the patient population may also have affected our results. This study has clinical value in defining a new marker, defined as EC Notch1, which represents Notch1 expression in stromal and peritumoral ECs. Previous Notch1 studies have focused on its expression and function only on tumor cells, but our study sheds a different light on the stromal and peritumoral vasculature, represented by EC Notch1.
In conclusion, EC Notch1 and miR-34a, which are associated with tumor angiogenesis, may be associated with prognosis in locally advanced TNBC patients. Till now, most clinical trials with anti-angiogenic agents in breast cancer have showed modest results. However, certain subgroup of patients such as TNBC benefited from anti-angiogenic treatment during the trial. Therefore, developing biomarkers to select subgroups who will benefit from anti-angiogenic treatment is important. Based on this study, we suggest that EC Notch1 and miR-34a might act as potential biomarkers for selecting patients who may benefit from anti-angiogenic treatment. Further study is warranted to verify the role of EC Notch1 and miR-34a in angiogenesis during cancer development and treatment.
 XML Download