

 PDF
PDF ePub
ePub Citation
 Print
Print


INTRODUCTION
Breast cancer is cancer originating from breast tissue and is one of the world's most commonly diagnosed cancers [1]. Public health data indicate that the global burden of breast cancer in women is increasing and the number of breast cancer cases diagnosed are also increasing every year [2]. In China, breast cancer is the 6th leading cause of cancer-related death in women and it is expected that the number of cases will reach 2.5 million by 2021. Breast cancer not only threatens women's physical and mental health, and causes a huge economic burden [3]. Therefore, it is important to understand breast cancer development and search for potential therapeutic targets.
Glucose is an important carbon source for energy-producing metabolic processes. Cancer cells are characterized by glucose metabolism that involves increased glucose uptake and aerobic glycolysis. Glycolysis is the process of converting glucose into pyruvate, which eventually results in the production of lactate (fermentation). Enhanced glycolysis is a striking feature of breast cancer and other cancers as the cancer cells rely on the glycolytic pathway for their energy needs. This characteristic has been successfully exploited for cancer diagnosis and tumor response assessment [4]. Besides providing cellular energy, the metabolic intermediates of glycolysis also play an essential role in macromolecular biosynthesis, which benefits the cancer cells under conditions of diminished nutrient supply. Recently, it was reported that tumor glycolysis could be used as a potential target for cancer therapy as interrupting/disrupting tumor glycolysis would impact tumor growth by energy depletion and sensitization to therapeutics [56].
Long non-coding RNAs (lncRNAs) are a class of RNA molecules that are longer than 200 nucleotides in length but are not translated to proteins. LncRNAs have been known to regulate gene expression at the transcriptional and post-transcriptional levels. Several lncRNAs have been demonstrated to be critical in cancer development and/or maintenance [7]. The regulation of glycolysis by lncRNAs in cancer cells has also been described [8]. The c-myc oncogene is a master regulator linked to most types of cancers and controls many aspects including cellular growth and metabolism [9]. The transcriptional regulation of lncRNAs by c-Myc has been shown through genome-wide studies. Conversely, lncRNAs could also regulate c-Myc expression at both transcriptional and post-transcriptional level. Therefore, understanding the lncRNA-c-Myc network in cancer could provide useful information to target lncRNAs for cancer treatment [7].
MicroRNAs (miRNAs) are small non-coding RNAs consisting of about 22 nucleotides [10]. MiRNAs regulate gene expression by complementing with the 3′ untranslated region of their target messenger RNAs (mRNAs), which leads to degradation of the target mRNA. Multiple studies have revealed that miRNAs tightly regulate metabolic pathways in cancer cells. MiRNAs regulate the expression of not only glucose uptake receptors but also the enzymes involved in glycolysis [11].
In the current study, the roles of lncRNA- small nucleolar RNA host gene 7 (SNHG7) was investigated in breast cancer. The effects of lncRNA-SNHG7 on glycolysis in breast cancer cell line were also evaluated and the underlying mechanisms were further explored.
METHODS
Cell culture
Normal breast epithelial cells MCF10A and breast cancer cell lines MDA-MMB-436, HS578T, SKBR3, MDA-MB-231, and MCF-7 were purchased from the Shanghai Cell Bank of the Chinese Academy of Science. MCF10A cells were maintained in Dulbecco's Modified Eagle Medium (DMEM)/F12 medium supplemented with 5% horse serum, epidermal growth factor (20 ng/mL), insulin (10 µg/mL), hydrocortisone (0.5 mg/mL), cholera toxin (100 ng/mL), and penicillin (100 U/mL) and streptomycin (100 µg/mL) (Thermo Fisher, Waltham, USA). MDA-MMB-436, HS578T, MDA-MB-231, and MCF-7 were cultured in Roswell Park Memorial Institute 1640 medium containing 10% fetal bovine serum (FBS, Life Technology, Pleasanton, USA), 2mM L-glutamine, 20 mM HEPES, 1 mM sodium pyruvate, 100 U/mL penicillin, and 100 μg/mL streptomycin medium supplemented with 2 mM glutamine and 15% FBS. HS578T cells were cultured in DMEM medium supplemented with 10% FBS, 0.01 mg/mL bovine insulin and 100 U/mL penicillin, and 100 μg/mL streptomycin (Thermo Fisher). Cells were cultured in a 5% saturated CO2 atmosphere at 37°C.
Tissue preparation
A total of 30 paired breast tissues samples (lumA/B, n = 19; basal-like, n = 6; human epidermal growth factor receptor 2 [HER-2], n = 3; normal-like, n = 2) were collected from patients by surgical resection. The diagnosis of breast cancer was confirmed by histopathological evaluation. A total of 50 biologically independent samples (lumA/B, n = 25; basal-like, n = 10; HER-2, n = 9; normal-like, n = 6) were used in correlation analyses conducted between c-Myc and lncRNA-SNHG7 in breast cancers. The use and conduct of all the human materials were approved by the Institutional Review Board (IRB) in the Second Hospital of Hebei Medical University (IRB No. SHHBYU-085-JC1). All participants signed the informed written consent.
The atlas of non-coding RNA in cancer (TANRIC) analysis
We analyzed a total of 837 patients, including 138 stage I, 480 stage II, 180 stage III, 15 stage IV, 15 stage Tis, and 9 stage X patients. These patient samples had been evaluated for histologic characteristics and immunostained for estrogen receptor, HER2/neu, epidermal growth factor receptor, cytokeratin 5/6, p53, and Ki-67. The clinical subtypes of these 837 patients included lumA/B (n = 417+191), basal-like (n = 139), HER-2 (n = 67), normal-like (n = 23).
Subcellular fraction
MCF-7 cells were harvested and washed with phosphate-buffered saline. After centrifugation, the cell pellets were subjected to fractionation using the Subcellular Protein Fractionation Kit for Cultured Cells (Thermo Fisher) following the manufacture's protocol. The cytoplasmic and nuclear fractions were subjected to RNA extraction or western blot. Poly (ADP-ribose) polymerase (PARP) and β-actin were used as markers for cytoplasm and nucleus in western blot and U1 were used as a marker in real-time polymerase chain reaction (RT-PCR).
Lentivirus transduction and cell transfection
Lentivirus expressing control short hairpin RNA (shRNA) or lncRNA-SNHG7 shRNA, and lentivirus expressing lncRNA-SNHG7 (pCDH-lncRNA-SNHG7) or empty vector (pCDH), miR-34a-5p mimics, miR-34a-5p inhibitors, and control miRNAs were purchased from RiboBio (Guangzhou, China). MCF-7 cells or MDA-MB-231 cells were seeded in 24-well or 96-well plates and transduced with lentivirus. The cells were harvested for analysis 48 hours post transduction. In some experiments, MCF-7 cells were transfected with miR-34a-5p mimics or inhibitors using Lipofectamine 2000 (Thermo Fisher) following the manufacturer's protocol and then transduced with lentivirus immediately. Cells were harvested for analysis 48 hours post transfection/transduction.
Cell Counting Kit-8 (CCK-8) assay
The CCK-8 assay was used to monitor cell viability. Briefly, MCF-7 cells were seeded in a 96-well plate and transduced with the lentivirus. At 48 hours post transduction, the CCK-8 reagent was added at a final concentration of 100 µL/mL medium (Sigma Aldrich, St Louis, USA) and the cells were incubated for 2 hours. The absorbance was read at 450 nm using BioTek™ PowerWave™ Microplate Spectrophotometer (Thermo Fisher).
Lactate production assay
MCF-7 cells transduced with lentivirus expressing control shRNA or lncRNA-SNHG7 shRNA were cultured for 24 hours. The lactate levels in the culture medium were determined using the Lactate Assay Kit (Colorimetric; Abcam, Cambridge, USA) according to manufacturer's instructions.
Extracellular acidification rate (ECAR)
The ECAR was measured in MCF-7 cells following lentiviral transduction and/or miRNA transfection using the Seahorse XF96e analyzer (Seahorse Bioscience, North Billerica, USA) according to the manufacture's instruction. Briefly, MCF-7 cells were seeded in a 96-well XF cell culture microplate with complete growth medium following lentiviral transduction and/or miRNA transfection. ECAR was measured using an XF96 analyzer in XF base medium containing 4 mM glutamine following sequential addition of 10 µM glucose, 1 µM oligomycin and 50 mM 2-DG. Data were analyzed by a Seahorse XF Glycolysis Stress Test Report Generator.
Biotin pull down assay
For antisense oligomer affinity pull down assay, biotin-labeled sense or antisense DNA oligomers corresponding to lncRNA-SNHG7 (RiboBio) were incubated with MCF-7 cell lysate in DNase/RNase free conditions. After incubation for 1 hour, streptavidin-coupled agarose beads (Thermo Fisher) were added to isolate the RNA-RNA complexes. The lncRNA-SNHG7 and miR-34a-5p levels were analyzed by quantitative RT-PCR (qRT-PCR).
qRT-PCR
Total RNA was extracted from tissues, and the MCF-7 and MDA-MB-231 cells using Trizol reagent (Thermo Fisher) following manufacturer's instructions. The RNA was reverse transcribed into complementary DNA by using PrimeScript RT reagent kit (Takara, Dalian, China). SYBR Green RT-PCR Master Mix was used for qPCR assay which was performed on an ABI 7500 RT-PCR system (Thermo Fisher). U6 was used as the internal control for normalization of the relative miRNA expression. All primers used for RT-PCR were purchased from Qiagen (Germantown, USA).
Western blotting
Total proteins were extracted from MCF-7 and MDA-MB-231 cells using M-PER™ Mammalian Protein Extraction Reagent (Thermo Fisher), and protein concentration was measured by using Pierce BCA Protein Assay Kit (Thermo Fisher). A total of 20 µg of protein was loaded onto a sodium dodecyl sulfate (SDS) polyacrylamide gel electrophoresis gel and later transferred to polyvinylidene fluoride membrane. Following transfer, the membranes were blocked with 5% non-fat milk in 0.1% tween-20 in tris buffered saline (TBST) for 1 hour at room temperature. Then primary antibodies were added and the membranes were incubated at 4°C overnight. Next day, after 3 washes with TBST, the membranes were incubated with horseradish peroxidase-conjugated corresponding secondary antibodies at room temperature for 1 hour. Immunoreactive proteins were detected using Clarity™ Western ECL Blotting Substrates (Bio-Rad, Hercules, USA). The density was quantitated and analyzed using ImageJ. Primary antibodies used in the current study were: anti-HK2 (Thermo Fisher), anti-GPI (Thermo Fisher), anti-PFKL (Thermo Fisher), anti-ALDB (Thermo Fisher), anti-TPI1 (Sigma Aldrich), anti-PGK1 (Thermo Fisher), anti-PGAM1 (Sigma Aldrich), anti-ENO1 (Sigma Aldrich), anti-PKM2 (Sigma Aldrich), anti-lactate dehydrogenase A (LDHA; Thermo Fisher), anti-glyceraldehyde 3-phosphate dehydrogenase (GAPDH; Thermo Fisher), and anti-β actin (Sigma Aldrich).
Immunoprecipitation (IP)-semiquantitative PCR
IP-PCR was performed following a modified protocol as described previously [12]. Briefly, MCF-7 cells were lysed in hypotonic buffer (10 mM HEPES [pH 7.6], 1.5 mM MgCl2, 10 mM KCl, and 0.2 mM phenylmethylsulfonyl fluoride) containing 0.5% NP40 and supplemented with RNase A inhibitor and DNase I. The cell lysates were precleared with protein A/G beads (Sigma Aldrich) and then incubated with protein A/G beads coated with the indicated antibodies for 3 hours at 4°C. Then beads were washed 3 times with wash buffer (10 mM Tris [pH 7.6], 100 mM KCl, 5 mM MgCl2, and 1 mM dithiothreitol) and eluted using elution buffer (50 mM Tris [pH 8.0], 1% SDS, and 10 mM EDTA) at 65°C for 10 minutes. To isolate protein-associated DNA from the eluted immunocomplexes, the samples were treated with proteinase K at 37°C for 30 min, followed by 2 rounds each of phenol-chloroform-isoamyl alcohol (25:24:1) and chloroform extraction, and then precipitated with ethanol. The purified DNA was subjected to PCR analysis. Primers used for PCR were: lncRNA-SNHG7: Forward: 5′-CTAGGACGTCTGCTCACTGG-3′, Reverse: 5′-CAGGAGGGCTTAGTTACATTGGA-3′. GAPDH: Forward: 5′-TACTAGCGGTTTTACGG GCG-3′, Reverse: 5′-TCGAACAGGAGGAGCAGAGAGCGA-3′.
Luciferase reporter assay
To determine the effect of c-Myc on lncRNA-SNHG7 promoter, MCF-7 cells and MDA-MB-231 cells were transduced with lentivirus expressing control shRNA or c-Myc shRNA (RiboBio), and co-transfected with the PGL3-WT lncRNA-SNHG7 promoter or mutant constructs and Renilla luciferase reporter plasmid. The firefly and Renilla luciferase activities were measured using a Dual-luciferase reporter assay system (Promega, Madison, USA) 24 hours post transduction/transfection.
Statistical analysis
Data are presented as mean ± standard deviation and analyzed using GraphPad Prism 8 software (GraphPad Software, San Diego, USA). Student's t-test, 1- or 2-way analysis of variance with Bonferroni post hoc test was used for analysis. The difference was considered as significant when p < 0.05.
RESULTS
Increased level of lncRNA-SNHG7 was detected in breast cancer tissue and cell lines
To investigate the potential role of lncRNA-SNHG7 in breast cancer, we monitored the level of lncRNA-SNHG7 in breast cancer tissues. As shown in Figure 1A, we detected significantly increased level of lncRNA-SNHG7 in tumor tissues when compared to normal breast tissue. In addition [13], we analyzed a total 837 patients cases by TANRIC and found that increased level of lncRNA-SNHG7 was correlated with decreased patient survival (Figure 1B). Next, we monitored the level of lncRNA-SNHG7 in several breast cancer cell lines including MDA-MMB-436, HS578T, MDA-MB-231, MCF-7, and HS578T. As shown in Figure 1C, compared to normal breast epithelial cells, all the breast cancer cell lines had significantly higher level of lncRNA-SNHG7, which is consistent with the results from patient tissues. We monitored the expression pattern of lncRNA-SNHG7 by cell fractionation. The quality of the fractions was confirmed by western blotting. As expected we detected the nuclear marker, PARP, mainly in the nuclear fractions and β-actin was detected only in the cytoplasmic fraction (Figure 1D). RT-PCR analysis of fractionated nuclear and cytoplasmic RNA revealed that lncRNA-SNHG7 localized mainly in the cell cytosol while the small nuclear RNA U1 localized only in nucleus and β-actin mRNA mainly localized in cell cytosol (Figure 1E). Taken together, our data demonstrated that lncRNA-SNHG7 was up-regulated in breast cancer and mainly localized in cell cytosol.
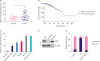 | Figure 1Elevated expression of lncRNA-SNHG7 in breast cancer. (A) qRT-PCR for the abundance of lncRNA-SNHG7 in 30 pairs of breast cancer samples. (B) The correlation between overall survival and lncRNA-SNHG7 level in breast cancer obtained by TANRIC. (C) qRT-PCR for the abundance of lncRNA-SNHG7 in normal breast cells and various breast cancer cell lines. (D) Western-blot analysis for PARP and β-actin in the nuclear and cytoplasmic fractions, respectively, in MCF-7 cells. Data shown represent 3 independent experiments. (E) Nuclear and cytoplasmic fractions of MCF-7 cells were subjected to qRT-PCR analysis.Data were presented as mean ± standard deviation.
lncRNA = long non-coding RNA; qRT-PCR = quantitative real-time polymerase chain reaction; PARP = poly (ADP-ribose) polymerase.
*p < 0.05, †p < 0.01, ‡p < 0.001.
|
LncRNA-SNHG7 promoted proliferation of breast cancer cells
To evaluate the effect of lncRNA-SNHG7 on cell proliferation of MCF-7 cells, we transduced MCF-7 cells with lentivirus expressing shRNA against lncRNA-SNHG7 or lentivirus expressing control shRNA. Transduction of lentivirus expressing shRNA against lncRNA-SNHG7 significantly decreased the endogenous level of lncRNA-SNHG7 (Figure 2A). Correspondingly, the total cell number in MCF-7 cells transduced with lentiviruses expressing lncRNA-SNHG7 shRNA1 or shRNA2 was lower than the total cell number in MCF-7 cells transduced with lentivirus expressing control shRNA, and the difference became significant on day 5 (Figure 2B). In addition, MCF-7 cell transduced with lentiviruses expressing lncRNA-SNHG7 shRNA1 or shRNA2 had significantly decreased cell viability compared to MCF-7 cells transduced with lentivirus expressing control shRNA (Figure 2C). Transduction of MCF-7 cells with lentivirus expressing lncRNA-SNHG7 resulted in significantly higher lncRNA-SNHG7 level (Figure 2D) compared to the non-transduced cells or cells transduced with the control lentivirus. The overexpression of lncRNA-SNHG7 resulted in higher cell number and the difference was significant on day 5 post lentiviral transduction (Figure 2E), which was due to the significantly increased cell viability of MCF-7 cells overexpressing lncRNA-SNHG7 (Figure 2F). Similar results were obtained using MDA-MB-231 cells (Supplementary Figure 1). Taken together, our data demonstrated that lncRNA-SNHG7 promoted breast cancer cell proliferation.
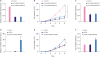 | Figure 2LncRNA-SNHG7 promotes proliferation of breast cancer cells. (A, B) MCF-7 cells were transduced with sh-ctrl or sh-lncRNA-SNHG7 lentivirus. LncRNA-SNHG7 level was assessed by qRT-PCR, and then cells were subjected to cell proliferation analysis. (C) MCF-7 cells were transduced with sh-ctrl or sh-lncRNA-SNHG7 lentivirus and then subjected to cell viability assays. (D, E) MCF-7 cells were transduced with pCDH or pCDH-lncRNA-SNHG7 lentivirus. LncRNA-SNHG7 level was assessed by qRT-PCR, and then the cells were subjected to cell proliferation analysis. (F) MCF-7 cells were transduced with pCDH or pCDH-lncRNA-SNHG7 lentivirus, and then subjected to cell viability assays.Data were presented as mean ± standard deviation.
lncRNA = long non-coding RNA; qRT-PCR = quantitative real-time polymerase chain reaction; sh = short hairpin.
*p < 0.05, †p < 0.01.
|
Knockdown of lncRNA-SNHG7 inhibited glycolysis in breast cancer cells
Next, we investigated the functional role of lncRNA-SNHG7 in glycolysis in MCF-7 cells. We observed acidification of the culture medium of MCF-7 cells. In contrast, knocking down lncRNA-SNHG7 by transducing lentivirus expressing lncRNA-SNHG7 shRNA1 or shRNA2 in MCF-7 cells prevented the acidification of culture medium (Figure 3A). We also detected significantly decreased lactate production in MCF-7 cells transduced with lentivirus expressing lncRNA-SNHG7 shRNA1 or shRNA2, when compared to MCF-7 cells transduced with lentivirus expressing control shRNA (Figure 3B). Knocking down lncRNA-SNHG7 also significantly decreased cell glycolysis assessed by the ECAR (Figure 3C and D). As knocking down lncRNA-SNHG7 affected glycolysis, we next investigated which of the glycolysis enzymes were affected by the knockdown. Using western blotting and RT-PCR, we identified that knocking down lncRNA-SNHG7 did not affect the protein and mRNA levels of most glycolysis enzymes including HK2, GPI, PFKL, ALDB, TPI1, PGK1, PGAM1, ENO1, and PKM2 (Figure 3E and F). In contrast, we detected significantly decreased protein and mRNA levels of LDHA in MCF-7 cells transduced with lentivirus expressing lncRNA-SNHG7 shRNA1 or shRNA2 (Figure 3E and F), suggesting that lncRNA-SNHG7 regulated the expression of LDHA. Similar results were obtained using MDA-MB-231 cells (Supplementary Figure 2). Collectively, we demonstrated that lncRNA-SNHG7 regulated LDHA expression and glycolysis.
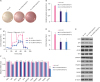 | Figure 3Knocking down lncRNA-SNHG7 inhibits glycolysis in breast cancer cells. (A) MCF-7 cells expressing either control shRNA or lncRNA-SNHG7 shRNA were cultured for 24 hours. Acidification of the culture medium was evaluated by visually inspecting the color of the medium. (B) MCF-7 cells expressing either control shRNA or lncRNA-SNHG7 shRNA were cultured for 24 hours. Levels of lactate in the culture medium were then measured and normalized to cell number. (C, D) ECAR was measured in MCF-7 cells expressing either control shRNA or lncRNA-SNHG7 shRNA by Seahorse XF assays. (E, F) Western blotting and qRT-PCR analysis of glycolysis enzymes in MCF-7 cells expressing either control shRNA or lncRNA-SNHG7 shRNA.Data were presented as mean ± standard deviation.
lncRNA = long non-coding RNA; sh = short hairpin; ECAR = extracellular acidification rate; qRT-PCR = quantitative real-time polymerase chain reaction.
*p < 0.01.
|
LncRNA-SNHG7 regulated LDHA level by targeting miR-34a-5p
Next, we investigated the mechanism of lncRNA-SNHG7 regulated LDHA expression. LncRNAs have been shown to function as miRNA sponges. LncRNA-SNHG7 was identified to binding to miR-34a (Figure 4A), which has been described previously [14]. To confirm the interaction between lncRNA-SNHG7 and miR-34a, we performed the pull-down assay. We found that a biotin-labeled antisense DNA probe of lncRNA-SNHG7 enriched the endogenous lncRNA-SNHG7 while the sense DNA probe did not (Figure 4B). In addition, lncRNA-SNHG7 antisense DNA probe was able to pull down miR-34a-5p (Figure 4B). These results indicated that lncRNA-SNHG7 interacted with miR-34a-5p. To test whether the regulation of LDHA by lncRNA-SNHG7 depended on miRNA. LncRNA-SNHG7 shRNA lentivirus transduced-MCF-7 cells were transfected with miR-34a-5p inhibitors and the LDHA protein level was monitored. As shown in Figure 4C, the expression of lncRNA-SNHG7 shRNA resulted in decreased LDHA expression. In contrast, overexpression of miR-34a-5p inhibitor in MCF-7 cells expressing lncRNA-SNHG7 shRNA rescued the expression of LDHA. Overexpression of lncRNA-SNHG7 resulted in up-regulation of LDHA expression while this upregulation was inhibited by overexpression of miR-34a-5p (Figure 4D). Therefore, these results indicated that lncRNA-SNHG7 regulated LDHA expression through miR-34a-5p. Knocking down lncRNA-SNHG7 resulted in decreased cell glycolysis as measured by ECAR. In contrast, overexpressing miR-34a-5p inhibitor rescued the decreased cell glycolysis mediated by lncRNA-SNHG7 knockdown (Figure 4E and F). Taken together, our data demonstrated that lncRNA-SNHG7 targeted miR-34a-5p and regulated LDHA expression and glycolysis.
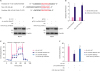 | Figure 4LncRNA-SNHG7 acts as a target of miR-34a-5p to increase LDHA level. (A) Illustration of the base pairing between miR-34a-5p and lncRNA-SNHG7. The base pairing between miR-34a-5p and LDHA 3′UTR is also shown. (B) Lysates from MCF-7 cells were incubated with in vitro-synthesized biotin-labeled sense or antisense DNA probes against lncRNA-SNHG7 for biotin pull-down assay, followed by qRT-PCR analysis to examine miR-34a-5p and lncRNA-SNHG7 level. (C) MCF-7 were transduced with sh-ctrl or sh-lncRNA-SNHG7 lentivirus followed by miR-34a-5p inhibitor or negative control transfection. Western blot analysis of LDHA and β-actin. (D) MCF-7 were transduced with pCDH or pCDH-lncRNA-SNHG7 lentivirus followed by miR-34a-5p mimics or negative control transfection. Western blot analysis of LDHA and β-actin. (E, F) MCF-7 cells were transduced with sh-ctrl or sh-lncRNA-SNHG7 lentivirus followed by miR-34a-5p inhibitor or negative control transfection. ECAR was measured by Seahorse XF assays.Data were presented as mean ± standard deviation.
lncRNA = long non-coding RNA; sh = short hairpin; ECAR = extracellular acidification rate; qRT-PCR = quantitative real-time polymerase chain reaction; ns = not significant; LDHA = lactate dehydrogenase A; 3′UTR = 3′ untranslated region.
*p < 0.01.
|
LncRNA-SNHG7 is a direct transcriptional target of c-Myc
Next, we investigated whether c-Myc regulated lncRNA-SNHG7 expression as it has been previously reported that the promoter of SNHG7 was strongly bound by endogenous c-Myc [15]. Transduction of lentivirus expressing c-myc shRNA significantly decreased endogenous lncRNA-SNHG7 level and c-Myc expression in both MCF-7 cells and MDA-MB-231 cells (Figure 5A). In contrast, transduction of lentivirus expressing c-myc significantly increased lncRNA-SNHG7 level and c-Myc expression in MCF-7 cells and MDA-MB-231 cells (Figure 5B). These results indicated that c-Myc positively regulated lncRNA-SNHG7 expression. We further evaluated whether the promoter of lncRNA-SNHG7 conferred c-Myc dependent transcriptional activity. DNA fragments of lncRNA-SNHG7 promoter containing a predicted wild-type or mutant c-Myc binding region were inserted into the promoter region of a luciferase reporter plasmid pGL3 (Figure 5C). As was expected, significantly increased luciferase activity was only obtained in MCF-7 cells that were transfected with luciferase reporter plasmid containing the wild type lncRNA-SNHG7 promoter but not the mutant promoter. Knocking down c-Myc by lentiviral transduction significantly decreased the luciferase activity (Figure 5D). Overexpression of c-Myc by lentivirus transduction significantly increased the luciferase activity in MCF-7 cell transfected with reporter plasmid containing wild type promoter (Figure 5E). These results indicated that c-Myc could regulate transcription through lncRNA-SNHG7 promoter. The binding of c-Myc to lncRNA-SNHG7 promoter was further verified by ChIP assay. As shown in Figure 5F, anti-c-Myc antibody successfully pulled down the chromatin fragments containing the lncRNA-SNHG7 promoter. Correspondingly, we detected a positive correlation between lncRNA-SNHG7 expression and c-Myc expression. Taken together, our data demonstrated that c-Myc positively regulated lncRNA-SNHG7 expression.
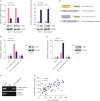 | Figure 5LncRNA-SNHG7 is a direct transcriptional target of c-Myc. (A, B) MCF-7 and MDA-MB-231 cells were transduced with sh-ctrl or sh-c-Myc lentivirus, pCDH or pCDH-c-Myc lentivirus. Western blot analysis of c-Myc and β-actin. LncRNA-SNHG7 level was assessed by quantitative RT-PCR. (C) Schematic illustration of the consensus c-Myc binding sites in lncRNA-SNHG7 gene promoter. The wild-type and mutant binding sites are shown in the open boxes. The corresponding pGL3-based luciferase reporter constructs generated are shown. (D, E) MCF-7 were transduced with sh-ctrl or sh-c-Myc lentivirus, pCDH or pCDH-c-Myc lentivirus followed by transfection with the indicated pGL3-based luciferase reporter constructs. The reporter activity was measured 24 hours post-transfection, and plotted after normalizing with the Renilla luciferase activity. Western blot analysis of c-Myc and β-actin. (F) MCF-7 cells lysates were analyzed by ChIP assay using anti-c-Myc or IgG rabbit antibody. The ChIP products were amplified by semi-quantitative RT-PCR. (G) Correlation analyses conducted between c-Myc and lncRNA-SNHG7 in breast cancers (n = 50 biologically independent samples). Pearson correlation coefficients (r) and p-values.Data were presented as mean ± standard deviation.
lncRNA = long non-coding RNA; sh = short hairpin; RT-PCR = real-time polymerase chain reaction; NS = not significant; GAPDH = glyceraldehyde 3-phosphate dehydrogenase; IgG = immunoglobulin G.
*p < 0.05, † p < 0.01.
|
DISCUSSION
In the current study, we found that lncRNA-SNHG7 was significantly up-regulated in breast cancer tissues and higher level of lncRNA-SNHG7 was associated with decreased survival in patients. In addition, increased levels of lncRNA-SNHG7 were detected in 5 breast cancer cell lines. These findings suggest a potential role for lncRNA-SNHG7 in breast cancer development and maintenance.
We further explored the potential function of lncRNA-SNHG7 in breast cancer. As we detected higher levels of lncRNA-SNHG7 in breast cancer cell lines compared to normal breast cells, we sought to determine whether lncRNA-SNHG7 expression affected the cell viability of breast cancer cells. By knocking down lncRNA-SNHG7 using lentivirus expressing lncRNA-SNHG7 shRNA in MCF-7 cells, we found decreased cell viability and cell numbers. In contrast, overexpressing lncRNA-SNHG7 resulted in increased cell viability and cell numbers. These results revealed that lncRNA-SNHG7 promoted cell proliferation. Several studies on lncRNA-SNHG7 have also revealed the effects of lncRNA-SNHG7 on cell proliferation. For example, She and colleagues reported that lncRNA-SNHG7 promoted the proliferation, migration and invasion, and inhibited apoptosis of lung cancer cell by increasing expression of Fas apoptotic inhibitory molecule 2 [16].
LncRNAs are transcribed RNAs that regulate gene expression by base-pairing with DNA or RNA in a sequence-specific manner [17]. LncRNAs can act as miRNA sponges and reduce their regulatory effects on mRNAs [18]. In the current study, we identified that lncRNA-SNHG7 targeted miR-34a-5p. The interaction between lncRNA-SNHG7 and miR-34a has been described previously. Li and colleagues reported a negative correlation between SNHG7 and miR-34a in colorectal cancer [14]. In addition, SNHG7 facilitated the proliferation and metastasis by regulating GALNT7 expression by sponging miR-34a in CRC cell lines. Interestingly, miR-34a has been reported as a tumor suppressor in multiple types of cancer and is down-regulated in cancers [19]. MiR-34a has been found to inhibit self-renewal and invasion of cancer stem cells (CSCs), and promote the sensitivity of CSCs to chemo- and radiotherapy [2021]. In breast cancer, overexpression of miR-34a significantly increased the sensitivity of adriamycin-resistant MCF-7 cells to adriamycin by directly inhibiting the target Notch 1 [22]. Besides Notch 1, miR-34a has been reported to regulate a variety of target mRNAs including the hepatocyte growth factor receptor, MET, the pro-oncoproteins, Myc and N-Myc, and various cyclins and cyclin-dependent kinases, that results in the inhibition of cell proliferation, migration, invasion, and tumor suppression [232425].
One principal biochemical characteristic of cancer cells is a metabolic switch from oxidative phosphorylation to increased glycolysis [26]. LDHA catalyzes the conversion of pyruvate to lactate and is considered as a key checkpoint in anaerobic glycolysis. In the current study, we demonstrated that SNHG7 regulated glycolysis in MCF-7 and MDA-MB-231 cells. Knocking down SNHG7 inhibited lactate production and glycolysis. We further identified that knocking down SNHG7 down-regulated the LDHA expression, suggesting that SNHG7 positively regulated LDHA expression. Interestingly, we also demonstrated that the knocking down SNHG7 down-regulated LDHA expression and glycolysis through miR-34a, as inhibiting miR-34a prevented this effect. The regulation of glucose metabolism and tumor growth by miR-34a-LDHA axis in breast cancer has been described previously. Xiao et al. [27] reported that LDHA was a direct target of miR-34a and that miR-34a negatively regulated LDHA in MCF-7 cells. LDHA promoted glycolysis and cell proliferation while LDHA-induced glycolysis and cell proliferation was inhibited by miR-34a. In the current study, we also demonstrated that SNHG7 knockdown mediated inhibition of LDHA expression and glycolysis was prevented by inhibition of miR-34a. Therefore, we have, for the first time, described the regulation of glycolysis by SNHG7/miR-34a/LDHA axis.
C-Myc belongs to the Myc family, which is an important oncoprotein that contributes to cancer. As a transcriptional factor, c-Myc is critical for cell proliferation, apoptosis, metabolism, and several other cellular processes [28]. C-Myc has also been shown to influence the expression of lncRNA transcripts. For example, c-Myc could directly bind to the promoter region of lncRNA CCAT1 and promote its transcription, resulting in cell proliferation and invasion of colon cancer cells [29]. Wang et al. [30] reported that SNHG12 was a direct transcriptional target of c-Myc and promoted cell migration by regulating MMP13 expression. In the current study, we demonstrated that c-Myc bound to the promoter of SNHG7 and promoted SNHG7 promoter-mediated transcription of luciferase. In addition, we detected a positive correlation between SNHG7 and c-Myc expression, which indicated that c-Myc positively regulated SNHG7 expression and indirectly regulated glycolysis in breast cancer cells.
In summary, we demonstrated that c-Myc regulated the lncRNA-SNHG7 expression. SNHG7 up-regulated LDHA expression by targeting miR-34a-5p and resulted in the regulation of glycolysis in breast cancer cells.
Our findings suggested that c-Myc regulated glycolysis through the lncRNA-SNHG7/miR34a-5p/LDHA axis.
 XML Download