Journal List > Ann Lab Med > v.40(3) > 1139611

Ahn, Park, Cho, Jang, Seo, Lee, Yoon, and Suh: Clinical, Laboratory, and Bone Marrow Findings of 31 Patients With Waldenström Macroglobulinemia

Abstract

Background

Waldenström macroglobulinemia (WM) is a subset of lymphoplasmacytic lymphoma (LPL) with bone marrow (BM) involvement and an IgM monoclonal gammopathy of any level. We aimed to identify the clinical, laboratory, and BM findings of patients with WM and to evaluate the usefulness of CD154 for the diagnosis and prognosis of WM.

Methods

We reviewed the medical records and BM studies and/or flow cytometric immunotyping of 31 patients with untreated WM. Semiquantitative immunohistochemistry (CD20, CD138, tryptase, and CD154) of BM was performed.

Results

Only six patients presented with symptoms of hyperviscosity syndrome. Eleven patients had solid cancer and/or another hematologic malignancy. Mast cells (MC) increased in all samples, with some in close contact with tumor cells. Tryptase-positive MC (17.1/ high-power fields [HPF], 1.2–72.0/HPF) and CD154-positive MC (8.6/HPF, 0.1–31.1/HPF) were observed. The high CD154-positive MC (≥8.6/HPF) group showed a lower overall five-year survival rate than the low CD154-positive MC (<8.6/HPF) group (71.9% vs. 100.0%; P=0.012). Flow cytometric immunophenotyping of BM aspirates showed increased B lymphocytes and plasma cells with a normal phenotype (CD138+/CD38+/CD19+/CD45+/CD56).

Conclusions

Approximately one third of WM patients showed other malignancies and all patients had increased MC. Immunohistochemistry and flow cytometric immunophenotyping are useful for diagnosing WM, and increased CD154-positive MC can indicate poor prognosis.

INTRODUCTION

Waldenström macroglobulinemia (WM) is a subset of lymphoplasmacytic lymphoma (LPL), with bone marrow (BM) involvement and an IgM monoclonal gammopathy of any level [1]. LPL consists predominantly of small lymphocytes admixed with variable numbers of plasma cells, plasmacytoid lymphocytes, and often increased mast cells (MC), usually involving the BM and sometimes the lymph nodes and spleen; these do not fulfil the criteria for any other small B-cell lymphoid neoplasms that may also have plasmacytic differentiation [2]. However, the distinction between LPL and some of the other small B-cell neoplasms with plasmacytic differentiation, especially some marginal zone lymphomas, is not always clear [3]. In addition, the symptoms of WM are highly variable, which sometimes delays diagnosis [4]. WM is an indolent B-cell neoplasm, and most patients are asymptomatic or present with only anemia and monoclonal gammopathy [1].
BM MC have been reported in WM patients with increasing frequency [5]. This association could be a diagnostic feature of WM. Moreover, MC could be potential therapeutic targets in WM [6]. CD154 (CD40 ligand), a member of the tumor necrosis factor (TNF) superfamily, has been reported to be expressed on “activated MC” as a potent inducer of malignant B-cell growth [7].
Recently, several studies have reported the clinical and molecular findings of WM [189]; however, the BM characteristics of WM have not been extensively analyzed. This is the first study to analyze the BM characteristics of WM and the prognostic significance of CD154-positive MC. We report the clinical, laboratory, and BM findings of 31 Korean patients with WM and the usefulness of CD154 for the diagnosis and prognosis of WM.

METHODS

Study objectives and patients

We retrospectively reviewed the medical records of all 31 patients with histopathologically confirmed WM at Asan Medical Center, Seoul, Korea, from 1998 to 2017. This study was exempt from the approval of the Institutional Review Board.
Clinical information, including symptoms at diagnosis and the presence of other malignancies, was assessed. Patients were classified into three risk categories according to the International Prognostic Scoring System (IPSS) for WM at diagnosis [10]. Using the combination of age >65 years, Hb ≤115 g/L, platelet count ≤109/L, β-2-microglobulin >3 mg/L, and M-protein >70 g/L, the low-risk group was defined as the presence of ≤1 adverse characteristic, except age, and the high-risk group as the presence of >2 adverse characteristics; the remaining patients with two adverse characteristics or age >65 years were defined as intermediate risk. Chromosomal studies of 31 patients were reviewed. The karyotypes were defined according to the International System for Human Cytogenetic Nomenclature 2016; the rearrangements were regarded as clonal if at least two cells carried the same translocation or showed gain or deletion of a chromosome [11]. Plasma cell myeloma FISH (IGH-FGFR3 rearrangement, IGH-CCND1 rearrangement, IGH-MAF rearrangement, IGH rearrangement, 13q deletion, and TP53 deletion) was reviewed for 10 patients.
Lymphadenopathy was defined as lymph node enlargement (>1.0 cm short diameter, confirmed by computed tomography and/or sonography). Splenomegaly was defined as spleen enlargement (>12.0 cm, confirmed by abdominal computed tomography and/or sonography). Hepatomegaly was defined as liver enlargement (>3.0 cm below the costal margin, confirmed by sonography).
Ten newly diagnosed lymphoma patients without BM involvement (normal controls) were enrolled in this study. The control subjects included age-matched patients whose BM was examined for staging work-up of non-Hodgkin's lymphoma and proved to be normal without evidence of lymphoma involvement.

BM study, immunohistochemistry (IHC) staining, and flow cytometric immunophenotyping

The BM study included peripheral blood smears, BM aspirates, touch prints, clot sections, biopsy sections, and IHC of CD20, CD138, CD154, tryptase, and the κ and λ light chains. Wright-stained BM aspirates and hematoxylin and eosin-stained clots and biopsy section slides were reviewed by two hematopathologists for each patient. A differential count on BM aspirates was obtained by counting 500 nucleated cells. Semiquantitation of IHC-positive cells in the BM biopsies or clot sections was performed independently by two hematopathologists using one of the two methods: the proportion of immunoreactive cells among all nucleated cells [12] or simple direct counting in 10 high-power fields (HPF, ×400) and calculating the average per HPF [13]. IHC staining of CD20 (mouse monoclonal anti-human CD20 antibody; NovoCastra, Newcastle upon Tyne, UK), CD138 (mouse monoclonal anti-human CD138 antibody; DakoCytomation, Glostrup, Denmark), CD154 (rabbit polyclonal anti-human CD154 antibody; Santa Cruz Biotechnology, Heidelberg, Germany), tryptase (mouse monoclonal anti-human mast cell tryptase antibody; DakoCytomation), the κ light chain (rabbit polyclonal anti-human kappa light chain antibody; DakoCytomation), and λ light chain (rabbit polyclonal anti-human lambda light chain antibody; DakoCytomation) was performed for paraffin-embedded BM biopsies or clot sections using an automated IHC staining system (Ventana Benchmark XT; Ventana Medical Systems, Tucson, AZ, USA).
The patients were grouped into high and low groups based on the median values of CD20-positive (37.0%), CD138-positive (5.0%), tryptase-positive (17.1/HPF), and CD154-positive (8.6/HPF) cells.
In 15 patients, 5 color flow cytometric immunophenotyping (CD56/CD19/CD45/CD138/CD38) of BM aspirates was performed using a FACSCanto II flow cytometer (Becton Dickinson, San Jose, CA, USA).

Statistical analysis

The BM cellular components and cellularity data were reported as median (range) and compared using the Kruskal-Wallis test and Mann-Whitney test. Correlation between CD20-, CD138-, CD154-, and tryptase-positive cells and BM cellular components was analyzed using Spearman's rank correlation coefficient. Overall survival was calculated using Kaplan-Meier survival curves from diagnosis to death. Patients still alive at the time of study design were censored from the survival analysis. The overall survival rates according to chromosomal abnormalities, presence of TP53 deletion, and percentage of CD154-positive MC were compared using the log-rank test. P<0.05 was considered statistically significant. SPSS version 24.0 (SPSS, Chicago, IL, USA) was used for all statistical analyses.

RESULTS

Patient characteristics and clinical and laboratory findings

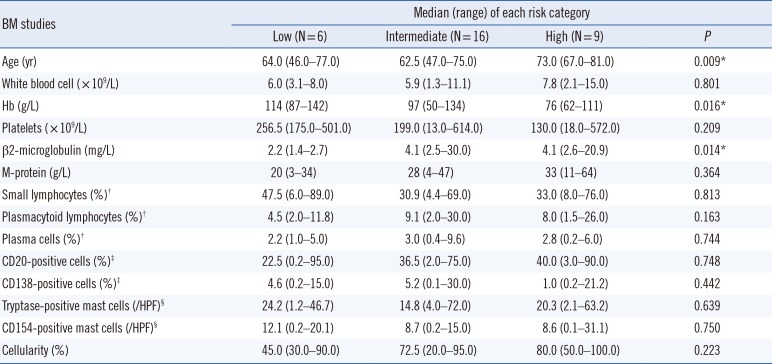
The median patient age was 66.0 (range, 46–81) years. Only six patients (19.4%) presented with symptoms of hyperviscosity syndrome, including visual disturbance, headache, focal neurological deficits, peripheral neuropathies, and renal impairment (Fig. 1). The patients were categorized into low-risk (N=6), intermediate-risk (N=16), and high-risk (N=9) groups based on the IPSS. Age, Hb, and β-2-microglobulin showed statistically significant differences between the risk categories. Patients in the high-risk group were significantly older than those in the low-risk and intermediate-risk groups (P=0.026 and P=0.003, respectively). However, age did not significantly differ between the low-risk and intermediate-risk groups (P=0.858) (Table 1).
Eleven patients (35.5%) had solid cancer and/or another hematologic malignancy early gastric carcinoma (N=2), glottis cancer (N=1), non-small cell lung cancer (N=1), myelodysplastic syndrome with multilineage dysplasia (N=1), primary amyloidosis (N=1), extranodal marginal zone lymphoma of mucosa-associated lymphoid tissue (N=1), diffuse large B-cell lymphoma (DLBCL, N=2), and both metastatic advanced gastric cancer and DLBCL (N=2).
Five patients (16.1%) had chromosomal abnormalities including complex karyotype (N=2), del(20) (N=1), del(7) (N=1), and both del(6) and del(5) (N=1). Abnormal clones were identified in 20.0% (2/10) of patients who underwent plasma cell myeloma FISH: TP53 plus 13q deletion in the complex karyotype and TP53 deletion in the normal karyotype, respectively.

BM findings, IHC, and flow cytometric immunophenotyping

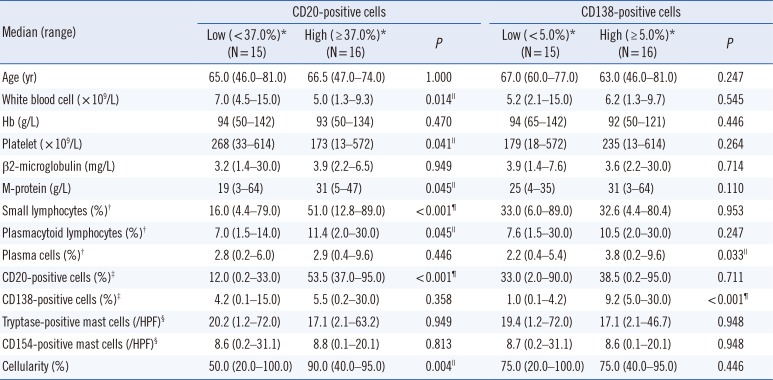
The BM-infiltrating lymphoid cells comprised small lymphocytes (median 33.0%, range 4.4–89.0%), plasmacytoid lymphocytes (8.0%, 1.5–30.0%), and plasma cells (2.8%, 0.2–9.6%; Fig. 2A). All WM patients had increased MC compared with BM normal controls (31/31, 100.0%); the mean±SD was 21.9±18.3/HPF vs. 0.49±0.41/HPF [13], with some MC located in close contact with tumor cells. The median of BM cellularity was 75% (20–100%) and BM infiltration patterns were interstitial (51.6%, N=16), peritrabecular combined with others (29.0%, N=9), and nodular (19.4%, N=6).
Small lymphocytes and plasmacytoid lymphocytes were positive for CD20, and plasma cells were positive for CD138 (Fig. 2B) with κ (84%, N=26) or λ (16%, N=5) clonality (Fig. 2C). The percentage of CD20-positive cells showed weak to moderate correlation with the percentage of small lymphocytes and plasmacytoid lymphocytes (r=0.665, P<0.001 and r=0.440, P=0.013, respectively). The percentage of CD138-positive cells showed weak to moderate correlation with the percentage of plasma cells and plasmacytoid lymphocytes (r=0.645, P<0.001 and r=0.467, P=0.008, respectively). The M-protein level weakly correlated with the percentage of CD20-positive cells and CD138-positive cells (r=0.359, P=0.048 and r=0.367, P=0.042, respectively). BM cellularity showed weak to moderate correlation with the percentage of small lymphocytes, CD20-positive cells, and M-protein level (r=0.358, P=0.048; r=0.593 P<0.001; and r=0.449, P=0.011, respectively).
Plasmacytoid lymphocytes, CD20-positive cells, and cellularity were higher in the intermediate and high-risk groups than in the low-risk group (Table 1). The percentage of small lymphocytes, plasmacytoid lymphocytes, M-protein level, and cellularity were higher in the high CD20-positive cell group than in the low CD20-positive cell group (P<0.001, P=0.045, P=0.045, and P=0.004, respectively). On the other hand, the percentage of plasma cells was higher in the high CD138-positive cell group than in the low CD138-positive cell group (P=0.033) (Table 2).
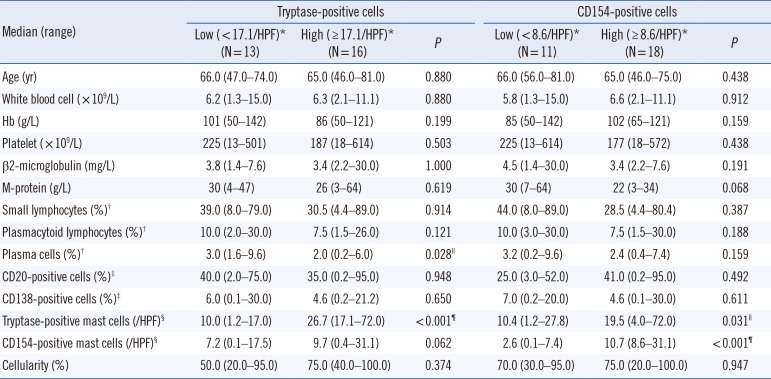
Tryptase-positive MC (17.1/HPF, 1.2–72.0/HPF) and CD154-positive MC (8.6/HPF, 0.1–31.1/HPF) were observed (Fig. 2D). The tryptase positivity weakly correlated with the CD154 positivity (r=0.406, P=0.029). No significant differences were observed in any laboratory and BM findings according to the tryptase-and CD154-positive cell counts, except for plasma cells. The percentage of plasma cells was lower in the high tryptase- and CD154-positive cell group than in the low tryptase- and CD154-positive cell group (P=0.028 and P=0.159, respectively) (Table 3).
Flow cytometric immunophenotyping with BM aspirates showed increased plasma cells with normal phenotype (CD138+/ CD38+/CD19+/CD45+/CD56).

Overall survival

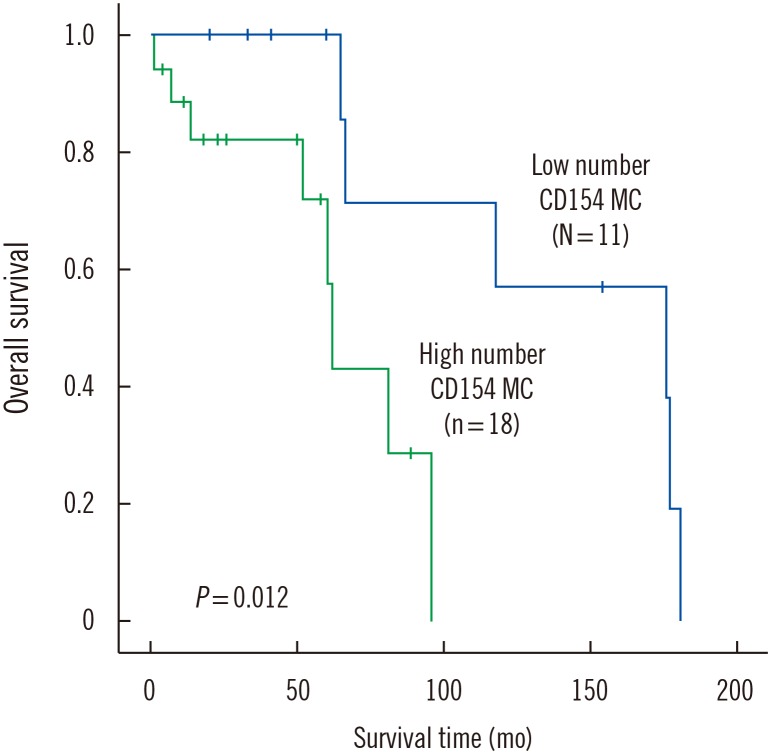
The median (25th–75th percentiles) follow-up duration was 58.0 (23.0−92.5) months. There were 17 deaths in our study population, and two patients were lost to follow-up. The five-year survival rate of the low CD154-positive MC group was 100.0%, and that of the high CD154-positive MC group was 71.9%. The high CD154-positive MC group showed a lower overall survival rate than the low CD154-positive MC group (P=0.012) (Fig. 3).
There was no significant difference in overall survival between the three risk groups or between groups with and without solid cancer and/or other hematologic malignancies.
The five-year survival rate of the chromosomal abnormalities group (N=5) was 60.0% and that of the normal karyotype group (N=26) was 89.6%. However, there was no significant difference in overall survival between the two groups (P=0.137). Although the number was small, patients with a TP53 deletion in FISH (N=2) had a worse prognosis compared with patients without the TP53 deletion (N=8) (P=0.046). The median overall survival of patients with and without the TP53 deletion was 2.5 and 51.0 months, respectively.

DISCUSSION

Most patients in our study had no specific symptoms of WM but showed abnormal laboratory findings such as rouleaux formation, reversal of albumin:globulin ratio, anemia, and monoclonal gammopathy. They were thought to have plasma cell myeloma. Although WM is a lymphoma, most cases involve the BM, and some cases involve the lymph nodes and other extranodal sites [2]. In our study, only four patients were diagnosed as having WM through a lymph node biopsy, and BM involvement of WM was confirmed via a subsequent BM study; the remaining 27 patients were diagnosed as having WM through BM examination.
WM is known to increase the risk of several associated cancers, and patients with WM are at increased risk of DLBCL, myelodysplastic syndrome/acute myeloid leukemia, and brain cancers, compared with the general population [14]. In this study, 11 patients (35.5%) had solid cancer and/or another hematologic malignancy; among them, four (12.9%) had DLBCL.
As life expectancy increases, the diagnostic rate of WM increases. According to Klodzinska, et al. [4], the diagnostic methods used for patients with WM are very diverse. Although many patients are primarily diagnosed as having WM through BM examination, there is only limited data on BM findings [4]. Our BM findings, including various cellular components, were summarized, verified by IHC, and evaluated for their usefulness.
A few studies have reported that CD138 expression correlated with serum IgM levels in WM patients [15]; however, no correlation has been reported between CD20 expression and M-protein level. In our study, M-protein level weakly correlated with the percentage of CD20-positive cells and CD138-positive cells (r=0.359, P=0.048 and r=0.367, P=0.042, respectively). However, M-protein level did not correlate with any other cell types such as small lymphocytes, plasmacytoid lymphocytes, or plasma cells.
While the increased clonal plasma cells of plasma cell myeloma cause monoclonal gammopathy, WM CD20- and CD138-positive cells weakly correlated with monoclonal gammopathy (r=0.359, P=0.048 and r=0.367, P=0.042, respectively). The increased plasma cells in WM do not express the aberrant immunophenotypes seen in plasma cell myeloma [16]. The close relationship of monoclonal B cells and plasma cells suggests a potential for immunoglobulin production by non-Hodgkin lymphoma cells [171819]. Future studies should determine which specific WM cells (small lymphocytes, plasmacytoid lymphocytes, or plasma cells) secrete M-protein and thereby cause monoclonal gammopathy [20].
In our study, the percentage of CD138-positive cells was significantly higher than that of plasma cells (median value 5.0% vs. 2.8%; P=0.007). This indicates that the CD138-positive cells include lymphoid cells other than plasma cells. CD138 expression helps distinguish WM from other non-Hodgkin lymphomas [2122]. Some of these CD138-positive cells do not have the morphological appearance of plasma cells [15]. Clonal plasmacytic differentiation of non-Hodgkin lymphoma seems to contribute to CD138 positivity, supporting our finding that the percentage of CD138-positive cells correlated with both plasma cells and plasmacytoid lymphoid cells (P<0.001 and P=0.008, respectively).
The BM microenvironment plays a key role in WM pathogenesis. The signaling of WM cell migration in the BM is partly regulated by the CXC chemokine stromal cell-derived factor 1 (SDF-1, also known as CXCL-12) produced by multiple BM stromal cell types [23] and the CXCR4 receptor on WM cells [24]. In one study, MC showed a positive correlation with SDF-1-positive cells [13]. Hence, we hypothesize that MC are involved in the interaction between WM cells and SDF-1. MC have been reported to be associated with LPL in WM patients [24]. In addition to WM, increased numbers of MC have also been reported in other B-cell disorders including chronic lymphocytic leukemia and Hodgkin disease [2526272829]. The role of MC in supporting tumor growth was suggested more than a century ago, and recent evidence has implicated MC in supporting angiogenesis in solid tumor growth [3031]. The expression of CD154, a member of the TNF superfamily, has been reported on activated MC in anaphylaxis [3233]. The role of CD154 as a potent inducer of both normal and malignant B- and plasma cell growth has been described [7].
In our study, the increased number of activated, CD154-positive MC was associated with poor WM prognosis. This has not been previously reported. CD154-positive MC had prognostic significance, but tryptase-positive MC did not. A portion of tryptase-positive MC is positive for CD154, because CD154 is expressed in only activated MC [7]. Generally, WM patients have an indolent disease course and are often of an advanced age; nearly a half of all patients die from diseases of the elderly, unrelated to WM [10]. Although IPSS is used for evaluating the prognosis and risk stratification of WM patients, no independent prognostic factor has yet been established.
One study showed that the blockade of CD154/CD40 signaling partially inhibits MC-induced proliferation of WM [7]. The study demonstrated that MC may support tumor cell expansion in WM through constitutive CD154-CD40 signaling; therefore, this may provide a framework for therapeutic targeting of MC in WM.
In conclusion, approximately one-third of WM patients showed other malignancies, IgM κ monoclonal gammopathy was predominant in patients with WM, and all patients with WM had increased MC, which were confirmed by tryptase IHC. Patients with high CD154-positive MC, which are activated MC, showed poor prognosis. BM examination, including IHC and flow cytometric immunophenotyping, is useful for diagnosing WM, and increased CD154-positive MC can indicate poor prognosis.

Notes

AUTHOR CONTRIBUTIONS:

  • Conception and design of study: Ari Ahn, Chan-Jeoung Park.

  • Data acquisition, analysis, and interpretation: Ari Ahn, Chan-Jeoung Park, Young-Uk Cho, Seongsoo Jang, Eul-Ju Seo, Jung-Hee Lee, Dok Hyun Yoon, Cheol Won Suh.

  • Final approval of manuscript: Ari Ahn, Chan-Jeoung Park, Young-Uk Cho, Seongsoo Jang, Eul-Ju Seo, Jung-Hee Lee, Dok Hyun Yoon, Cheol Won Suh.

CONFLICTS OF INTEREST: None declared.

RESEARCH FUNDING: None declared.

References

1. Naderi N, Yang DT. Lymphoplasmacytic lymphoma and Waldenström macroglobulinemia. Arch Pathol Lab Med. 2013; 137:580–585. PMID: 23544948.
2. Swerdlow SH, Campo E, editors. WHO classification of tumours of haematopoietic and lymphoid tissues. 4ed. Lyon: IARC;2017. p. 232–235.
3. Arcaini L, Varettoni M, Boveri E, Orlandi E, Rattotti S, Zibellini S, et al. Distinctive clinical and histological features of Waldenström's macroglobulinemia and splenic marginal zone lymphoma. Clin Lymphoma Myeloma Leuk. 2011; 11:103–105. PMID: 21454204.
4. Klodzinska S, Vos JM, Kersten MJ, Wijermans P, Minnema MC. A survey on diagnostic methods and treatment strategies used in patients with Waldenström's macroglobulinaemia in the Netherlands. Neth J Med. 2013; 71:90–96. PMID: 23462060.
5. Tabata R, Yasumizu R, Tabata C, Kojima M. Bone marrow macrophages in Waldenström's macroglobulinemia: a report of four cases. J Clin Exp Hematop. 2014; 54:103–110. PMID: 25318942.
6. Santos DD, Hatjiharissi E, Tournilhac O, Chemaly MZ, Leleu X, Xu L, et al. CD52 is expressed on human mast cells and is a potential therapeutic target in Waldenström's macroglobulinemia and mast cell disorders. Clin Lymphoma Myeloma. 2006; 6:478–483. PMID: 16796779.
7. Tournilhac O, Santos DD, Xu L, Kutok J, Tai YT, Le Gouill S, et al. Mast cells in Waldenstrom's macroglobulinemia support lymphoplasmacytic cell growth through CD154/CD40 signaling. Ann Oncol. 2006; 17:1275–1282. PMID: 16788002.
8. Treon SP. XIII. Waldenström's macroglobulinaemia: an indolent B-cell lymphoma with distinct molecular and clinical features. Hematol Oncol. 2013; 31 Suppl 1:76–80. PMID: 23775655.
9. D'Souza A, Ansell S, Reeder C, Gertz MA. Waldenström macroglobulinaemia: the key questions. Br J Haematol. 2013; 162:295–303. PMID: 23651417.
10. Gertz MA. Waldenström macroglobulinemia: 2017 update on diagnosis, risk stratification, and management. Am J Hematol. 2017; 92:209–217. PMID: 28094456.
11. McGowan-Jordan J. ISCN 2016: An International System for Human Cytogenomic Nomenclature (2016): recommendations of the International Standing Committee on Human Cytogenomic Nomenclature including new sequence-based cytogenetic nomenclature developed in collaboration with the Human Genome Variation Society (HGVS) sequence variant description working group. Karger;2016.
12. O'Donnell LR, Alder SL, Balis UJ, Perkins SL, Kjeldsberg CR. Immunohistochemical reference ranges for B lymphocytes in bone marrow biopsy paraffin sections. Am J Clin Pathol. 1995; 104:517–523. PMID: 7572811.
13. Park M, Park CJ, Cho YW, Jang S, Lee JH, Lee JH, et al. Alterations in the bone marrow microenvironment may elicit defective hematopoiesis: a comparison of aplastic anemia, chronic myeloid leukemia, and normal bone marrow. Exp Hematol. 2017; 45:56–63. PMID: 27693387.
14. Morra E, Varettoni M, Tedeschi A, Arcaini L, Ricci F, Pascutto C, et al. Associated cancers in Waldenström macroglobulinemia: clues for common genetic predisposition. Clin Lymphoma Myeloma Leuk. 2013; 13:700–703. PMID: 24070824.
15. Kyrtsonis MC, Levidou G, Korkolopoulou P, Koulieris E, Bartzi V, Maltezas D, et al. CD138 expression helps distinguishing Waldenström's macroglobulinemia (WM) from splenic marginal zone lymphoma (SMZL). Clin Lymphoma Myeloma Leuk. 2011; 11:99–102. PMID: 21454203.
16. Seegmiller AC, Xu Y, McKenna RW, Karandikar NJ. Immunophenotypic differentiation between neoplastic plasma cells in mature B-cell lymphoma vs plasma cell myeloma. Am J Clin Pathol. 2007; 127:176–181. PMID: 17210522.
17. Yamasaki S, Matsushita H, Tanimura S, Nakatani T, Hara S, Endo Y, et al. B-cell lymphoma of mucosa-associated lymphoid tissue of the thymus: a report of two cases with a background of Sjögren's syndrome and monoclonal gammopathy. Hum Pathol. 1998; 29:1021–1024. PMID: 9744322.
18. Tursi A, Modeo ME. Monoclonal gammopathy of undetermined significance predisposing to Helicobacter pylori-related gastric mucosa-associated lymphoid tissue lymphoma. J Clin Gastroenterol. 2002; 34:147–149. PMID: 11782609.
19. Tirelli A, Guastafierro S, Cava B, Lucivero G. Triclonal gammopathy in an extranodal non-Hodgkin lymphoma patient. Am J Hematol. 2003; 73:273–275. PMID: 12879432.
20. Kim HJ, Hur M, Kim H, Moon HW, Yun YM, Kim SY, et al. A rare case of Waldenström macroglobulinemia/lymphoplasmacytic lymphoma with light chain discrepancy between B lymphocyte population and serum paraprotein. Ann Clin Lab Sci. 2015; 45:593–597. PMID: 26586715.
21. Owen RG, Barrans SL, Richards SJ, O'Connor SJ, Child JA, Parapia LA, et al. Waldenström macroglobulinemia. Development of diagnostic criteria and identification of prognostic factors. Am J Clin Pathol. 2001; 116:420–428. PMID: 11554171.
22. Liu EB, Zhang PH, Li ZQ, Sun Q, Yang QY, Fang LH, et al. Clinicopathologic features of lymphoplasmacytic lymphoma. Zhonghua Bing Li Xue Za Zhi. 2010; 39:308–312. PMID: 20654153.
23. Lapidot T, Kollet O. The essential roles of the chemokine SDF-1 and its receptor CXCR4 in human stem cell homing and repopulation of transplanted immune-deficient NOD/SCID and NOD/SCID/B2m(null) mice. Leukemia. 2002; 16:1992–2003. PMID: 12357350.
24. Agarwal A, Ghobrial IM. The bone marrow microenvironment in Waldenström macroglobulinemia. Clin Lymphoma Myeloma Leuk. 2013; 13:218–221. PMID: 23490994.
25. Yoo D, Lessin LS, Jensen WN. Bone-marrow mast cells in lymphoproliferative disorders. Ann Intern Med. 1978; 88:753–757. PMID: 666133.
26. Yoo D, Lessin LS. Bone marrow mast cell content in preleukemic syndrome. Am J Med. 1982; 73:539–542. PMID: 6957149.
27. Nixon RK. The relation of mastocytosis and lymphomatous disease. Ann Intern Med. 1966; 64:856–860. PMID: 23841206.
28. Prokocimer M, Polliack A. Increased bone marrow mast cells in preleukemic syndromes, acute leukemia, and lymphoproliferative disorders. Am J Clin Pathol. 1981; 75:34–38. PMID: 7457427.
29. Molin D, Edström A, Glimelius I, Glimelius B, Nilsson G, Sundström C, et al. Mast cell infiltration correlates with poor prognosis in Hodgkin's lymphoma. Br J Haematol. 2002; 119:122–124. PMID: 12358914.
30. Theoharides TC, Conti P. Mast cells: the Jekyll and Hyde of tumor growth. Trends Immunol. 2004; 25:235–241. PMID: 15099563.
31. Hiromatsu Y, Toda S. Mast cells and angiogenesis. Microsc Res Tech. 2003; 60:64–69. PMID: 12500262.
32. Gauchat JF, Henchoz S, Mazzei G, Aubry JP, Brunner T, Blasey H, et al. Induction of human IgE synthesis in B cells by mast cells and basophils. Nature. 1993; 365:340–343. PMID: 7690905.
33. Pawankar R, Okuda M, Yssel H, Okumura K, Ra C. Nasal mast cells in perennial allergic rhinitics exhibit increased expression of the Fc epsilonRI, CD40L, IL-4, and IL-13, and can induce IgE synthesis in B cells. J Clin Invest. 1997; 99:1492–1499. PMID: 9119992.
Fig. 1

Clinical and laboratory findings of 31 patients with Waldenström macroglobulinemia. Y-axis indicates the percentage of patients with those findings.

alm-40-193-g001
Fig. 2

BM biopsy findings of patients with WM. (A) Classical lymphoplasmacytic lymphoma in a patient with WM (H&E stain, ×200 and ×400). (B) Representative immunohistochemistry for CD20 and CD138 (×400). (C) Representative immunohistochemistry for kappa and lambda light chains (×400). (D) Immunohistochemistry for tryptase and CD154 (×400) highlights increased mast cells (arrow).

Abbreviations: BM, bone marrow; WM, Waldenström macroglobulinemia; H&E, hematoxylin and eosin.
alm-40-193-g002
Fig. 3

Overall survival curves for the high and low CD154-positive mast cell groups based on the median value of 8.6/HPF.

Abbreviation: HPF, high-power field.
alm-40-193-g003
Table 1

Laboratory and BM findings according to the IPSS risk categories of 31 patients with Waldenström macroglobulinemia

alm-40-193-i001
BM studies Median (range) of each risk category
Low (N = 6) Intermediate (N = 16) High (N = 9) P
Age (yr) 64.0 (46.0–77.0) 62.5 (47.0–75.0) 73.0 (67.0–81.0) 0.009*
White blood cell (× 109/L) 6.0 (3.1–8.0) 5.9 (1.3–11.1) 7.8 (2.1–15.0) 0.801
Hb (g/L) 114 (87–142) 97 (50–134) 76 (62–111) 0.016*
Platelets (× 109/L) 256.5 (175.0–501.0) 199.0 (13.0–614.0) 130.0 (18.0–572.0) 0.209
β2-microglobulin (mg/L) 2.2 (1.4–2.7) 4.1 (2.5–30.0) 4.1 (2.6–20.9) 0.014*
M-protein (g/L) 20 (3–34) 28 (4–47) 33 (11–64) 0.364
Small lymphocytes (%) 47.5 (6.0–89.0) 30.9 (4.4–69.0) 33.0 (8.0–76.0) 0.813
Plasmacytoid lymphocytes (%) 4.5 (2.0–11.8) 9.1 (2.0–30.0) 8.0 (1.5–26.0) 0.163
Plasma cells (%) 2.2 (1.0–5.0) 3.0 (0.4–9.6) 2.8 (0.2–6.0) 0.744
CD20-positive cells (%) 22.5 (0.2–95.0) 36.5 (2.0–75.0) 40.0 (3.0–90.0) 0.748
CD138-positive cells (%) 4.6 (0.2–15.0) 5.2 (0.1–30.0) 1.0 (0.2–21.2) 0.442
Tryptase-positive mast cells (/HPF)§ 24.2 (1.2–46.7) 14.8 (4.0–72.0) 20.3 (2.1–63.2) 0.639
CD154-positive mast cells (/HPF)§ 12.1 (0.2–20.1) 8.7 (0.2–15.0) 8.6 (0.1–31.1) 0.750
Cellularity (%) 45.0 (30.0–90.0) 72.5 (20.0–95.0) 80.0 (50.0–100.0) 0.223

*P<0.05; % among BM nucleated cells on BM aspirate smears; Average proportion of immunoreactive cells among BM nucleated cells; §Average number/HPF after direct counting of immunoreactive cells in 10 HPF.

Abbreviations: IPSS, International Prognostic Scoring System; BM, bone marrow; HPF, high-power fields.

Table 2

Laboratory and BM findings according to the percentage of CD20- and CD138-positive cells

alm-40-193-i002
Median (range) CD20-positive cells CD138-positive cells
Low (< 37.0%)* (N = 15) High (≥ 37.0%)* (N = 16) P Low (< 5.0%)* (N = 15) High (≥ 5.0%)* (N = 16) P
Age (yr) 65.0 (46.0–81.0) 66.5 (47.0–74.0) 1.000 67.0 (60.0–77.0) 63.0 (46.0–81.0) 0.247
White blood cell (× 109/L) 7.0 (4.5–15.0) 5.0 (1.3–9.3) 0.014 5.2 (2.1–15.0) 6.2 (1.3–9.7) 0.545
Hb (g/L) 94 (50–142) 93 (50–134) 0.470 94 (65–142) 92 (50–121) 0.446
Platelet (× 109/L) 268 (33–614) 173 (13–572) 0.041 179 (18–572) 235 (13–614) 0.264
β2-microglobulin (mg/L) 3.2 (1.4–30.0) 3.9 (2.2–6.5) 0.949 3.9 (1.4–7.6) 3.6 (2.2–30.0) 0.714
M-protein (g/L) 19 (3–64) 31 (5–47) 0.045 25 (4–35) 31 (3–64) 0.110
Small lymphocytes (%) 16.0 (4.4–79.0) 51.0 (12.8–89.0) < 0.001 33.0 (6.0–89.0) 32.6 (4.4–80.4) 0.953
Plasmacytoid lymphocytes (%) 7.0 (1.5–14.0) 11.4 (2.0–30.0) 0.045 7.6 (1.5–30.0) 10.5 (2.0–30.0) 0.247
Plasma cells (%) 2.8 (0.2–6.0) 2.9 (0.4–9.6) 0.446 2.2 (0.4–5.4) 3.8 (0.2–9.6) 0.033
CD20-positive cells (%) 12.0 (0.2–33.0) 53.5 (37.0–95.0) < 0.001 33.0 (2.0–90.0) 38.5 (0.2–95.0) 0.711
CD138-positive cells (%) 4.2 (0.1–15.0) 5.5 (0.2–30.0) 0.358 1.0 (0.1–4.2) 9.2 (5.0–30.0) < 0.001
Tryptase-positive mast cells (/HPF)§ 20.2 (1.2–72.0) 17.1 (2.1–63.2) 0.949 19.4 (1.2–72.0) 17.1 (2.1–46.7) 0.948
CD154-positive mast cells (/HPF)§ 8.6 (0.2–31.1) 8.8 (0.1–20.1) 0.813 8.7 (0.2–31.1) 8.6 (0.1–20.1) 0.948
Cellularity (%) 50.0 (20.0–100.0) 90.0 (40.0–95.0) 0.004 75.0 (20.0–100.0) 75.0 (40.0–95.0) 0.446

*Median value of positive cell %; % among BM nucleated cells on BM aspirate smear; Average proportion of immunoreactive cells among BM nucleated cells; §Average number/HPF after direct counting of immunoreactive cells in 10 HPF; P<0.05; P<0.005.

Abbreviations: BM, bone marrow; HPF, high-power fields.

Table 3

Laboratory and BM findings according to the percentage of tryptase- and CD154-positive cells

alm-40-193-i003
Median (range) Tryptase-positive cells CD154-positive cells
Low (< 17.1/HPF)* (N = 13) High (≥ 17.1/HPF)* (N = 16) P Low (< 8.6/HPF)* (N = 11) High ( ≥ 8.6/HPF)* (N = 18) P
Age (yr) 66.0 (47.0–74.0) 65.0 (46.0–81.0) 0.880 66.0 (56.0–81.0) 65.0 (46.0–75.0) 0.438
White blood cell (× 109/L) 6.2 (1.3–15.0) 6.3 (2.1–11.1) 0.880 5.8 (1.3–15.0) 6.6 (2.1–11.1) 0.912
Hb (g/L) 101 (50–142) 86 (50–121) 0.199 85 (50–142) 102 (65–121) 0.159
Platelet (× 109/L) 225 (13–501) 187 (18–614) 0.503 225 (13–614) 177 (18–572) 0.438
β2-microglobulin (mg/L) 3.8 (1.4–7.6) 3.4 (2.2–30.0) 1.000 4.5 (1.4–30.0) 3.4 (2.2–7.6) 0.191
M-protein (g/L) 30 (4–47) 26 (3–64) 0.619 30 (7–64) 22 (3–34) 0.068
Small lymphocytes (%) 39.0 (8.0–79.0) 30.5 (4.4–89.0) 0.914 44.0 (8.0–89.0) 28.5 (4.4–80.4) 0.387
Plasmacytoid lymphocytes (%) 10.0 (2.0–30.0) 7.5 (1.5–26.0) 0.121 10.0 (3.0–30.0) 7.5 (1.5–30.0) 0.188
Plasma cells (%) 3.0 (1.6–9.6) 2.0 (0.2–6.0) 0.028 3.2 (0.2–9.6) 2.4 (0.4–7.4) 0.159
CD20-positive cells (%) 40.0 (2.0–75.0) 35.0 (0.2–95.0) 0.948 25.0 (3.0–52.0) 41.0 (0.2–95.0) 0.492
CD138-positive cells (%) 6.0 (0.1–30.0) 4.6 (0.2–21.2) 0.650 7.0 (0.2–20.0) 4.6 (0.1–30.0) 0.611
Tryptase-positive mast cells (/HPF)§ 10.0 (1.2–17.0) 26.7 (17.1–72.0) < 0.001 10.4 (1.2–27.8) 19.5 (4.0–72.0) 0.031
CD154-positive mast cells (/HPF)§ 7.2 (0.1–17.5) 9.7 (0.4–31.1) 0.062 2.6 (0.1–7.4) 10.7 (8.6–31.1) < 0.001
Cellularity (%) 50.0 (20.0–95.0) 75.0 (40.0–100.0) 0.374 70.0 (30.0–95.0) 75.0 (20.0–100.0) 0.947

*Median value of positive cell %; % among BM nucleated cells in BM aspirates; Average proportion of immunoreactive cells among BM nucleated cells; §Average number/HPF after direct counting of immunoreactive cells in 10 HPF; P<0.05; P<0.005.

Abbreviations: BM, bone marrow; HPF, high-power fields.

TOOLS
Similar articles