

 PDF
PDF ePub
ePub Citation
 Print
Print


Abstract
Purpose
Methods
Results
Figures and Tables
Table 1
Demographic data of the traumatic hyphema patients
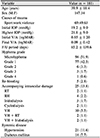
Values are presented as the mean ± standard deviation or number (%) unless otherwise indicated.
M = male; F = female; IOP = intraocular pressure; V/A = visual acuity; logMAR = logarithm of minimal angle of resolution; F/U = follow-up; RT = retinal tear; RH = retinal hemorrhage; VH = vitreous hemorrhage.
![]()
Table 2
The comparison between IIOP group and non-IIOP group in traumatic hyphema patients
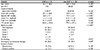
Values are presented as the mean ± standard deviation or number (%) unless otherwise indicated.
IIOP = increased intraocular pressure; M = male; F = female; IOP = intraocular pressure; V/A = visual acuity; logMAR = logarithm of minimal angle of resolution; F/U = follow-up.
*Student t-test; †Pearson chi-square test; ‡Mann Whitney U-test; §Linear-by-Linear association.
![]()
Table 3
The comparison between TC group and TT group in traumatic hyphema patients
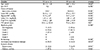
Values are presented as the mean ± standard deviation or number (%) unless otherwise indicated.
TC = treatment continuation; TT = treatment termination; M = male; F = female; IOP = intraocular pressure; V/A = visual acuity; logMAR = logarithm of minimal angle of resolution; F/U = follow-up.
*Student t-test; †Pearson chi-square test; ‡Mann Whitney U-test; §Linear-by-Linear association; ∥Fischer's exact test.
![]()
 XML Download