

 PDF
PDF ePub
ePub Citation
 Print
Print


Abstract
Purpose
Methods
Results
Conclusions
Figures and Tables
Figure 1
A schematic of the left-eye feline fundus showing the locations and sizes of histological tissue samples. A = superiorly, the average distance between the pars plicata and pars plana; B = laterally, the average distance between the pars plicata and pars plana; C = Inferiorly, the average distance between the pars plicata and pars plana; D = medially, the average distance between the pars plicata and pars plana; E = superiorly, the average distance between the pars plana and ora serrata; F = laterally, the average distance between the pars plana and ora serrata; G = inferiorly, the average distance between the pars plana and ora serrata; H = medially, the average distance between the pars plana and ora serrata; I = the average distance from the superior optic disc margin to the superior ora serrata; J = the average distance from the lateral optic disc margin to the lateral ora serrata; K = the average distance from the inferior optic disc margin to the inferior ora serrata; L = the average distance from the medial optic disc margin to the medial ora serrata; M = the average distance from the superior optic disc margin to the superior tapetum lucidum; N = the average distance from the lateral optic disc margin to the lateral tapetum lucidum; O = the average distance from the inferior optic disc margin to the inferior tapetum lucidum.
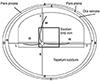
Figure 2
A representative electroretinogram (ERG) scotopic response at 0.1 cd·s/m2 of feline #5 (right eye). (A) The scotopic ERG wave was below 0.1 cd·s/m2 from baseline (before iodoacetic acid [IAA] injection) to 4th week after injection. The b wave disappeared at 1st week after injection, and did not reappear during the next 3 weeks. (B) Changes in the average b wave amplitude (cd·s/m2) after IAA injection. The differences were statistically significant (*p < 0.05, Wilcoxon signed-rank test).
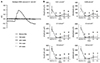
Figure 3
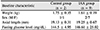
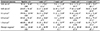
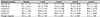
The mean ONL nuclear cell count and the mean RHO-stained area were significantly reduced after IAA injection; however, neither the INL nuclear cell count nor the L/M opsin cell count fell (A–D). INL = inner nuclear layer; IAA = iodoacetic acid; ONL = outer nuclear layer; L/M = anti-red/green; RHO = rhodopsin. *p < 0.05 Wilcoxon signed-rank test.
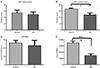
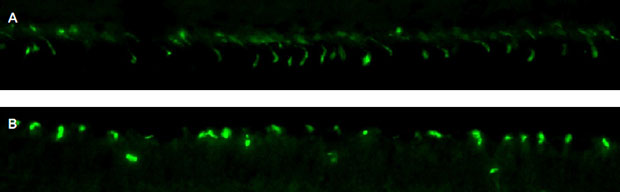
Figure 4
Iodoacetic acid (IAA) triggered loss of the outer but not the inner nuclear layer. (A, C–F) Control group histology (no IAA injection, [A], H&E staining, ×400; [C–F], IHC staining, ×400). (B, G–J) IAA group histology 4 weeks after IAA injection [B], H&E staining, [G–J], IHC staining, ×400). Scale bar indicated 50 µm.
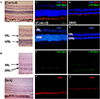
Table 1
Gross anatomical lengths
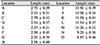
Values are presented as mean ± standard deviation.
A = superiorly, the average distance between the pars plicata and pars plana; B = laterally, the average distance between the pars plicata and pars plana; C = inferiorly, the average distance between the pars plicata and pars plana; D = medially, the average distance between the pars plicata and pars plana; E = superiorly, the average distance between the pars plana and ora serrata; F = laterally, the average distance between the pars plana and ora serrata; G = inferiorly, the average distance between the pars plana and ora serrata; H = medially, the average distance between the pars plana and ora serrata; I = the average distance from the superior optic disc margin to the superior ora serrata; J = the average distance from the lateral optic disc margin to the lateral ora serrata; K = the average distance from the inferior optic disc margin to the inferior ora serrata; L = the average distance from the medial optic disc margin to the medial ora serrata; M = the average distance from the superior optic disc margin to the superior tapetum lucidum; N = the average distance from the lateral optic disc margin to the lateral tapetum lucidum; O = the average distance from the inferior optic disc margin to the inferior tapetum lucidum.
 XML Download