

 PDF
PDF ePub
ePub Citation
 Print
Print


INTRODUCTION
Diagnostic tests are indispensable in clinical practice as they inform clinicians about the likelihood that a patient has the suspected target disease or condition and guide subsequent decisions on further testing or treatment [1]. Accuracy is an important feature of any diagnostic testing, and diagnostic accuracy is evaluated by comparing results of the test of interest (index test) with those of a reference standard in a series of patients suspected of having a target condition. The results are typically expressed in measures, such as sensitivity and specificity, positive and negative predictive values, likelihood ratios, and area under the receiver operating characteristic (ROC) curve [234]. Diagnostic accuracy studies are at risk of several types of bias, which is a systematic difference in an observed measurement from the true value [5]. Major sources of bias in diagnostic accuracy studies include methodological deficiencies in participant selection and applicability, data collection, test execution and interpretation, and data analysis [56]. In addition, diagnostic accuracy studies are often not reported completely [7], which hinders a reader's ability to evaluate the risk of bias and to determine the generalizability of the study findings, and limits reproducibility.
In 2003, Standards for Reporting of Diagnostic Accuracy (STARD), composed of a list of 25 essential items that should be reported in every study report, were published to increase the transparency and completeness of reporting diagnostic accuracy studies [89]. STARD are general guidelines designed to be applied to all types of diagnostic accuracy studies rather than focusing on specific issues or categories of medical tests [234]. This includes prognostic studies that could classify patients based on future events, monitoring studies that require testing to detect or predict an adverse event or lack of response, and studies that assess treatment selection markers [234]. The STARD initiative has been adopted by more than 200 journals, spanning basic research to medicine [5]. In 2015, the STARD guidelines were updated [234], and the essential items were increased to 30. The new standard covers the title (item 1), abstract (item 2), introduction (items 3 and 4), methods (items 5–18), results (items 19–25), and discussion (items 26 and 27), and requires additional information (items 28–30) about the study protocol and funding sources [234]. Since the publication of STARD, several evaluations have shown modest improvements in reporting diagnostic accuracy research [101112].
Annals of Laboratory Medicine (ALM; ISSN 2234-3806) is the official journal of Korean Society for Laboratory Medicine and is indexed both in Medline and PubMed [13]. Since its name was changed from Korean Journal of Laboratory Medicine (ISSN 1598-6535) to ALM in 2012, it has consistently published numerous articles in various fields, including diagnostic hematology, clinical chemistry, clinical microbiology, diagnostic immunology, transfusion medicine, diagnostic genetics, laboratory informatics, and general laboratory medicine [13]. However, STARD have not been included in the instructions for authors by ALM.
The level of adherence of laboratory diagnostic accuracy studies to STARD 2015 is unknown in Korea. Assessing the basic status of adherence to STARD is critical and would enable us to determine and improve existing deficiencies. Thus, this study aimed to evaluate adherence of diagnostic accuracy studies published in ALM from inception in 2012 to 2018 to STARD 2015.
MATERIALS AND METHODS
Study selection
This was a cross-sectional study that evaluated all research papers published in ALM between 2012 and 2018 without distinguishing publication before or after STARD 2015 announcement. Studies for assessing the adherence to STARD 2015 were selected if they met the following inclusion criteria: (1) the diagnostic accuracy of one or more laboratory index tests was evaluated against a reference standard in human subjects and (2) at least one estimate of diagnostic accuracy, such as sensitivity, specificity, positive and negative predictive values, and ROC curve, was reported. We excluded studies, in which the index test or reference standard test was not clear, studies that compared index tests, studies that verified analytical performance, multivariable prediction model study, and letters. Two authors (M.A.J. and B.K.) independently screened the titles and abstracts of all the retrieved studies to evaluate their potential relevance. The full texts of all potentially relevant studies were assessed in duplicate. If an article was considered potentially eligible by at least one author, the full text was assessed independently by both authors against the inclusion criteria. Disagreements were discussed and resolved in consensus meetings.
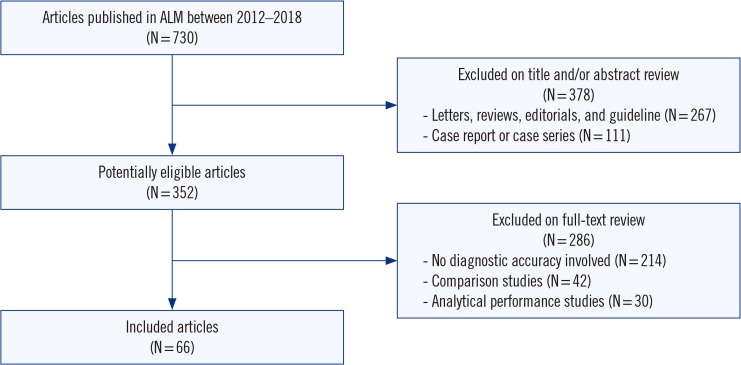
Seven hundred thirty studies were published in ALM between 2012 and 2018, of which 352 were deemed potentially eligible after screening (Fig. 1). The excluded articles were letters (N=232), case reports or series (N=111), review articles (N=29), editorials (N=5), or guidelines (N=1). After reviewing the full texts, 66 (9.0%, 66/730) diagnostic accuracy studies were included in the final analysis (Supplemental Data Table S1). The selection process is illustrated in Fig. 1.
Adherence to STARD 2015
The STARD 2015 list consists of 30 essential items grouped in six sections: title and abstract, introduction, methods, results, discussion, and other information [234]. Several STARD 2015 items have more than one sub-item. For example, item 2 (structured abstract) is divided into 10 sub-items (2a, identification as a diagnostic accuracy study; 2b, study objectives; 2c, data collection; 2d, eligibility criteria; 2e, selection of participants; 2f, description of the index test and reference standard; 2g, numbers of participants with and without the target condition; 2h, estimates of diagnostic accuracy and precision; 2i, general interpretation of the results; and 2j, implications for practice) [14] that are scored independently. Items 10, 12, and 13 on the methods section comprise two sub-items applicable to the index test (10a, 12a, and 13a) and to the reference standard (10b, 12b, and 13b). Among them, sub-items 12a and 12b on test result cut-off or category are further subdivided into more specific items for definition and rationale (12a, definition; 12a, rationale; 12b, definition; and 12b, rationale). In addition to the above items, we identified potentially relevant contents in an item that might be helpful when analyzed in detail. For example, item 3 (scientific and clinical background in the introduction) was divided into two sub-items (3a for intended use and 3b for clinical role of index test) for more detailed analysis.
Fulfillment of an item was recorded as 1 point. Items with multiple sub-items were scored with fractional points for each sub-item, adding up to a maximum total of 1 point. For example, the 10 sub-items of item 2 were recorded as 0.1 point each. Thus, the total maximum score was 30 points (i.e. it ranged from 0 – none of the items sufficiently reported, to 30 – all items sufficiently reported). Data analysis and the scoring method largely followed practices established in similar previous studies [101516]. Detailed descriptions of compliance with STARD 2015 are given in Supplemental Data Table S2.
Each study was evaluated by two independent authors (M.A.J. and B.K.). To ensure high agreement among authors on each item, they first received an educational session on reviewing STARD 2015 and related literature. We referred to a document providing an explanation and elaboration of STARD 2015 for a detailed rationale behind the rating of each item [17]. Before STARD scoring, we conducted pilot scoring on three diagnostic accuracy studies, and refined the description of each item and prepared a final data extraction form based on several discussions. Discrepancies between the two authors were resolved through discussions in consensus meetings and during a final review by a third expert (Y.K.L).
Statistical analysis
The overall mean number of STARD items reported were determined. The two authors' (M.A.J. and B.K.) agreement on compliance with the assessment for STARD 2015 was evaluated based on Cohen's kappa coefficient as follows: <0.00, poor; 0.00–0.20, slight; 0.21–0.40, fair; 0.41–0.60, moderate; 0.61–0.80, substantial; and 0.81–1.00, almost perfect [18]. One-way analysis of variance was used to compare fulfilled STARD items of the diagnostic accuracy studies published in ALM by year. Statistical analysis was conducted using SPSS Statistics for Windows version 25.0 (IBM Corp., Armonk, NY, USA). A two-sided P<0.05 was considered statistically significant.
RESULTS
Overall adherence to STARD 2015
Characteristics of the articles included for final analysis are summarized in Table 1. The overall mean (SD) number of STARD item for the 66 diagnostic accuracy studies in ALM was 11.2±2.7 (Table 1). Inter-author agreement in compliance assessment for STARD 2015 was almost perfect, with a kappa value of 0.9. Only five (7.6%) studies reported more than 50% of the 30 items (total fulfilled STARD items>15). No study satisfied more than 80% of the items (total fulfilled STARD items>24). The fulfilled number of STARD items were not significantly different from year to year.
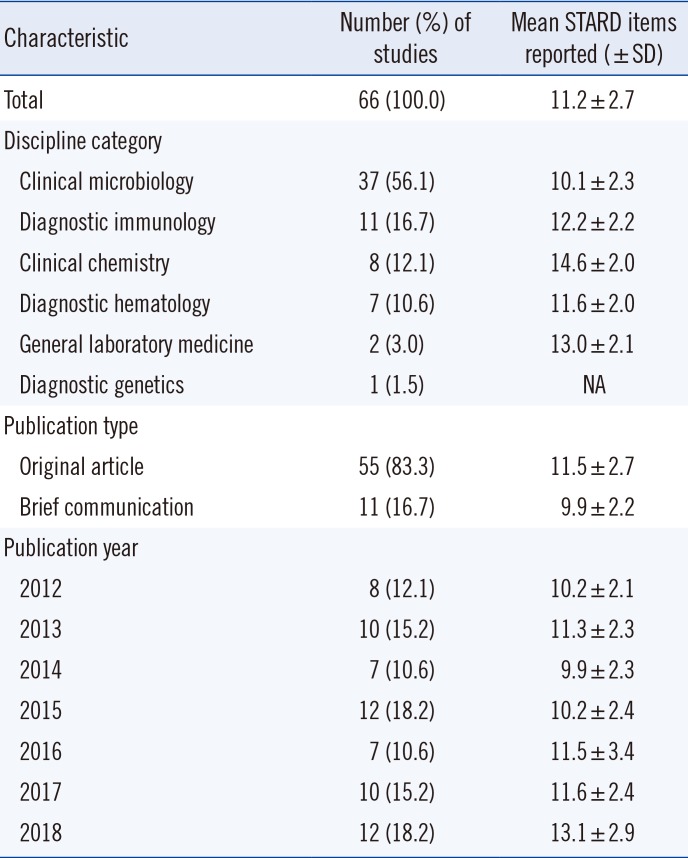
Table 1
Characteristics of diagnostic accuracy studies published in ALM between 2012 and 2018 and adherence to STARD 2015
![]()
Item-specific adherence to STARD 2015
Item-by-item adherence of the 66 diagnostic accuracy studies in ALM to the STARD 2015 is summarized in Table 2. Overall, adherence to STARD 2015 for each item varied widely, ranging from 0% to 100%. Eleven items or sub-items were reported in more than 80% of the studies: title or abstract (item 1), abstract (items 2a, 2b, 2i, and 2j), introduction (items 3a and 4a), methods (items 8b and 10a), results (item 24), and discussion (item 27a). Three of these items were reported in all studies (items 2b, 3a, and 4a).
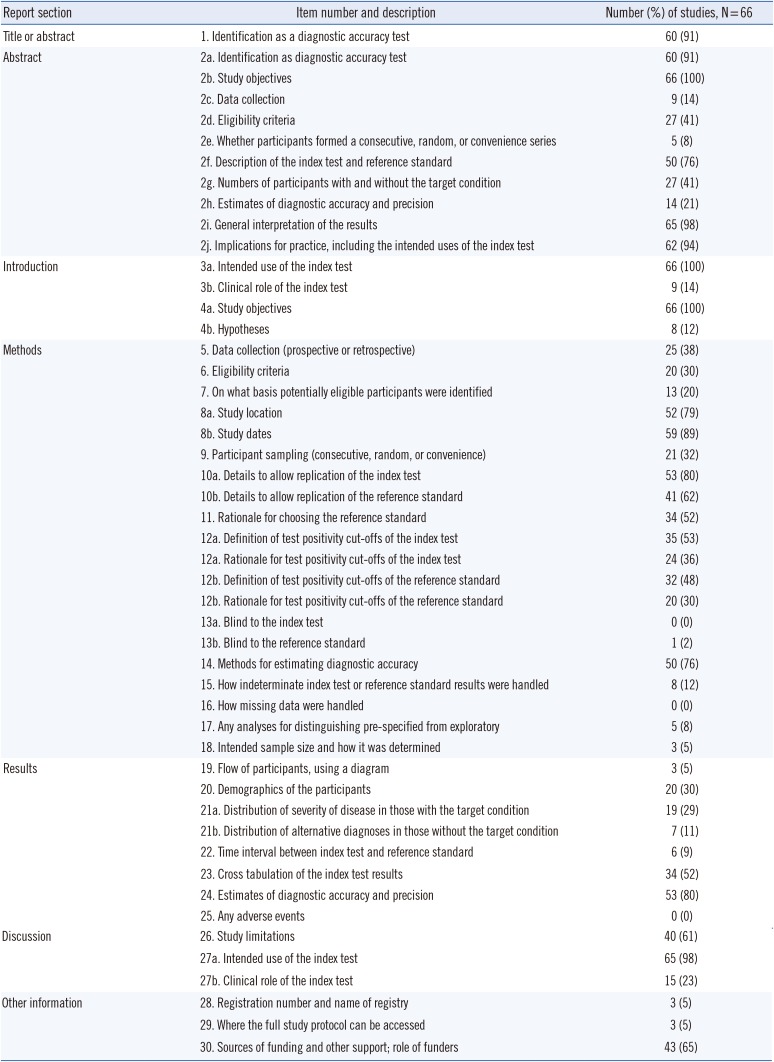
Table 2
Adherence to individual STARD 2015 items
Revised schema from STARD 2015 statement [234]. The STARD 2015 is released under the Creative Commons CC BY-NC license (http://creativecommons.org/licenses/by-nc/4.0).
![]()
Conversely, 23 STARD items or sub-items were adhered to <30% of the studies: abstract (items 2c, 2e, and 2h), introduction (items 3b and 4b), methods (items 6, 7, 12b, 13a, 13b, 15, 16, 17, and 18), results (items 19, 20, 21a, 21b, 22, and 25), discussion (item 27b), and other information (items 28 and 29). None of the studies showed adherence to items 13a, 16, or 25.
DISCUSSION
We investigated the adherence of diagnostic accuracy studies published in ALM between 2012 and 2018 to STARD 2015. The reporting quality of diagnostic accuracy studies was suboptimal, with an overall STARD adherence of only 37.3% (11.2/30 items) and high variability across items.
In comparison with previous assessments of adherence to STARD 2015, the average number of STARD items reported in the current study is low. In 2017, Michelessi, et al. [19] reported an adherence of 54.1% (16.8/31 items) in studies on glaucoma. In 2018, Hong, et al. [20] reported a higher adherence in their evaluation of imaging studies assessing accuracy (55.3%, 16.6/30 items) [20]. A systematic review of 90 laboratory diagnostic accuracy studies on tuberculosis, malaria, and HIV revealed an overall STARD adherence of 54.4% (13.6/25 items) [1121]. Another study of imaging and laboratory diagnostic accuracy studies revealed a high adherence rate of 61.2% (15.3/25 items) [10]. Choi, et al. [16] identified a substantially higher adherence among 63 imaging studies (74%, 20/27 items). Therefore, we believe that differences in research fields do not explain differences in adherence to STARD. Rather, we hypothesize that the fact that ALM does not require authors to adhere to STARD accounts for the low adherence observed in the current study. Previous studies have shown that the numbers of reported STARD items are higher in STARD-adopting than those in non-adopting journals [1020].
Several STARD items have been infrequently reported and are in need of improvement. In the introduction of a scientific study, the authors should describe the intended use and clinical role of the index test under evaluation (items 3a and 3b), and study objectives and testable hypotheses (items 4a and 4b). The clinical role of the index test refers to its anticipated position relative to other existing tests, such as a triage, add-on, or replacement [17]. Hypotheses are defined as acceptance criteria for a single test, such as the minimum level of sensitivity or specificity, which guide the calculation of the sample size required for the study [8]. Only 14% and 12% of the diagnostic accuracy studies in ALM properly reported the clinical role of the test and hypothesis, respectively (Table 2). In addition, several items related to participants, such as items 7, 9, 19, 20, 21, and 22, were poorly reported in more than two-thirds of the studies. This information is important because test performance is not fixed and may vary in different settings and among patients with different characteristics [522].
Data analysis was also often poorly reported. For example, handling of indeterminate (item 15) or missing (item 16) data was reported in 12% and 0% of the studies, respectively. Analyses of variability in diagnostic accuracy were reported in only 8% of studies, and only 5% of the studies reported the intended sample size and how it was determined. Indeterminate or missing data are common in all types of biomedical researches [172324]. Missing data can occur in index or reference standard testing and pose a challenge when evaluating the performance of a diagnostic test [17]. The source of funding, including the role of the funder (item 30), was reported in 65% of the studies. Frequently, authors did report the source of funding, but did not describe the role of the funder. Registration number and name of registry (item 28) as well as full study protocol details (item 29) were reported in only 5% of the studies.
Diagnostic accuracy studies are sensitive to a number of unique sources of bias [525]. Bias can occur at several stages, including the study population, test protocol, reference standard and verification process, and interpretation and analysis [222526]. We identified several common biases in the diagnostic accuracy reports in ALM. First, spectrum bias (related to STARD items 6–9), which arises from differences in demographic features or disease severity, and bias in patient selection occurred frequently [222526]. In a study evaluating the performance of a hepatitis C virus (HCV) rapid antibody test, the authors recruited 137 patients diagnosed as having HCV infection and 300 healthy blood donors, and reported a sensitivity of 97.8% and specificity of 100% [27]. We would expect the diagnostic accuracy to be greater in this study because it was conducted in patients with confirmed rather than suspected disease, as the former are encountered more often in practice. Therefore, data obtained from studies in populations with significant differences in disease severity may not be comparable [5].
Second, partial verification bias (data for only a selected sample of patients who underwent the index test are verified by the reference standard, related to STARD items 16 and 19) was also common [2225]. For example, in one study, monoplex PCR was used as a reference test for some selected samples (17%, 74/426 samples) that showed discrepancies between two index multiplex PCR tests to detect 16 respiratory viruses [28], indicating partial verification bias. Such a bias might increase the probability of falsely elevated sensitivity and falsely decreased specificity [5]. Third, incorporation bias (the result of the index test is included as a criterion for the reference standard, related to STARD item 11) can be observed at the interpretation stage [525]. For example, in a study on molecular detection of human papillomavirus (HPV), the authors calculated the sensitivity and specificity of each index test based on consensus HPV results between the three index tests [29]. One study reported higher sensitivity and lower specificity in the presence of incorporation bias [30]. In the era of evidence-based medicine, researchers should recognize the importance of biases and try to avoid their common sources. Furthermore, researchers should mention potential sources of bias in the discussion section (related to STARD item 26) to inform the reader of the limitations of their study and to accurately present the results and conclusions of the study [17].
The current study has several limitations: (1) we evaluated only 66 diagnostic accuracy studies, (2) since the articles evaluated were published in a single journal, findings cannot be generalized to reports in other journals, (3) no further analysis was performed on specific features such as study purpose, test areas, markers, instruments, or target conditions, and (4) several STARD 2015 items are open to interpretation and are rather subjective. We tried to minimize this limitation by defining each item in detail, performing pilot exercises, and conducting thorough discussions during consensus meetings. On the other hand, this study has the following strengths: (1) this is the first study to estimate the adherence of laboratory diagnostic accuracy studies published in ALM to STARD 2015 and (2) we analyzed STARD 2015 items in as much detail as possible. For example, STARD for abstract (item 2) encompass a list of 11 essential sub-items [14]. Except for the last sub-item on study registration, the remaining 10 sub-items were analyzed individually, allowing detailed evaluation of which sub-items were aptly adhered to (Table 2).
Taken together, our results show that adherence of diagnostic accuracy studies published in ALM to STARD 2015 is low, and more work and effort are needed to improve the reporting quality of such studies. Our data emphasize the necessity of adopting STARD to enhance the value of future diagnostic accuracy studies to be published in ALM.
 XML Download