Journal List > Ann Lab Med > v.40(3) > 1139538

Cho, Seo, and Uh: Clinical Application of Overlapping Confidence Intervals for Monitoring Changes in Serial Clinical Chemistry Test Results

Abstract

Background

Interpretation of changes in serial laboratory results is necessary for both clinicians and laboratories; however, setting decision limits is not easy. Although the reference change value (RCV) has been widely used for auto-verification, it has limitations in clinical settings. We introduce the concept of overlapping confidence intervals (CIs) to determine whether the changes are statistically significant in clinical chemistry laboratory test results.

Methods

In total, 1,202,096 paired results for 33 analytes routinely tested in our clinical chemistry laboratory were analyzed. The distributions of delta% absolute values and cut-off values for certain percentiles were calculated. The CIs for each analyte were set based on biological variation, and data were analyzed at various confidence levels. Additionally, we analyzed the data using RCVs and compared their clinical utility.

Results

Most analytes had low indexes of individuality with large inter-individual variability. The 97.5th percentile cut-offs for each analyte were much larger than conventional RCVs. The percentages of results exceeding RCV95% and RCV99% corresponded to those with no overlap at the 83.4% and 93.2% confidence levels, respectively.

Conclusions

The use of overlapping CIs in serial clinical chemistry test results can overcome the limitations of existing RCVs and replace them, especially for analytes with large intra-individual variation.

INTRODUCTION

Currently, significant amounts of laboratory results are generated and reported to clinical departments. Clinical laboratories are continuously trying to ensure test result quality and reliability using their own quality control schemes and operation algorithms.
Together with quality control, comparing serial laboratory results is important for monitoring patient condition, estimating responsiveness to therapy, and predicting when additional interventions are necessary [12]. Therefore, clinical laboratories are also required to provide additional information regarding the interpretability of changes in serial laboratory results, but it is not easy to set decision limits for cases ranging from healthy conditions to morbid or disease status and vice versa. Biological variation is an important concept to explain these conditions [3], and the utility of biological variation has been emphasized in many reports [456789]. Biochemical analytes are biologically active in response to metabolic changes, and these natural fluctuations could influence laboratory results even in analytes measured in a single day [1]. Analytical error should also be considered, including pre-analytical variables, analytical imprecision, and the possibility of random error. Analytical error can be minimized but cannot be eliminated. Thus, both biological variation and analytical error should be considered when establishing acceptable decision limits [510].
The concept of reference change values (RCVs) based on biological variation is widely used for interpreting changes in serial laboratory results; it has been applied to clinical laboratory tests such as delta check and auto-verification [11112131415]. However, RCV still has limitations as many of the biochemical analytes have high intra-individual variation [1314]. For these reasons, we tried to introduce the concept of confidence interval (CI) into the interpretation of serial clinical chemistry test results. CI represents the statistically significant probability of the validity of values, and 95% CI covers the true value with 95% probability [16]. Overlapping CIs can explain statistical significance when comparing two measured results. If the two CIs do not overlap, they can be considered significantly different [1617]. To the best of our knowledge, no studies till date have examined the association between overlapping CIs and clinical chemistry test results.
The aims of this study were to: (1) introduce the concept of overlapping CIs into the interpretation of changes in serial clinical chemistry test results; (2) compare their clinical utility with that of conventional RCVs; and (3) determine the possibility of practical clinical application.

MATERIALS AND METHODS

Data collection

We retrospectively analyzed all the clinical chemistry test results obtained from 1,421,595 outpatients at Wonju Severance Christian Hospital, Wonju, Korea between January and December 2017. In total, 2,022,643 test results were obtained from outpatients. The number of paired results was 1,202,096 (59.4%). To minimize the effects of fluctuations due to treatment, intervention, or sudden physiological changes, we excluded the records of hospitalized and emergency room patients. The clinical chemistry test items included the followings: albumin (ALB), alkaline phosphatase (ALP), alanine aminotransferase (ALT), aspartate aminotransferase (AST), blood urea nitrogen (BUN), complement 3 (C3), complement 4 (C4), calcium (CA), creatine kinase (CK), chloride (CL), total carbon dioxide (CO2), creatinine (CRE), C-reactive protein (CRP), direct bilirubin (DB), iron (FE), gamma-glutamyl transferase (GGT), glucose (GLU), high-density lipoprotein (HDL) cholesterol, immunoglobulin (Ig)A, IgG, IgM, potassium (K), lactate dehydrogenase (LDH), low-density lipoprotein (LDL) cholesterol, magnesium (MG), sodium (NA), inorganic phosphorus (P), rheumatoid factor (RF), total bilirubin (TB), total cholesterol (TCHO), triglyceride (TG), total protein (TP), and uric acid (UA). All tests were performed using the Cobas 8000 system (Cobas c 702 and E 601 module; Roche Diagnostics, Basel, Switzerland). This study was approved by the Institutional Review Board (IRB) of Wonju Severance Christian Hospital (IRB No. CR318097), which waived the requirement for informed consent.

Patient data analysis

To calculate the changes in serial test results, pairs of test results from the same patient were collected. To correct the time order of previous and current results, we used the absolute values. The absolute values of percent difference (absolute delta%) between the previous result and current result were calculated as follows:
Absolute delta%=[Current result−Previous result]/Previous result×100(%)
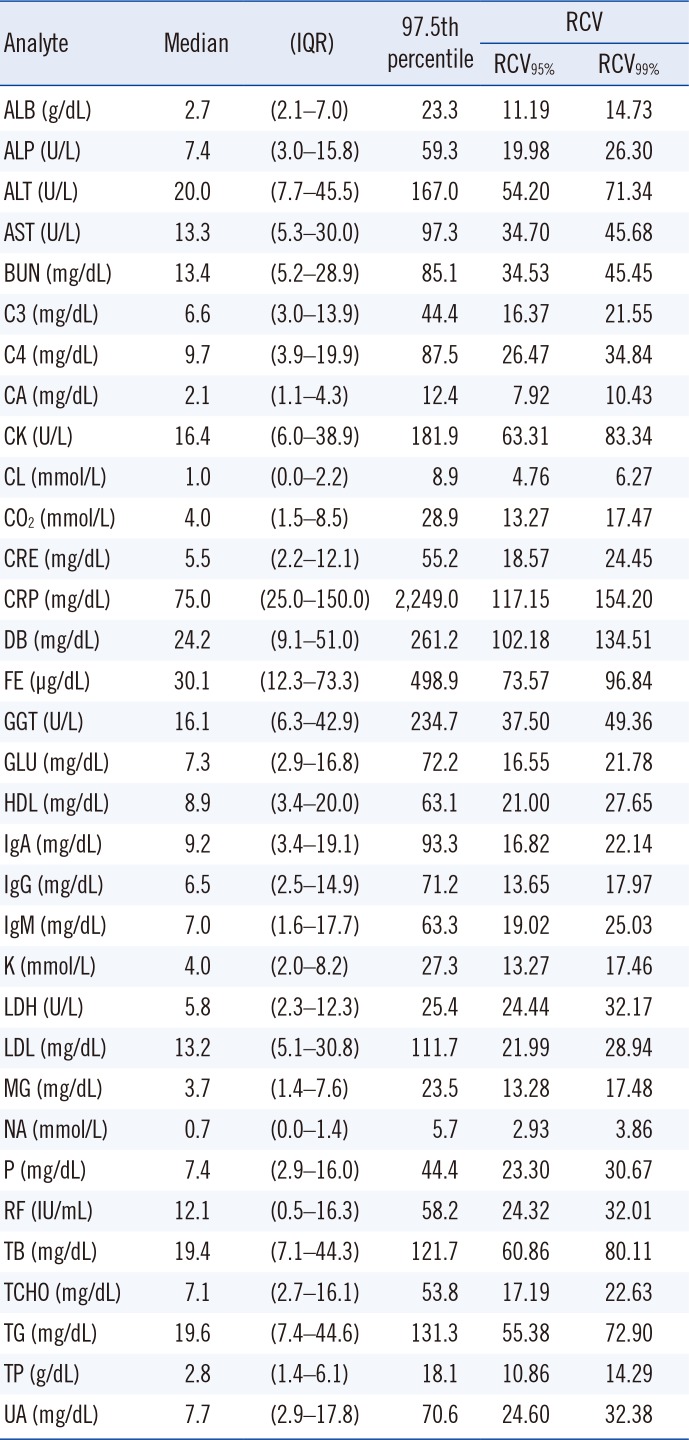
The distributions of absolute delta% were assessed for all analytes tested in this study; the 97.5th percentile values of our data distribution for each item were also calculated.

Interpreting the changes in serial test results

The RCVs for each analyte were calculated using the following formula [11112131415]:
RCV%=2×Z×CVA2+CVI2alm-40-201-e001.jpg
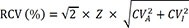
where RCV is the reference change value, Z-score is the value of the standard deviation at a point above the specified probability in normal distribution (i.e. the Z-scores corresponding to 95% and 99% are 1.96 and 2.58, respectively), CVA is the analytical coefficient of variation obtained from the internal quality control program of our clinical chemistry laboratory, and CVI is the intra-individual variation defined by the European Federation of Clinical Chemistry and Laboratory Medicine [18] and the Westgard database of biological variation [319].
The concept of overlapping CIs was used to interpret the changes in serial laboratory results. The ranges of the CIs, which were also based on the biological variation database for each analyte, were calculated using the following formula:
RangeofCI=Ztest×CVA2+CVI2alm-40-201-e002.jpg
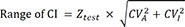
where Z test indicates the Z-score, at which the degree of overlapping CIs at a given probability can reject a null hypothesis.
Previous studies have noted that a confidence level of 83.4% could explain the statistical significance of whether overlapping CIs between two means are significantly different at the α=0.05 level [2021]. Similar to previous studies, we calculated that a confidence level of 93.2% could explain the statistical significance, i.e., whether overlapping CIs between two means are significantly different at α=0.01 level. In addition, we also compared the values obtained at 95% confidence level. The Z test values were 1.39, 1.82, and 1.98 at confidence levels of 83.4%, 93.2%, and 95%, respectively.

Development of the monitoring system

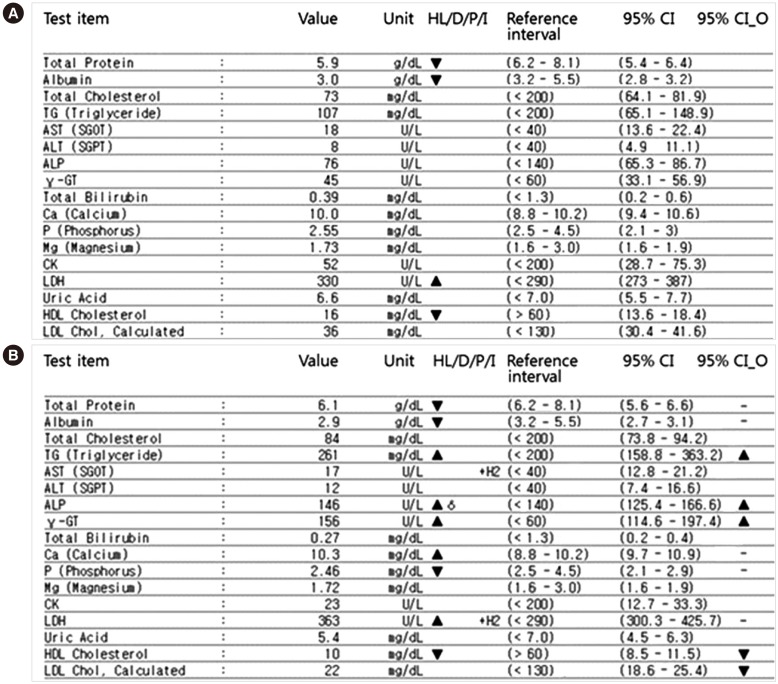
We developed a monitoring system for the changes in serial laboratory results using the concept of overlapping CIs and integrated it into our laboratory information system (LIS) technology. Details of the criteria and formulae for interpreting the changes in serial test results are described in the ‘Interpreting the changes in serial test results’ section. Fig. 1 provides an example of the results obtained using this new system. The 95% CI of the current and previous test results reflecting biological variation are displayed and compared. If the 95% CIs do not overlap, the two results are shown to be significantly different from each other. For example, the 95% CI for TG in the initial results was 65.1–148.9, while the follow-up result was 158.8–363.2. As the CIs of this item do not overlap, the “95% CI_O” sign was displayed as significantly increased. Additionally, through the administration menu of our system, we input the CVA values, which were obtained from our annual internal quality control data. CVI is a fixed value for each test item, but it can be changed if the Westgard database is changed.

Statistical analysis

Data distributions were confirmed as normal by the Kolmogorov-Smirnov test, and a P value greater than 0.05 indicates normal distribution. Since the distributions of absolute delta% did not show normal distribution (non-parametric), they were presented as median and interquartile range (IQR). The percentages of test results exceeding the RCV and those in which the CIs do not overlap showed normal distribution (parametric) and were presented as mean and 95% CI. All statistical analyses were performed using SPSS version 23.0 (IBM Corp., Armonk, NY, USA) and the Analyse-it version 5.01 (Analyse-It Software, Ltd., Leeds, UK) add-on in Microsoft Excel 2016 (Microsoft Corp, Redmond, WA, USA).

RESULTS

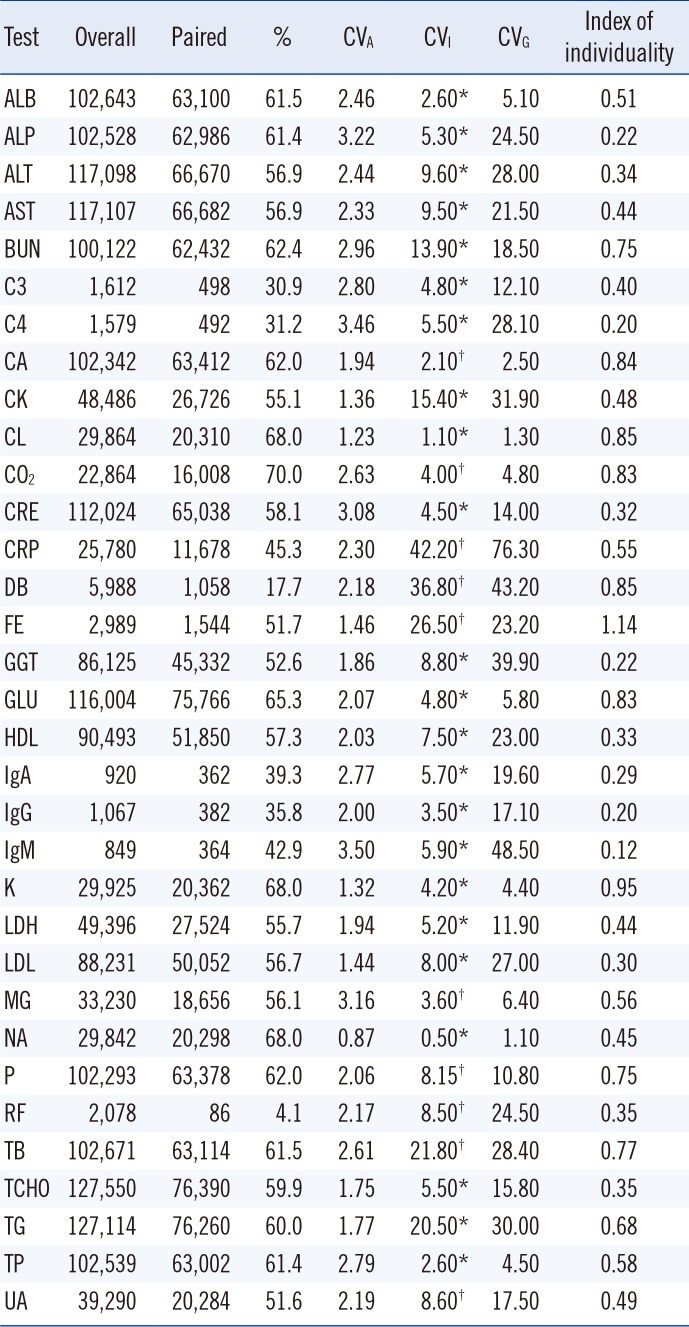
The numbers and percentages of the 33 clinical chemistry test items are listed in Table 1. The values of CVA, CVI, inter-individual variation (CVG), and indexes of individuality (=the ratio of CVI to CVG) [22] are also listed in Table 1. The statistical characteristics for the absolute value of each delta% in each analyte are summarized in Table 2.
Many analytes showed right-skewed patterns in the histogram; however, some analytes (ALT, CK, CRP, DB, FE, and GGT) showed relatively high proportions, exceeding 100% of the absolute delta%. The distributions of absolute delta% for each analyte are illustrated in Supplemental Data Fig. S1.
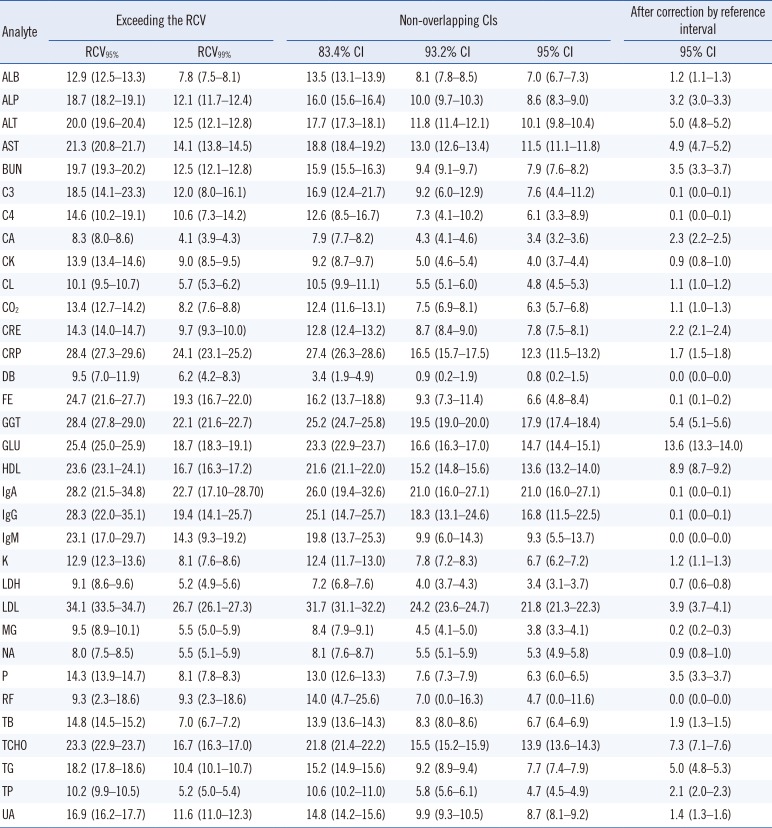
Table 3 shows the comparison of the percentages of test results between those exceeding the RCV and those in which the CIs do not overlap. In CA and TB, when the cut-off was changed from RCV95% to RCV99%, the percentage of test results exceeding the RCV was reduced by more than a half. The percentages of non-overlapping CIs also varied according to the analytes; however, the overall tendency was similar to that of the RCVs. The distributions of percentages exceeding RCV95% and RCV99% were similar to those of non-overlapping 83.4% CI and 93.2% CI, respectively. However, we found that the excess rates were slightly lower when using the CI than when using the RCV. In particular, in CRP, the decrease in the excess rate was more pronounced when using the CI than using the RCV.
Additionally, we examined the change in percentage of test results, in which the CIs did not overlap after correction using the reference interval. In some analytes, such as CRE, CRP, DB, and TB, the change in absolute values of <1 may be overestimated owing to the large percent change. Additionally, for some analytes for which most test results are within the reference interval, monitoring changes in serial results might be less important. We therefore performed further analysis only if at least one of the previous and current test results deviated from the reference range, as shown in Table 3. After correction using the reference interval, most of the percentages decreased.

DISCUSSION

In this study, we attempted to introduce a new method of considering both the CVA and CVI to replace the existing concept of RCV used for monitoring the changes in serial clinical chemistry results. The 95% CI covers the true value with 95% probability. However, it is thought that the 95% CI of two means could overlap, even if the two means are significantly different at the α=0.05 level [2021]. Austin and Hux [20] demonstrated that two means are statistically significantly different at the α=0.05 level when the ratio of overlapping CIs between two means is <29%. Furthermore, Knol, et al. [21] found that the probability of a type 1 error is 0.056, rather than 0.05, when the 95% CIs of the two means do not overlap. Therefore, it is necessary to set each CI level to explain how much the degree of each overlap significantly differs from a certain probability. When we calculated the CI corresponding to a specific type 1 error probability value according to the method introduced by Knol, et al. [21], a CI level of 83.4% corresponded to a type 1 error probability of 0.05 and a CI level of 93.2% corresponded to a type 1 error probability of 0.01. As mentioned in the Results section, the distributions of percentages exceeding RCV95% and RCV99% were similar to those of non-overlapping 83.4% CI and 93.2% CI, respectively. The percentages of results in which 95% CIs did not overlap were lower than those exceeding RCV95%, RCV97%, and RCV99%.
In this study, most of the 97.5th percentile cut-off values for each analyte were larger than the corresponding RCVs, indicating that intra-individual fluctuations in biochemical analytes were greater than the values from the biological variation database. This is consistent with previous reports that the utility of RCV may be somewhat limited in clinical settings [14]. Additionally, we found that the tendency of the distribution of delta% for each analyte tended to be proportional to CVI. On the other hand, the indexes of individuality were <0.6 in many analytes, and there were no analytes showing values >1.4. This finding is consistent with the fact that CVI is much smaller than CVG [21323] and indicates that analysis of changes in serial clinical chemistry results is more important in interpreting patient condition and progress compared with the conventional reference values [1124]. RCV has limited significance especially for analytes with a large CVI value [1314]. However, considering each CVI, using overlapping CI levels to compare two serial values can be clinically meaningful for monitoring patients.
We also analyzed how the percentage of test results without overlapping CIs changes after correction using the reference interval. Additional analysis showed an overall decrease in percentage in most analytes. However, as the significance of the reference interval may vary from analyte to analyte, application should be conducted according to the characteristics of each analyte or the clinical situation of each laboratory.
This study has some limitations. First, we applied this monitoring system only to outpatients. Hospitalized patients undergo dynamic changes, and their blood analyte levels are significantly altered by treatment, intervention, or sudden physiological changes. Furthermore, the number of blood tests is much higher for hospitalized patients than for outpatients. As hospitalized patients require increased monitoring and analysis results, the LIS server capacity is a huge barrier against actual application. We intend to apply this system to hospitalized patients in the near future.
Second, the levels of some analytes fluctuate in a time-dependent manner. Therefore, for these analytes, time differences should be considered [25]. However, we did not consider the time variable in our monitoring system and compared serial laboratory results only by statistical methods.
Third, some of the CVI values differ significantly according to studies or publications, especially in analytes with a large CVI value [26]. We can use means, medians, or most frequently used values for different purposes. However, as there are no criteria for verifying or correcting them, we have used the values in the Westgard database.
Fourth, we did not use SI units for some analytes. Fig. 1 is a real screen capture of our LIS system. The units are actually assigned according to the requests of clinicians and the judgement of laboratory physicians in our laboratory. Therefore, we could not modify the units to SI units.
Fifth, the concepts of RCV and overlapping CIs are similar in that they consider both the CVA and CVI. However, our monitoring system provides the CI range of two serially measured results. Clinicians and patients can easily visually comprehend the results by comparing the 95% CI ranges to see whether their change is statistically significant. Additionally, as we have demonstrated in the above sections, RCV95% corresponds to the 83.4% CI overlap and RCV99% corresponds to the 93.2% CI overlap. We hypothesize that 95% CI overlap broadens the statistically significant ranges and these two-sided comparisons are expected to overcome the limitations of existing RCVs, reflecting the variability of each test result, especially for analytes with large intra-individual variation. The concept of overlapping CIs has been used in some clinical studies [2021]. We have applied this concept to the LIS system for the first time. Thus, there is no convincing clinical evidence to date. Further studies applying this concept in real clinical situations using actual clinical data reflecting patient disease status and their response to treatment and validating its clinical utility are required.
In conclusion, we applied the concept of overlapping CIs to interpret the changes in serial clinical chemistry test results. We suggest that this strategy can overcome the limitations of existing RCVs and replace them, especially for analytes with a large CVI value.

ACKNOWLEDGEMENTS

None applicable.

Notes

AUTHOR CONTRIBUTIONS: JC and YU designed this research and drafted the manuscript. DMS extracted the data from our hospital computer system, and JC analyzed the data using statistical analysis tools. YU and DMS applied our concept into our LIS system. All authors reviewed this manuscript critically and approved the final manuscript.

CONFLICTS OF INTEREST: No potential conflicts of interest relevant to this article were reported.

RESEARCH FUNDING: None declared.

References

1. Nunes LA, Brenzikofer R, de Macedo DV. Reference change values of blood analytes from physically active subjects. Eur J Appl Physiol. 2010; 110:191–198. PMID: 20446091.
2. Fraser CG. Making better use of differences in serial laboratory results. Ann Clin Biochem. 2012; 49:1–3. PMID: 22130633.
3. Ricós C, Alvarez V, Cava F, García-Lario JV, Hernández A, Jiménez CV, et al. Current databases on biological variation: pros, cons and progress. Scand J Clin Lab Invest. 1999; 59:491–500. PMID: 10667686.
4. Petersen PH, Fraser CG, Jørgensen L, Brandslund I, Stahl M, Gowans EM, et al. Combination of analytical quality specifications based on biological within- and between-subject variation. Ann Clin Biochem. 2002; 39:543–550. PMID: 12564835.
5. Fraser CG, Hyltoft Peterson P, Larsen ML. Setting analytical goals for random analytical error in specific clinical monitoring situations. Clin Chem. 1990; 36:1625–1628. PMID: 2208703.
6. Ricós C, Iglesias N, García-Lario JV, Simón M, Cava F, Hernández A, et al. Within-subject biological variation in disease: collated data and clinical consequences. Ann Clin Biochem. 2007; 44:343–352. PMID: 17594781.
7. Bartlett WA, Braga F, Carobene A, Coşkun A, Prusa R, Fernandez-Calle P, et al. A checklist for critical appraisal of studies of biological variation. Clin Chem Lab Med. 2015; 53:879–885. PMID: 25996385.
8. Widjaja A, Morris RJ, Levy JC, Frayn KN, Manley SE, Turner RC. Within- and between-subject variation in commonly measured anthropometric and biochemical variables. Clin Chem. 1999; 45:561–566. PMID: 10102917.
9. Fraser CG. Data on biological variation: essential prerequisites for introducing new procedures? Clin Chem. 1994; 40:1671–1673. PMID: 8070075.
10. Oosterhuis WP. Analytical performance specifications in clinical chemistry: the holy grail? J Lab Precis Med. 2017; 2:78.
11. Lacher DA, Hughes JP, Carroll MD. Estimate of biological variation of laboratory analytes based on the third national health and nutrition examination survey. Clin Chem. 2005; 51:450–452. PMID: 15590751.
12. Fernández-Grande E, Valera-Rodriguez C, Sáenz-Mateos L, Sastre-Gómez A, García-Chico P, Palomino-Muñoz TJ. Impact of reference change value (RCV) based autoverification on turnaround time and physician satisfaction. Biochem Med (Zagreb). 2017; 27:342–349. PMID: 28694725.
13. Fraser CG. Reference change values. Clin Chem Lab Med. 2011; 50:807–812. PMID: 21958344.
14. Ko DH, Park HI, Hyun J, Kim HS, Park MJ, Shin DH. Utility of reference change values for delta check limits. Am J Clin Pathol. 2017; 148:323–329. PMID: 28967949.
15. Lee J, Kim SY, Kwon HJ, Lee HK, Kim Y, Kim Y. Usefulness of biological variation in the establishment of delta check limits. Clin Chim Acta. 2016; 463:18–21. PMID: 27524506.
16. du Prel JB, Hommel G, Röhrig B, Blettner M. Confidence interval or p-value?: part 4 of a series on evaluation of scientific publications. Dtsch Arztebl Int. 2009; 106:335–339. PMID: 19547734.
17. Hazra A. Using the confidence interval confidently. J Thorac Dis. 2017; 9:4125–4130. PMID: 29268424.
18. European Federation of Clinical Chemistry and Laboratory Medicine. EFLM biological variation database. Updated on Aug 2019. https://biologicalvariation.eu.
19. Westgard QC. Desirable biological variation database specifications. Updated on Jul 2019. https://www.westgard.com/biodatabase1.htm.
20. Austin PC, Hux JE. A brief note on overlapping confidence intervals. J Vasc Surg. 2002; 36:194–195. PMID: 12096281.
21. Knol MJ, Pestman WR, Grobbee DE. The (mis) use of overlap of confidence intervals to assess effect modification. Eur J Epidemiol. 2011; 26:253–254. PMID: 21424218.
22. Jhang JS, Lifshitz MS. Post analysis: medical decision making. In : McPherson RA, Pincus MR, editors. Henry's clinical diagnosis and management by laboratory methods. 23rd ed. St. Louis, MO: Elsevier;2017. p. 73–83.
23. Fraser CG. Inherent biological variation and reference values. Clin Chem Lab Med. 2004; 42:758–764. PMID: 15327011.
24. Fraser CG, Petersen PH. Desirable standards for laboratory tests if they are to fulfill medical needs. Clin Chem. 1993; 39:1447–1453. PMID: 8330406.
25. Park SH, Kim SY, Lee W, Chun S, Min WK. New decision criteria for selecting delta check methods based on the ratio of the delta difference to the width of the reference range can be generally applicable for each clinical chemistry test item. Ann Lab Med. 2012; 32:345–354. PMID: 22950070.
26. Fuentes-Arderiu X. Variability of the biological variation. Scand J Clin Lab Invest. 2002; 62:561–563. PMID: 12512747.

SUPPLEMENTARY MATERIAL

Supplemental Data Fig. S1

Distribution of the absolute value of each delta% in each analyte.
Abbreviations: DPC, delta percent change; ALB, albumin; ALP, alkaline phosphatase; ALT, alanine aminotransferase; AST, aspartate aminotransferase; BUN, urea nitrogen; C3, complement 3; C4, complement 4; CA, calcium; CK, creatine kinase; CL, chloride, CO2, total carbon dioxide; CRE, creatinine, CRP, C-reactive protein; DB, direct bilirubin; FE, iron; GGT; gamma-glutamyl transferase; GLU, glucose; HDL, high-density lipoprotein; Ig, immunoglobulin; K, potassium; LDH, lactate dehydrogenase; LDL, low-density lipoprotein; MG, magnesium; NA, sodium; P, inorganic phosphate; RF, rheumatoid factor; TB, total bilirubin; TCHO, total cholesterol; TG, triglyceride; TP, total protein; UA, uric acid.
alm-40-201-s001.pdf
Fig. 1

An example of our monitoring system for changes in serial laboratory results using the concept of overlapping confidence intervals (CIs). (A) Initial results and (B) follow-up results of the patient. “HL/D/P/I” indicates reference range (high, low)/delta/panic flag and serum index showing a bias >±10% for hemolysis, icteria, or lipemia. “95% CI” indicates the 95% CI of the current result, and “95% CI_O” indicates whether the CIs of the current and previous results overlap. An arrow at “HL/D/P/I” indicates whether the test value has increased or decreased in comparison with the reference interval, and an arrow at “95% CI_O” indicates whether the CIs of the current result have increased or decreased statistically significantly in comparison with the CIs of the previous result.

Abbreviations: ALP, alkaline phosphatase; ALT, alanine aminotransferase; AST, aspartate aminotransferase; SGOT, serum glutamic oxaloacetic transaminase; SGPT, serum glutamic pyruvic transaminase; γ-GT, gamma-glutamyl transferase; CK, creatine kinase; LDH, lactate dehydrogenase; HDL, high-density lipoprotein; LDL, low-density lipoprotein.
alm-40-201-g001
Table 1

Yearly test numbers in 2017 and the CVA and CVI for each analyte

alm-40-201-i001
Test Overall Paired % CVA CVI CVG Index of individuality
ALB 102,643 63,100 61.5 2.46 2.60* 5.10 0.51
ALP 102,528 62,986 61.4 3.22 5.30* 24.50 0.22
ALT 117,098 66,670 56.9 2.44 9.60* 28.00 0.34
AST 117,107 66,682 56.9 2.33 9.50* 21.50 0.44
BUN 100,122 62,432 62.4 2.96 13.90* 18.50 0.75
C3 1,612 498 30.9 2.80 4.80* 12.10 0.40
C4 1,579 492 31.2 3.46 5.50* 28.10 0.20
CA 102,342 63,412 62.0 1.94 2.10 2.50 0.84
CK 48,486 26,726 55.1 1.36 15.40* 31.90 0.48
CL 29,864 20,310 68.0 1.23 1.10* 1.30 0.85
CO2 22,864 16,008 70.0 2.63 4.00 4.80 0.83
CRE 112,024 65,038 58.1 3.08 4.50* 14.00 0.32
CRP 25,780 11,678 45.3 2.30 42.20 76.30 0.55
DB 5,988 1,058 17.7 2.18 36.80 43.20 0.85
FE 2,989 1,544 51.7 1.46 26.50 23.20 1.14
GGT 86,125 45,332 52.6 1.86 8.80* 39.90 0.22
GLU 116,004 75,766 65.3 2.07 4.80* 5.80 0.83
HDL 90,493 51,850 57.3 2.03 7.50* 23.00 0.33
IgA 920 362 39.3 2.77 5.70* 19.60 0.29
IgG 1,067 382 35.8 2.00 3.50* 17.10 0.20
IgM 849 364 42.9 3.50 5.90* 48.50 0.12
K 29,925 20,362 68.0 1.32 4.20* 4.40 0.95
LDH 49,396 27,524 55.7 1.94 5.20* 11.90 0.44
LDL 88,231 50,052 56.7 1.44 8.00* 27.00 0.30
MG 33,230 18,656 56.1 3.16 3.60 6.40 0.56
NA 29,842 20,298 68.0 0.87 0.50* 1.10 0.45
P 102,293 63,378 62.0 2.06 8.15 10.80 0.75
RF 2,078 86 4.1 2.17 8.50 24.50 0.35
TB 102,671 63,114 61.5 2.61 21.80 28.40 0.77
TCHO 127,550 76,390 59.9 1.75 5.50* 15.80 0.35
TG 127,114 76,260 60.0 1.77 20.50* 30.00 0.68
TP 102,539 63,002 61.4 2.79 2.60* 4.50 0.58
UA 39,290 20,284 51.6 2.19 8.60 17.50 0.49

CVA is the analytical coefficient of variation obtained from the IQC program of our clinical chemistry laboratory. CVI and CVG is the intra-individual and inter-individual variation from the *European Federation of Clinical Chemistry and Laboratory Medicine [18] and the Westgard database of biological variation [319]. Index of individuality equals to the ratio of CVI to CVG.

Abbreviations: ALB, albumin; ALP, alkaline phosphatase; ALT, alanine aminotransferase; AST, aspartate aminotransferase; BUN, urea nitrogen; C3, complement 3; C4, complement 4; CA, calcium; CK, creatine kinase; CL, chloride, CO2, total carbon dioxide; CRE, creatinine, CRP, C-reactive protein; DB, direct bilirubin; FE, iron; GGT; gamma-glutamyl transferase; GLU, glucose; HDL, high-density lipoprotein; Ig, immunoglobulin; K, potassium; LDH, lactate dehydrogenase; LDL, low-density lipoprotein; MG, magnesium; NA, sodium; P, inorganic phosphate; RF, rheumatoid factor; TB, total bilirubin; TCHO, total cholesterol; TG, triglyceride; TP, total protein; UA, uric acid.

Table 2

The statistical characteristics of the absolute value of each delta% and RCVs of each analyte

alm-40-201-i002
Analyte Median (IQR) 97.5th percentile RCV
RCV95% RCV99%
ALB (g/dL) 2.7 (2.1–7.0) 23.3 11.19 14.73
ALP (U/L) 7.4 (3.0–15.8) 59.3 19.98 26.30
ALT (U/L) 20.0 (7.7–45.5) 167.0 54.20 71.34
AST (U/L) 13.3 (5.3–30.0) 97.3 34.70 45.68
BUN (mg/dL) 13.4 (5.2–28.9) 85.1 34.53 45.45
C3 (mg/dL) 6.6 (3.0–13.9) 44.4 16.37 21.55
C4 (mg/dL) 9.7 (3.9–19.9) 87.5 26.47 34.84
CA (mg/dL) 2.1 (1.1–4.3) 12.4 7.92 10.43
CK (U/L) 16.4 (6.0–38.9) 181.9 63.31 83.34
CL (mmol/L) 1.0 (0.0–2.2) 8.9 4.76 6.27
CO2 (mmol/L) 4.0 (1.5–8.5) 28.9 13.27 17.47
CRE (mg/dL) 5.5 (2.2–12.1) 55.2 18.57 24.45
CRP (mg/dL) 75.0 (25.0–150.0) 2,249.0 117.15 154.20
DB (mg/dL) 24.2 (9.1–51.0) 261.2 102.18 134.51
FE (μg/dL) 30.1 (12.3–73.3) 498.9 73.57 96.84
GGT (U/L) 16.1 (6.3–42.9) 234.7 37.50 49.36
GLU (mg/dL) 7.3 (2.9–16.8) 72.2 16.55 21.78
HDL (mg/dL) 8.9 (3.4–20.0) 63.1 21.00 27.65
IgA (mg/dL) 9.2 (3.4–19.1) 93.3 16.82 22.14
IgG (mg/dL) 6.5 (2.5–14.9) 71.2 13.65 17.97
IgM (mg/dL) 7.0 (1.6–17.7) 63.3 19.02 25.03
K (mmol/L) 4.0 (2.0–8.2) 27.3 13.27 17.46
LDH (U/L) 5.8 (2.3–12.3) 25.4 24.44 32.17
LDL (mg/dL) 13.2 (5.1–30.8) 111.7 21.99 28.94
MG (mg/dL) 3.7 (1.4–7.6) 23.5 13.28 17.48
NA (mmol/L) 0.7 (0.0–1.4) 5.7 2.93 3.86
P (mg/dL) 7.4 (2.9–16.0) 44.4 23.30 30.67
RF (IU/mL) 12.1 (0.5–16.3) 58.2 24.32 32.01
TB (mg/dL) 19.4 (7.1–44.3) 121.7 60.86 80.11
TCHO (mg/dL) 7.1 (2.7–16.1) 53.8 17.19 22.63
TG (mg/dL) 19.6 (7.4–44.6) 131.3 55.38 72.90
TP (g/dL) 2.8 (1.4–6.1) 18.1 10.86 14.29
UA (mg/dL) 7.7 (2.9–17.8) 70.6 24.60 32.38

Abbreviations: RCV, reference change value; IQR, interquartile range; ALB, albumin; ALP, alkaline phosphatase; ALT, alanine aminotransferase; AST, aspartate aminotransferase; BUN, urea nitrogen; C3, complement 3; C4, complement 4; CA, calcium; CK, creatine kinase; CL, chloride, CO2, total carbon dioxide; CRE, creatinine, CRP, C-reactive protein; DB, direct bilirubin; FE, iron; GGT; gamma-glutamyl transferase; GLU, glucose; HDL, high-density lipoprotein; Ig, immunoglobulin; K, potassium; LDH, lactate dehydrogenase; LDL, low-density lipoprotein; MG, magnesium; NA, sodium; P, inorganic phosphate; RF, rheumatoid factor; TB, total bilirubin; TCHO, total cholesterol; TG, triglyceride; TP, total protein; UA, uric acid.

Table 3

Comparison of the percentages of test results between those exceeding the RCV and those with non-overlapping CIs (%, mean and 95% CI for each)

alm-40-201-i003
Analyte Exceeding the RCV Non-overlapping CIs After correction by reference interval
RCV95% RCV99% 83.4% CI 93.2% CI 95% CI 95% CI
ALB 12.9 (12.5–13.3) 7.8 (7.5–8.1) 13.5 (13.1–13.9) 8.1 (7.8–8.5) 7.0 (6.7–7.3) 1.2 (1.1–1.3)
ALP 18.7 (18.2–19.1) 12.1 (11.7–12.4) 16.0 (15.6–16.4) 10.0 (9.7–10.3) 8.6 (8.3–9.0) 3.2 (3.0–3.3)
ALT 20.0 (19.6–20.4) 12.5 (12.1–12.8) 17.7 (17.3–18.1) 11.8 (11.4–12.1) 10.1 (9.8–10.4) 5.0 (4.8–5.2)
AST 21.3 (20.8–21.7) 14.1 (13.8–14.5) 18.8 (18.4–19.2) 13.0 (12.6–13.4) 11.5 (11.1–11.8) 4.9 (4.7–5.2)
BUN 19.7 (19.3–20.2) 12.5 (12.1–12.8) 15.9 (15.5–16.3) 9.4 (9.1–9.7) 7.9 (7.6–8.2) 3.5 (3.3–3.7)
C3 18.5 (14.1–23.3) 12.0 (8.0–16.1) 16.9 (12.4–21.7) 9.2 (6.0–12.9) 7.6 (4.4–11.2) 0.1 (0.0–0.1)
C4 14.6 (10.2–19.1) 10.6 (7.3–14.2) 12.6 (8.5–16.7) 7.3 (4.1–10.2) 6.1 (3.3–8.9) 0.1 (0.0–0.1)
CA 8.3 (8.0–8.6) 4.1 (3.9–4.3) 7.9 (7.7–8.2) 4.3 (4.1–4.6) 3.4 (3.2–3.6) 2.3 (2.2–2.5)
CK 13.9 (13.4–14.6) 9.0 (8.5–9.5) 9.2 (8.7–9.7) 5.0 (4.6–5.4) 4.0 (3.7–4.4) 0.9 (0.8–1.0)
CL 10.1 (9.5–10.7) 5.7 (5.3–6.2) 10.5 (9.9–11.1) 5.5 (5.1–6.0) 4.8 (4.5–5.3) 1.1 (1.0–1.2)
CO2 13.4 (12.7–14.2) 8.2 (7.6–8.8) 12.4 (11.6–13.1) 7.5 (6.9–8.1) 6.3 (5.7–6.8) 1.1 (1.0–1.3)
CRE 14.3 (14.0–14.7) 9.7 (9.3–10.0) 12.8 (12.4–13.2) 8.7 (8.4–9.0) 7.8 (7.5–8.1) 2.2 (2.1–2.4)
CRP 28.4 (27.3–29.6) 24.1 (23.1–25.2) 27.4 (26.3–28.6) 16.5 (15.7–17.5) 12.3 (11.5–13.2) 1.7 (1.5–1.8)
DB 9.5 (7.0–11.9) 6.2 (4.2–8.3) 3.4 (1.9–4.9) 0.9 (0.2–1.9) 0.8 (0.2–1.5) 0.0 (0.0–0.0)
FE 24.7 (21.6–27.7) 19.3 (16.7–22.0) 16.2 (13.7–18.8) 9.3 (7.3–11.4) 6.6 (4.8–8.4) 0.1 (0.1–0.2)
GGT 28.4 (27.8–29.0) 22.1 (21.6–22.7) 25.2 (24.7–25.8) 19.5 (19.0–20.0) 17.9 (17.4–18.4) 5.4 (5.1–5.6)
GLU 25.4 (25.0–25.9) 18.7 (18.3–19.1) 23.3 (22.9–23.7) 16.6 (16.3–17.0) 14.7 (14.4–15.1) 13.6 (13.3–14.0)
HDL 23.6 (23.1–24.1) 16.7 (16.3–17.2) 21.6 (21.1–22.0) 15.2 (14.8–15.6) 13.6 (13.2–14.0) 8.9 (8.7–9.2)
IgA 28.2 (21.5–34.8) 22.7 (17.10–28.70) 26.0 (19.4–32.6) 21.0 (16.0–27.1) 21.0 (16.0–27.1) 0.1 (0.0–0.1)
IgG 28.3 (22.0–35.1) 19.4 (14.1–25.7) 25.1 (14.7–25.7) 18.3 (13.1–24.6) 16.8 (11.5–22.5) 0.1 (0.0–0.1)
IgM 23.1 (17.0–29.7) 14.3 (9.3–19.2) 19.8 (13.7–25.3) 9.9 (6.0–14.3) 9.3 (5.5–13.7) 0.0 (0.0–0.0)
K 12.9 (12.3–13.6) 8.1 (7.6–8.6) 12.4 (11.7–13.0) 7.8 (7.2–8.3) 6.7 (6.2–7.2) 1.2 (1.1–1.3)
LDH 9.1 (8.6–9.6) 5.2 (4.9–5.6) 7.2 (6.8–7.6) 4.0 (3.7–4.3) 3.4 (3.1–3.7) 0.7 (0.6–0.8)
LDL 34.1 (33.5–34.7) 26.7 (26.1–27.3) 31.7 (31.1–32.2) 24.2 (23.6–24.7) 21.8 (21.3–22.3) 3.9 (3.7–4.1)
MG 9.5 (8.9–10.1) 5.5 (5.0–5.9) 8.4 (7.9–9.1) 4.5 (4.1–5.0) 3.8 (3.3–4.1) 0.2 (0.2–0.3)
NA 8.0 (7.5–8.5) 5.5 (5.1–5.9) 8.1 (7.6–8.7) 5.5 (5.1–5.9) 5.3 (4.9–5.8) 0.9 (0.8–1.0)
P 14.3 (13.9–14.7) 8.1 (7.8–8.3) 13.0 (12.6–13.3) 7.6 (7.3–7.9) 6.3 (6.0–6.5) 3.5 (3.3–3.7)
RF 9.3 (2.3–18.6) 9.3 (2.3–18.6) 14.0 (4.7–25.6) 7.0 (0.0–16.3) 4.7 (0.0–11.6) 0.0 (0.0–0.0)
TB 14.8 (14.5–15.2) 7.0 (6.7–7.2) 13.9 (13.6–14.3) 8.3 (8.0–8.6) 6.7 (6.4–6.9) 1.9 (1.3–1.5)
TCHO 23.3 (22.9–23.7) 16.7 (16.3–17.0) 21.8 (21.4–22.2) 15.5 (15.2–15.9) 13.9 (13.6–14.3) 7.3 (7.1–7.6)
TG 18.2 (17.8–18.6) 10.4 (10.1–10.7) 15.2 (14.9–15.6) 9.2 (8.9–9.4) 7.7 (7.4–7.9) 5.0 (4.8–5.3)
TP 10.2 (9.9–10.5) 5.2 (5.0–5.4) 10.6 (10.2–11.0) 5.8 (5.6–6.1) 4.7 (4.5–4.9) 2.1 (2.0–2.3)
UA 16.9 (16.2–17.7) 11.6 (11.0–12.3) 14.8 (14.2–15.6) 9.9 (9.3–10.5) 8.7 (8.1–9.2) 1.4 (1.3–1.6)

Abbreviations: RCV, reference change value; CI, confidence interval; ALB, albumin; ALP, alkaline phosphatase; ALT, alanine aminotransferase; AST, aspartate aminotransferase; BUN, urea nitrogen; C3, complement 3; C4, complement 4; CA, calcium; CK, creatine kinase; CL, chloride, CO2, total carbon dioxide; CRE, creatinine, CRP, C-reactive protein; DB, direct bilirubin; FE, iron; GGT; gamma-glutamyl transferase; GLU, glucose; HDL, high-density lipoprotein; Ig, immunoglobulin; K, potassium; LDH, lactate dehydrogenase; LDL, low-density lipoprotein; MG, magnesium; NA, sodium; P, inorganic phosphate; RF, rheumatoid factor; TB, total bilirubin; TCHO, total cholesterol; TG, triglyceride; TP, total protein; UA, uric acid.

*For the units used, see Table 2.

TOOLS
Similar articles