

 PDF
PDF ePub
ePub Citation
 Print
Print


INTRODUCTION
Surgical resection is rarely feasible upon diagnosis among patients with advanced gastric cancer. Therefore, palliative radiotherapy or chemotherapy is often regarded as the only choice to prolong the survival of these patients. The combination of fluoropyrimidine and platinum is the first-line choice for chemotherapy in gastric cancer.
Capecitabine is an oral prodrug of fluoropyrimidine agents. It is metabolized to its active form, 5-fluorouracil (5-FU), through enzymatic processes including conversion to 5-deoxy-5-fluorocytidine by carboxylesterase and then to 5-deoxy-5-fluorouridine by cytidine-deaminase. This is followed by the conversion of 5-deoxy-5-fluorouridine to the active drug 5-FU by thymidine phosphorylase (TP) [1]. The localization of TP to liver and gastric tumors allows for the targeted intra-tumoral release of 5-FU. In addition, TP is an important enzyme involved in nucleoside metabolism, maintenance of healthy mitochondria, and the recovery of cells from pathologic stress [2].
Dihydropyrimidine dehydrogenase (DPD) is a rate-limiting enzyme that catabolizes 5-FU into its inactive form. Studies have indicated that inactivation of DPD in tumor tissue is associated with a better response to 5-FU and that higher DPD expression in tumor cells contributes to 5-FU resistance [34]. DPD expression and its association with the effectiveness of fluoropyrimidine chemotherapy in gastric cancer patients have also been reported in palliative, adjuvant, or neoadjuvant treatment [5678910]. In this regard, inhibitors of DPD prolong 5-FU concentrations in tumor tissues and enhance the efficacy of fluoropyrimidine in the chemotherapy of gastric cancer [11].
In the current study, we retrospectively compared the efficacy of 2 different chemotherapy regimens, capecitabine plus oxaliplatin (CAPOX) and S-1 plus oxaliplatin (SOX), in the treatment of 86 patients with advanced gastric cancer. The expression of TP and DPD in gastric tumor tissues was assessed and the potential efficacy association between TP or DPD level and the 2 chemotherapeutic regimens was evaluated.
MATERIALS AND METHODS
Patients
The study was conducted at the People's Hospital of Xinjiang Uygur between April 2015 and April 2016. The following patients were included: 1) patients in whom advanced gastric cancer was confirmed by pathological diagnosis and basic evaluation by a radiological examination; 2) patients who were not eligible for surgical resection; 3) patients for whom adequate biopsy tissue suitable for an immunohistochemical examination could be obtained; 4) patients with an Eastern Cooperative Oncology Group performance status score of <2; and 5) patients with an estimated survival time longer than 3 months. The following patients were excluded from the study: 1) patients who had previously received chemotherapy; 2) patients who had severe liver and kidney dysfunction or other systemic diseases and were thus not eligible for chemotherapy; and 3) patients who were allergic to capecitabine, S-1, or oxaliplatin. A total of 86 patients were finally enrolled in the current study. The study protocol was approved by the ethics committee of the People's Hospital of Xinjiang Uygur (KY2019032806). Written informed consent was obtained from each patient or their close relatives. The general characteristics of the patients enrolled in the study are listed in Table 1.
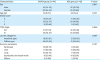
Table 1
Pathological characteristics of patients
Chemotherapy
Eighty-six patients were randomly treated with CAPOX (44 patients) or SOX (42 patients). In the CAPOX group, oral capecitabine (1,250/m2, bid; Roche China, Shanghai, China) was administered for 14 days along with an intravenous injection of oxaliplatin (0.1 g/100 mL; Sichuan Meida Kangjia Le Pharmaceutical Industry, Chengdu, China) on day 1. In the SOX group, tegafur/gimeracil/oteracil (40 mg, bid; Taiho Pharmaceutical China, Beijing, China) was administered for 14 days along with an intravenous injection of oxaliplatin (0.1 g/100 mL) on day 1. One therapeutic period consisted of 21 days and each patient completed at least 2 therapeutic periods.
Immunohistochemistry of TP and DPD
Expression of TP and DPD was examined by immunohistochemical staining according to the manufacturer's (Shanghai Uprising Test Biotechnology, Shanghai, China) instructions. Briefly, tumor tissues were embedded in paraffin and cut into 4 µm slices. The slices were deparaffinized, rehydrated, and then subjected to an antigen retrieval procedure with phosphate-buffered saline. The samples were treated with 3% hydrogen peroxide followed by blocking with normal human serum. Thereafter, the samples were incubated with a primary antibody (1:100 dilution, rat anti-human TP monoclonal antibody, Santa Cruz Biotech, Dallas, TX, USA; or rat anti-human DPD monoclonal antibody, Roche, Indianapolis, IN, USA) overnight at 4°C. After washing, a secondary antibody, rabbit anti-rat antibody (Dako, Glostrup, Denmark), was allowed to bind at room temperature (25°C) for 30 minutes. The sections were developed with 3,3′diaminobenzidine reagent followed by counterstaining with hematoxylin. Protein expression was assessed under a high-power microscope. A total of 100 cells were counted in 5 randomly selected high-power fields on each slide. A sample was considered positive if staining was observed in more than 20% of the cells.
Follow-up
Patients were followed up by weekly telephone calls for the first month. They were then surveyed every 2 months for up to 1 year. Overall survival (OS) and progression-free survival (PFS) were determined and compared between the TP and DPD expression groups. Complete remission (CR), partial remission (PR), stable disease (SD), and progressive disease were determined according to Response Evaluation Criteria in Solid Tumors 1.1. The objective remission rate (ORR) was calculated using the following formula: ORR = CR + PR. The disease control rate (DCR) was calculated as follows: DCR = CR + PR + SD.
Statistical analysis
Statistical analyses were performed using SPSS 22.0 and GraphPad Prism 6 (GraphPad Software, San Diego, CA, USA). Data are expressed as mean±standard deviation values. The Student's t-test was used to compare paired data, and the chi-square test was used to evaluate distribution. Kaplan-Meier survival curves were plotted to compare PFS and OS as well as hazard ratios (HRs) and 95% confidence intervals (CIs). A P-value of <0.05 was considered significant.
RESULTS
Comparison of treatment regimens
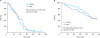
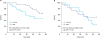
As shown in Table 2, the ORRs in the CAPOX- and SOX-treated groups were 52.2% and 47.62%, respectively, and the corresponding DCRs were 72.73% and 73.81%. Intergroup differences were not significant (P>0.05). With regard to the comparison of OS or PFS, intergroup differences in PFS and OS were not significant (HR, 1.119; 95% CI, 0.739–1.741; P=0.586; Fig. 1A and HR, 0.855; 95% CI, 0.481–1.511; P=0.588; Fig. 1B, respectively).
Table 2
Comparison of short-term therapeutic effect

Fig. 1
Comparison of PFS and OS rates in the patients treated with CAPOX and SOX. (A) PFS rate. (B) OS rate. Horizontal axes: time (weeks); vertical axes: survival rate (%).
CAPOX = capecitabine plus oxaliplatin; SOX = S-1 plus oxaliplatin; HR = hazard ratio; CI = confidence interval; PFS = progression-free survival; OS = overall survival.
Expression of TP and DPD in gastric cancer
Detection of TP and DPD expression in gastric cancer specimens is representatively shown in Fig. 2A and B, respectively. A sample was considered positive if staining was observed in at least 20% of the tumor cells. The relationships between TP and DPD expression and the most significant prognostic factors, such as tumor, node, metastasis stage, are listed in Table 3. The number of TP-positive patients in stage IV was significantly higher than that of TP-negative patients (66.7% vs. 34.09%, P<0.05). Lauren's classification of the patients indicated that the intestinal type of gastric cancer was significantly associated with positive DPD expression rather than with negative DPD expression (71.74% vs. 40.00%, P<0.05).
Fig. 2
TP and DPD expression in gastric cancer specimens. (A) TP expression is shown in the left panel. (B) DPD expression is shown in the right panel. Positivity was defined as staining of at least 20% of the tumor cells.
TP = thymidine phosphorylase; DPD = dihydropyrimidine dehydrogenase.

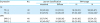
Table 3
Expression of TP and DPD in advanced gastric cancer and their correlation with Lauren's classification and TNM stage
Correlation of TP and DPD expression in patients treated using different regimens with survival
As shown in Tables 4 and 5 among the TP-positive patients, the ORR (57.14%) and DCR (80.95%) in the CAPOX-treated patients were significantly higher than those in the SOX-treated patients (ORR: 38.10%, DCR: 61.90%, P<0.05). In contrast, among the DPD-positive patients, the ORR and DCR in those treated with SOX (ORR: 60.87%, DRC: 78.26%) were significantly higher than those in the CAPOX-treated patients (ORR: 43.48%, DCR: 65.22%, P<0.05). In the TP- or DPD-negative patients, however, the outcomes of SOX and CAPOX treatment were not significantly different.
Table 4
Comparison of short-term therapeutic effects of the 2 treatments in TP-positive or TP-negative patients

Values are presented as number (%).
TP = thymidine phosphorylase; CR = complete remission; PR = partial remission; SD = stable disease; PD = progressive disease; ORR = objective remission rate (CR + PR); DCR = disease control rate (CR + PR + SD); CAPOX = capecitabine plus oxaliplatin; SOX = S-1 plus oxaliplatin.
*P<0.05 compared to TP-positive patients treated with CAPOX.
Table 5
Comparison of short-term therapeutic effect of the 2 treatments in DPD-positive or DPD-negative patients

Values are presented as number (%).
CR = complete remission; PR = partial remission; SD = stable disease; PD = progressive disease; ORR = objective remission rate (CR + PR); DCR = disease control rate (CR + PR + SD); DPD = dihydropyrimidine dehydrogenase; CAPOX = capecitabine plus oxaliplatin; SOX = S-1 plus oxaliplatin.
*P<0.05 compared to that of the DPD-positive patients treated with CAPOX.
The survival analysis indicated that among the TP-positive patients, the response to CAPOX was better than that to SOX as evidenced by the OS rates. Among the TP-positive patients, the CAPOX-treated group showed significantly longer survival than that shown by the SOX-treated group (HR, 0.447; 95% CI, 0.179–0.978; P=0.046; Fig. 3A). However, there was no significant difference in the OS rate in the TP-negative patients treated with CAPOX or SOX (HR, 1.514; 95% CI, 0.671–3.455; P=0.318; Fig. 3B).
Fig. 3
Correlation between TP expression and survival in different regimens. (A) Patients with positive TP expression. (B) Patients with negative TP expression. Horizontal axes: time (weeks); vertical axes: overall survival rate (%).
CAPOX = capecitabine plus oxaliplatin; SOX = S-1 plus oxaliplatin; TP = thymidine phosphorylase; OS = overall survival; HR = hazard ratio; CI = confidence interval.
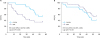
In contrast, among the DPD-positive patients, the response to SOX treatment was better than that to CAPOX treatment as indicated by the OS rate. Furthermore, the survival of the SOX-treated patients was significantly favorable compared to that of the CAPOX-treated patients (HR, 2.020; 95% CI, 1.019–4.838; P=0.049; Fig. 4A). In DPD-negative patients, however, there was no significant difference in the OS rate between those treated with SOX and those treated with CAPOX (HR, 1.441; 95% CI, 0.662–3.176; P=0.361; Fig. 4B).
Fig. 4
Correlation between DPD expression and survival in different regimens. (A) Patients with positive DPD expression. (B) Patients with negative DPD expression. Horizontal axes: time (weeks); vertical axes: OS rate (%).
CAPOX = capecitabine plus oxaliplatin; SOX = S-1 plus oxaliplatin; DPD = dihydropyrimidine dehydrogenase; OS = overall survival; HR = hazard ratio; CI = confidence interval.
DISCUSSION
Gastric cancer is the second most common type of cancer in China. Its annual prevalence in the country has been reported to be approximately 400,000, with mortality reported in 300,000 cases, accounting for almost half of the related morbidity and mortality reported worldwide [1213]. In the current study, a total of 86 patients with advanced gastric cancer were randomly treated with either CAPOX or SOX. After 2 therapeutic periods, neither ORR nor DCR was significant different between the 2 treatment groups. TP or DPD expression was assessed in gastric cancer tissues. Among the TP-positive patients, the OS, ORR, and DCR in those treated with CAPOX were significantly higher than those in the patients treated with SOX. On the other hand, among the DPD-positive patients, the OS, ORR, and DCR in SOX-treated patients were significantly higher than those in the CAPOX-treated patients. These findings indicated that TP and DPD could be predictive markers for CAPOX and SOX treatment regimens, respectively, in gastric cancer patients.
Oral fluoropyrimidine and capecitabine are often used to treat gastric cancer. Capecitabine is a prodrug, which is converted to 5-FU through the action of different enzymes. TP is a rate-limiting enzyme in the process of capecitabine conversion to 5-FU. DPD is also a rate-limiting enzyme and catabolizes 5-FU. Thus, the sensitivity of cancer cells to capecitabine may be augmented in the presence of high TP expression but may decrease in the presence of DPD [1415]. S-1 (also known as TS-1) is an oral fluoropyrimidine formulation that combines 5-chloro-2,4-dihydroxypyridine and potassium oxonate; it can enhance the antitumor effect of 5-FU by inhibiting DPD and reducing the catabolism of 5-FU [16]. Because the biological effects of these 2 enzymes are known, TP and DPD expression was examined in gastric cancer tissues in this study. Interestingly, the number of patients with stage IV cancer was significantly higher among the TP-positive patients than among the TP-negative patients. In addition, DPD-positive patients predominantly showed intestinal type of gastric cancer compared to the DPD-negative patients. Consistent with these findings, higher DPD expression levels have been documented in tumor tissue than in normal tissue [1718].
The relationship between TP or DPD expression and the prognosis for patients treated with capecitabine-based regimens for gastric cancer was also analyzed in the current study. While several studies reported better outcomes of gastric cancer when the expression of TP was high in the tumor sample [171819], the current study strikingly showed that among the TP-positive patients, the response to CAPOX was superior to the response to SOX. On the other hand, among the DPD-positive patients, the response to SOX was better than that to CAPOX. However, in the TP- or DPD-negative patients, there was no significant difference in the OS rate between patients treated with SOX and those treated with CAPOX.
Predictive markers are applied to identify subpopulations of patients that are most likely to respond to a given therapy, which allows clinicians to select patients who could be sensitive to or resistant to a particular therapy. One of the limitations of the current study was that a small number of patients was enrolled in this retrospective study. Thus, neither TP nor DPD could be used as a predictive marker to identify the patients who responded relatively better to CAPOX or SOX. Nevertheless, on the basis of their crucial role in the conversion of capecitabine to 5-FU and the catabolism of 5-FU, TP and DPD could serve as predictive factors for the potential benefit of using 5-FU-based treatments in patients with gastric cancer. In conclusion, in this study, we assessed the therapeutic effects of CAPOX and SOX in advanced gastric cancer. We also provided clinical evidence for the choice of the 2 treatment regimens commonly used in gastric cancer: the CAPOX regimen is suggested for TP-positive patients while DPD-positive patients might be treated with the SOX regimen.
 XML Download