

 PDF
PDF ePub
ePub Citation
 Print
Print


INTRODUCTION
Ankle sprains are one of the most common musculoskeletal injuries that affect both athletic and non-athletic populations, with approximately 850,000 new ankle sprains each year in the United States.1) Following ankle sprains, 70% of individuals experience prolonged, recurrent symptoms, which can ultimately progress to chronic ankle instability (CAI).23) This condition can result in long term functional limitations, such as the inability to perform occupational duties and sporting activities, while also making an individual more susceptible to ankle osteoarthritis, and a diminished quality of life.45) This makes the screening, assessment, and treatment of CAI, and the impairments it creates, a paramount topic for research in the field of rehabilitation science.
Dynamic balance deficits in unilateral excursion distances, latency in reaction times, and postural sway are some of the most frequently encountered impairments in the clinical environment for patients affected by CAI. These deficits persist due to an impairment in one of the three primary systems that the human body uses to successfully control balance—the visual, vestibular, and especially the somatosensory system.67) Regardless of the mechanism behind balance deficits in CAI, ankle proprioception is a valuable source of somatosensory input from the foot and has been shown to impact dynamic balance in individuals with CAI, making it a valid mechanism to guide current research.8)
Ligamentous and retinacular tissues have both been shown to have proprioceptive qualities that, when impaired, may play a role in the resulting balance impairments.910) The anterior talofibular ligament (ATFL) is the most commonly injured ligament during lateral ankle sprains, while injury to the superior extensor ankle retinaculum (SEAR) has also shown to contribute to chronic pain and instability in CAI.11) Injury to these structures can ultimately lead to abnormal thickening and deposition of new fibrous bundles, or scar tissue, as this tissue is aligned based on joint forces following injury.91112) Based on these findings, previous research has shown that the ATFL in individuals with CAI is 16% thicker than that of normal controls, while imaging studies have also noted increased SEAR densification on cadaveric specimens.913)
The impact of CAI on the anatomy and physiology of the ankle should be analyzed from the perspectives of clinical measurement of tissue thickness and assessment of tissue quality, which can be performed using musculoskeletal ultrasound (MSKUS). MSKUS can also be used as an accurate diagnostic tool that is more time efficient than magnetic resonance imaging in evaluating musculotendinous and ligamentous pathologies.14) Hua et al.15) determined that the accuracy of MSKUS examination for detection of ATFL injury was 95.2%, with a sensitivity of 97.7%, specificity of 92.3%, and a positive and negative likelihood ratio of 12.7 and 0.025, respectively.
While there have been studies that examined the effects of CAI on ATFL thickness and CAI on balance deficits, there is a lack of research directly linking increased ligament/fascial thickness as measured by MSKUS to dynamic balance deficits in individuals with CAI. The purpose of this study was to utilize MSKUS for assessing the relationship between ATFL/SEAR thickness and performance on dynamic balance testing.
MATERIALS AND METHODS
1. Participants
This study was a year-long causal-comparative research design examining the relationship between CAI, ATFL and SEAR thickness, and balance measures. Twenty-nine participants between the ages of 18 and 35 years were recruited for this study, including 14 males and 15 females. These participants were recruited via word of mouth and informational flyers posted on two university campuses. Individuals who agreed to be a part of the study were required to meet the following inclusion criteria: 18 to 35 years of age, free of any lower extremity injuries in the past 3 months, and free of any medically-diagnosed neurological or balance disorders. Individuals were excluded from the study if they met any of the following criteria: participant perception of bilateral CAI, lower extremity amputation, lower extremity fracture, vestibular disorders, undergoing current treatment for inner ear/sinus/upper respiratory infection/head cold, cerebral concussion within the past 3 months, self-reported pregnancy, known allergy to water-based ultrasound gel, or lack of medical clearance to participate. This study was approved by Radford University Institutional Review Board (IRB).
Participants filled out the Physical Activity Readiness Questionnaire (PAR-Q), to confirm that they were ready for physical activity. After the participants were cleared, they were issued the Cumberland Ankle Instability Tool (CAIT), which is a nine-item questionnaire that is scored based on a 30-point scale used to assess the participant's perception regarding the severity of their functional ankle instability, if present.2) The accuracy of manual assessment in order to categorize CAI is not demonstrated in the literature, therefore this study utilized the CAIT in order to get a report of the participants' perception of ankle instability.
Participants scoring less than or equal to 25 were placed in the CAI group (experimental group), while those with scores greater than 25 were placed in the control group. If an individual scored less than or equal to 25 for both ankles, this individual was excluded from the study after completion of the CAIT. Next, the participants' anthropometrics including height, body weight, and leg length were measured, followed by a brief orientation to the various tests that would be conducted during the study.
The standardized order above for initial testing procedures was used, followed by MSKUS and balance assessments. Once a participant moved on to the balance assessment portion of the study, randomization between the Y balance test (YBT) and NeuroCom Balance Manager (Natus, Pleasanton, CA, USA) Motor Control and Adaptation Tests16) was performed via random number generation, to eliminate any order effect that the more challenging test (YBT) might create. Individuals that were assigned a “1” went to the YBT station first, while individuals assigned a “2” went to the NeuroCom Balance Manager Motor Control and Adaptation Test station first. After the first balance assessment, the participant completed the remaining balance assessment, at which time their participation in the study was complete.
2. Procedures
1) Musculoskeletal ultrasound
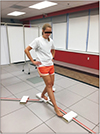
All measurements for MSKUS analysis of the ATFL and SEAR were taken by one researcher throughout the entire course of the study for consistency. The thickness of the ATFL and SEAR of both ankles was measured with the SonoSite MTurbo (Fugifilm Sonosite, Inc., Bothell, Washington, USA) ultrasound unit with the knee flexed to approximately 70° to 90° and the ankle in moderate plantar flexion and slight inversion to get a clear image of the ligament and to ensure image consistency across participants (Fig. 1). The researcher measured the thickness of the ATFL at its midpoint on each of three images taken per ankle. SEAR thickness was taken directly superficial to the tibialis anterior muscle belly, at the same location for each image relative to the muscle and underlying tibia. The researcher who conducted MSKUS assessment was blinded from seeing the thickness measurements in order to prevent the bias of trying to achieve a consistent thickness measurement on each side. After analysis was complete, a second researcher recorded thickness measurements on the data sheet. Following MSKUS assessment, the participant moved to the first randomized balance assessment procedure.
2) Y balance test
One researcher demonstrated the YBT procedure and instructed all participants on how to complete the test for the duration of this study. During testing, the participant was barefoot in order to remove sensory input or stability provided by socks and shoes (Fig. 2). Participants were allowed three practice trials on each leg, in each direction–anterior, posteromedial, and posterolateral–followed by a 2-minute rest period prior to formal testing. Participants were then instructed to place their right foot on the center of the stance plate with the toes just behind the positioning line. While the participant maintained their foot on the platform without lifting their heel, they were instructed to push the reach indicator as far as possible with the left leg. The reach foot needed to maintain contact with the reach indicator while in motion without kicking the indicator forward or using the reach indicator for stance support. After maximal reach was achieved, the participant returned the reach foot to the starting position under control and without loss of balance. The participant performed three trials in the anterior direction before alternating to stand on the left foot and repeating the sequence. The same order of testing (right test leg then left test leg) was followed for the posteromedial direction, and finally the posterolateral direction. The reach distance was measured at the near edge of the reach indicator to the nearest 0.5 centimeters. Any trials were repeated if the participant: (1) failed to maintain single-limb balance on the platform (i.e., touched the reach foot to the floor or stepped off of the stance platform altogether), (2) failed to maintain reach foot contact with the reach indicator on the target area while in motion (i.e., kicked the reach indicator), (3) used the reach indicator for support during balance, or (4) failed to return the reach foot to the starting position under control. If a participant failed more than four directional attempts on one test leg, they received a score of zero for that test leg, in that direction. During the testing process, participants were carefully guarded by a researcher in the event of significant loss of balance during the single limb reach. The distance values from each trial were recorded on the data sheet. If the participant had not yet completed the NeuroCom assessment at this point, they were instructed to proceed to this station. If NeuroCom assessment had already been completed by the participant, they were instructed that testing was complete, and they could leave the testing area.
3) NeuroCom Balance Manager
Two researchers were located at the NeuroCom Balance Manager testing station to guard the participant and operate the computer during testing. If the participant received a “1” from the random number generator during the intake, they performed the Motor Control Test first, and if they received a “2”, they performed the Adaptation Test first. Prior to conducting any testing, the participant was assisted into a standard safety harness that was connected to the steel frame of the NeuroCom to prevent a fall in the event of a significant loss of balance. During the Motor Control Test, the force-plate translated forward and backward at an internally determined random interval three separate times at three amplitudes: small, medium, and large. The NeuroCom used information gathered from the force-plate to determine reaction times, symmetry of reaction, and amplitude scaling. The Adaptation Test measured reaction time, in the form of sway energy, in response to the force-plate tilting up or down. The force-plate tilted up and down five times in each direction at internally determined random intervals. Following completion of this station, if they had not yet completed YBT assessment, they were instructed to continue to the YBT station. If YBT assessment had already been completed by the participant, they were instructed that testing was complete, and they may leave the testing area.
3. Statistical analysis
Prior to conducting this study, an a priori power analysis was conducted to determine the necessary sample size using G*power 3.1.17) This indicated that a sample size of 15 was necessary to achieve 0.8 power, at an a probability of 0.05, based on a similar study conducted by Liu et al.,13) to demonstrate a 16% difference in ATFL thickness between groups. Next, a Shapiro-Wilk test of normality was completed on the variables used during this study in order to assure normal distribution of the data. Data that were determined as normally distributed were analyzed using parametric statistics while non-normally distributed data were analyzed using non-parametric statistics. Next, averages were taken for all measurements in which two or more trials were completed in order to condense information into one variable for statistical analysis. Data were further organized according to right and left ankles in those without CAI and according to unstable and stable sides in those with CAI. Additionally, differences between limbs for all continuous data measurements were calculated and these values were used to compare differences between those with and without CAI. Next, multiple two-way ANOVAs were run with post hoc analyses, to determine if there was a statistically significant difference between ATFL thickness, SEAR thickness, and balance measures among participants with and without CAI. ATFL and SEAR thickness was examined according to sprain history (no history of sprains, bilateral ankle sprains, or unilateral sprains) using chi square analysis. To determine if the presence or absence of CAI was significantly related to a change in balance measures or significantly related to a difference in ATFL/SEAR thickness, independent t-tests or Mann—Whitney U-tests were used. Pearson and Spearman correlations were run, depending on the normality of the data, in order to determine if correlations existed between any of the continuous data points. Finally, to determine reliability of ultrasound measurements for ATFL and SEAR thickness, post-hoc ICCs were conducted. These tests were conducted using IBM SPSS Statistics for Windows, ver. 22.0 (IBM Corp., Armonk, NY, USA). Statistical significance was determined a priori as p<0.05.
RESULTS
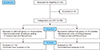
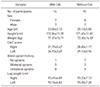
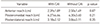
Two groups were defined using CAIT scores, indicating those with and without CAI (Fig. 3). No statistically significant differences were noted in demographic data between groups in age, height, body weight, and leg length (Table 1). ATFL/SEAR thickness was not different between or within those with and without CAI (Table 2), and there was no difference in ATFL/SEAR thickness between the ankle sprain categories (no sprains, bilateral sprains, and unilateral sprains), χ2=0.92, p=0.62, χ2=2.81, p=0.24, respectively. There were no statistically significant findings in performance differences on YBT and the NeuroCom Balance Manager dynamic balance assessments between ankle stability groups and ankle sprain history categories, χ2 between 0.08 and 0.92, p-values
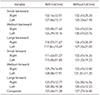
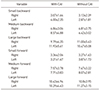
between 0.12 and 0.91. There was no statistically significant difference between the groups in any of the three directions (anterior, posteromedial, posterolateral) nor the composite scores on the YBT (Tables 3, 4). Additionally, on the NeuroCom, sway energy for upwards or downwards forces were comparable between those with and without CAI (p=0.15 and p=0.36, respectively), while composite latencies were no different (p=0.68) (Tables 5, 6, 7). There was a significant moderate correlation between average left SEAR thickness and large backward left amplitude (r=0.54, p=0.003), as well as large forward left amplitude on the NeuroCom (r=0.51, p=0.006). However, this did not take into account ankle sprain history or presence/absence of CAI. MSKUS measurements did show a moderate to very good intra-rater reliability. Right and left SEAR thickness consistency measurements were determined to be 0.754 and 0.702, respectively (p<0.05), which is indicative of moderate reliability. The measurements of ATFL thickness held very good reliability for MSKUS measurements at 0.91 and 0.86 for the right and left ATFL, respectively (p<0.05).
DISCUSSION
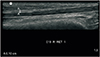
The thickness of the ATFL was not different between participants with CAI and those without CAI when comparing between and within groups. However, there was a trend suggesting that the ATFL for the unstable ankles in the group with CAI was thinner when compared to the same participants' stable ankles as well as both of the participants' ankles in the control group. This is not consistent with the findings in the study published by Liu et al.13) which found that the ATFL was thicker in previously injured ankles in the experimental groups when compared to the healthy control group. One possible explanation for this difference could stem from variance in ATFL measurement technique between the present study and the Liu et al.13) study. During MSKUS measurements in the present study, only linear, hyperechoic tissue structures with definite borders consistent with ligamentous tissue were captured (Fig. 4A), while notable scar tissue with ill-defined borders surrounding the linear tissues was intentionally excluded from the measurement for consistency and accuracy as it could not truly be considered “ligamentous” (Fig. 4B). The exclusion of these inconsistent tissues could be the reason for the difference in outcomes between these studies, however a description of how ligamentous tissues were defined and captured was not outlined by Liu et al.13) Future studies may need to be conducted with a consistent process of how to capture thickness of the entire ATFL structure, including the fibrotic scar tissue which appears non-linear, and compare this to linear structures to resolve discrepancies in measurement.
Similar to that of the ATFL, there was no difference in SEAR thickness between those with CAI and those without CAI, nor was there a difference between the stable ankle of those with CAI compared to their unstable ankle. Similarly, for those without CAI, the right and left SEAR thickness measures were comparable. These findings may be attributed to the fact that the SonoSite MTurbo ultrasound unit that was used to collect these measures only reports numeric findings to the nearest hundredth of a centimeter, as can be seen in Fig. 5. However, in order to identify differences in such a thin structure like the SEAR, the MSKUS unit would need to report measures to at least the thousandth or ten-thousandth place to capture the densification that Stecco et al.9) noted in SEAR thickness following injury. Further investigation with more sensitive technology may progress the current research to a more definitive conclusion.
No difference could be identified in the performance on the YBT between those with and without CAI or those with no sprains, bilateral sprains, or unilateral sprains. These findings are not consistent with previous research that has found posteromedial and anterior reach directions, or posteromedial alone, are able to detect CAI.18) There was no statistically significant difference in the relationship between ATFL/SEAR thickness and average reach distance difference between limbs in each of the three directions (anterior, posteromedial, posterolateral), nor the composite scores on the YBT. Therefore, while these results failed to support the findings of previously published literature, as it has been widely accepted that ligamentous and retinacular tissues both have proprioceptive qualities that, when impaired, may play a role in the resulting balance impairments and decreased functional and sport performance.45910) One factor that may help explain these findings is that the YBT was determined to be a reliable measure of single limb stance excursion distances as a dynamic balance test in male collegiate soccer players.18) The lack of significant differences between and within groups may be attributed to the fact that our sample population is not consistent with an athletic population for which the YBT was validated upon. While participants in this study did receive practice trials prior to testing, a population of athletes may have been more familiar with the movements and body positioning demanded by this new balance assessment, making an injury more likely to affect performance for this specific test. Additionally, the learning effect, seen after six practice trials in each direction on each foot, could have also contributed to a lack of significant findings with the YBT, as participants in this study received only three practice trials in each direction for each limb.18) Three practice trials were utilized for this study to improve efficiency of data collection and prevent fatigue, but in future studies of this nature it may be beneficial to account for the learning curve that may have impacted participants' performance on the YBT. While the results of this current study yielded no significant YBT differences between groups, these findings do align with Wikstrom et al.,19) as their study noted some active individuals continue to successfully participate in dynamic activities, despite history of lateral ankle sprains. While structural and morphologic changes may occur at the tissue level, differences in the pattern of structural damage, neuromuscular control compensations, and psychosomatic reactions may lead to not only differences in the development of CAI (as determined subjectively by the participant's self-reported CAIT scores) but also differences in functional performance.9101319) This proposes that the reasons for variability in recovery and subsequent functional performance are multifactorial in regard to CAI and ankle sprain history and cannot be attributed to morphologic changes alone.
No differences were found between those with and without CAI in the dynamic balance measures of latency, amplitude of response, and average sway energy assessed during the NeuroCom motor control and adaptation tests. There were also no differences in these variables among groups based on history of ankle sprain. These findings suggest that ankle sprains and CAI have little impact on the time required to initiate a motor response for restoring balance or the body's ability to minimize sway after an external perturbation. This does not support previous findings in the literature that show impaired postural control in individuals with CAI. For example, Nakagawa and Hoffman20) found significant differences in center of pressure (COP) excursion between those with recurrent ankle sprains and healthy controls using the NeuroCom Balance Manager as a measure of dynamic balance. Their findings show a greater excursion of COP in those with recurrent ankle sprains, indicating that these individuals have a reduced ability to control postural sway.20) However, the dynamic balance assessment in the Nakagawa and Hoffman20) study consisted of a voluntary single limb movement on to a foam support surface whereas the present study assessed sway energy of the bilateral limbs after an external change in the angle of a flat support surface. This lack of significant findings may also be due to the inability of the NeuroCom assessment tests to pick up on minor postural deficits and movement compensations in those with CAI. This is further supported by McKeon and Hertel,21) who demonstrated how postural impairments associated with CAI are more consistently and accurately evaluated using complex functional tests rather than utilizing force plate measurements, which are more appropriate for assessing deficits in those with acute ankle sprains.21) While there were no relationships between CAI, ankle sprain history, and NeuroCom assessment, there was a significant positive correlation between left SEAR and response amplitude for large forward and backward force plate perturbations. This finding was irrespective of CAI or ankle sprain history but shows as left SEAR thickness increases so does the amplitude of response to large perturbations. This finding was not replicated for the right ankle or across other variables, making further investigation necessary.
While the results of this study yielded no significant findings when comparing dynamic balance in those with and without CAI and history of previous ankle sprains, the tests used in this study to assess dynamic balance may not have been specific enough to account for subtle changes in balance and functional performance. A systematic review of individuals with CAI noted that these individuals showed impaired balance with eyes closed and while attempting to stabilize the ankle following a jump test, but demonstrated no differences in response to passive perturbation detection or reaction times.22) Since the balance measures included in this study were all conducted with eyes open and while responding to passive perturbations, these tests may not have been specific enough to identify true functional changes. Further, Wikstrom et al.19) concluded that self-assessed disability, as measured by the Foot and Ankle Disability Index (FADI), FADI-Sport (FADI-S), and a self-report questionnaire of ankle function (SRQAF) was significantly different among groups (unilateral CAI, copers, and uninjured controls), while functional performance as measured by hop tests (figure-8, side-to-side, triple-crossover hop for distance, and single-leg hop for distance) was not. Additionally, Madsen et al.4) found that while individuals with CAI perceived and reported greater instability during functional performance hop tests, they did not demonstrate significant functional deficits when compared with healthy controls. Though these studies utilized different subjective assessment tools and different functional performance measures than seen in the present study, they support the concept that subjective reports of ankle instability may not coincide with a decreased performance on dynamic balance tests. Therefore, an individual may demonstrate or perceive greater disability following lateral ankle sprains but may not demonstrate impaired functional performance during controlled laboratory testing.
The limitations of this study should be taken into account alongside the results and conclusions. First, injury history was based only on participant recall. Often it is difficult for individuals to remember past ankle sprain history and the side on which sprains may or may not have occurred. Second, the reporting quality of the SonoSite MTurbo MSKUS unit does not measure in extremely small increments to capture the subtle differences in SEAR tissue structures. Another limitation is the dynamic balance assessments utilized, YBT and NeuroCom Balance Manager, may not be the most optimal fit to gauge dynamic balance for the sample population in this study. Also, the NeuroCom Motor Control Test reported an absent average latency during translations on a few participants. This indicates the computer confidence was zero, and zero of the four search algorithms agreed on the “take-off point”. This required the tester to manually mark the latencies based on the take off point indicated by a strong upward or downward deflection in the raw data. The final limitation in this study, was the platform in the NeuroCom Adaptation test tilts at a rotation of 8° which required the participant to have 8° of ankle dorsiflexion, which was not measured in this study.16)
CONCLUSION
There were no significant differences in balance measures in those with/without CAI or when taking ATFL/SEAR thickness into account, likely because CAI is multifactorial rather than dependent upon tissue changes or perception of ankle instability alone. Relevant factors that affect balance and should be considered in future research and by healthcare practitioners may be: central nervous system sensory integration, neuromuscular control compensations, and psychosomatic reactions. A correlation between SEAR thickness and response amplitude to large perturbations is an isolated finding in this study and will need further examination and replication to solidify, as there is a limited body of research on this specific topic.


 XML Download