

 PDF
PDF ePub
ePub Citation
 Print
Print


INTRODUCTION
MAIN BODY
1. Evidence acquisition
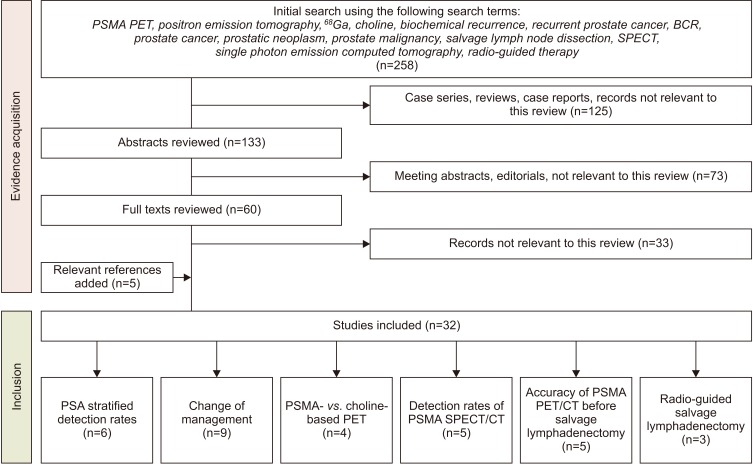
2. Evidence synthesis
1) Performance and impact of prostate specific membrane antigen positron-emission tomography/computed tomography
(1) Detection rates stratified to prostate specific antigen-levels
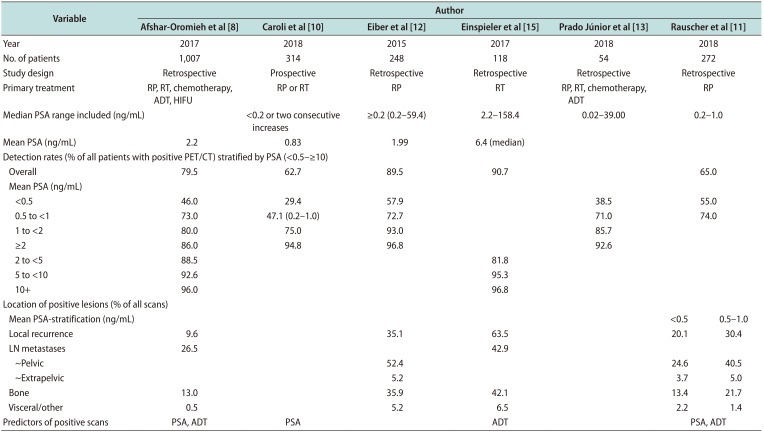
Table 1
PSA-stratified detection rates of PSMA PET/CT in men with biochemical recurrence of prostate cancer
| Variable | Author | ||||||
|---|---|---|---|---|---|---|---|
| Afshar-Oromieh et al [8] | Caroli et al [10] | Eiber et al [12] | Einspieler et al [15] | Prado Júnior et al [13] | Rauscher et al [11] | ||
| Year | 2017 | 2018 | 2015 | 2017 | 2018 | 2018 | |
| No. of patients | 1,007 | 314 | 248 | 118 | 54 | 272 | |
| Study design | Retrospective | Prospective | Retrospective | Retrospective | Retrospective | Retrospective | |
| Primary treatment | RP, RT, chemotherapy, ADT, HIFU | RP or RT | RP | RT | RP, RT, chemotherapy, ADT | RP | |
| Median PSA range included (ng/mL) | <0.2 or two consecutive increases | ≥0.2 (0.2–59.4) | 2.2–158.4 | 0.02–39.00 | 0.2–1.0 | ||
| Mean PSA (ng/mL) | 2.2 | 0.83 | 1.99 | 6.4 (median) | |||
| Detection rates (% of all patients with positive PET/CT) stratified by PSA (<0.5–≥10) | |||||||
| Overall | 79.5 | 62.7 | 89.5 | 90.7 | 65.0 | ||
| Mean PSA (ng/mL) | |||||||
| <0.5 | 46.0 | 29.4 | 57.9 | 38.5 | 55.0 | ||
| 0.5 to <1 | 73.0 | 47.1 (0.2–1.0) | 72.7 | 71.0 | 74.0 | ||
| 1 to <2 | 80.0 | 75.0 | 93.0 | 85.7 | |||
| ≥2 | 86.0 | 94.8 | 96.8 | 92.6 | |||
| 2 to <5 | 88.5 | 81.8 | |||||
| 5 to <10 | 92.6 | 95.3 | |||||
| 10+ | 96.0 | 96.8 | |||||
| Location of positive lesions (% of all scans) | |||||||
| Mean PSA-stratification (ng/mL) | <0.5 | 0.5–1.0 | |||||
| Local recurrence | 9.6 | 35.1 | 63.5 | 20.1 | 30.4 | ||
| LN metastases | 26.5 | 42.9 | |||||
| ~Pelvic | 52.4 | 24.6 | 40.5 | ||||
| ~Extrapelvic | 5.2 | 3.7 | 5.0 | ||||
| Bone | 13.0 | 35.9 | 42.1 | 13.4 | 21.7 | ||
| Visceral/other | 0.5 | 5.2 | 6.5 | 2.2 | 1.4 | ||
| Predictors of positive scans | PSA, ADT | PSA | ADT | PSA, ADT | |||
![]()
(2) Does prostate specific membrane antigen positron-emission tomography change clinical decision-making?
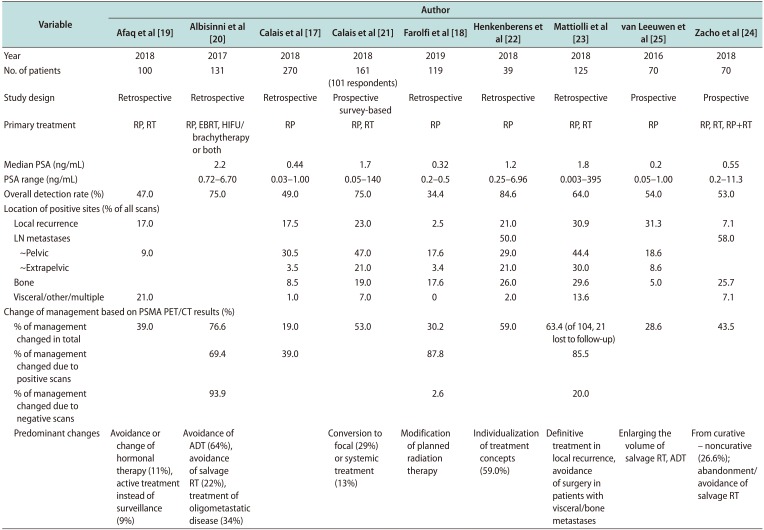
Table 2
Studies reporting change in management following PSMA-PET/CT in men with biochemical recurrence of prostate cancer
| Variable | Author | ||||||||
|---|---|---|---|---|---|---|---|---|---|
| Afaq et al [19] | Albisinni et al [20] | Calais et al [17] | Calais et al [21] | Farolfi et al [18] | Henkenberens et al [22] | Mattiolli et al [23] | van Leeuwen et al [25] | Zacho et al [24] | |
| Year | 2018 | 2017 | 2018 | 2018 | 2019 | 2018 | 2018 | 2016 | 2018 |
| No. of patients | 100 | 131 | 270 | 161 (101 respondents) | 119 | 39 | 125 | 70 | 70 |
| Study design | Retrospective | Retrospective | Retrospective | Prospective survey-based | Retrospective | Retrospective | Retrospective | Prospective | Prospective |
| Primary treatment | RP, RT | RP, EBRT, HIFU/brachytherapy or both | RP | RP, RT | RP | RP | RP, RT | RP | RP, RT, RP+RT |
| Median PSA (ng/mL) | 2.2 | 0.44 | 1.7 | 0.32 | 1.2 | 1.8 | 0.2 | 0.55 | |
| PSA range (ng/mL) | 0.72–6.70 | 0.03–1.00 | 0.05–140 | 0.2–0.5 | 0.25–6.96 | 0.003–395 | 0.05–1.00 | 0.2–11.3 | |
| Overall detection rate (%) | 47.0 | 75.0 | 49.0 | 75.0 | 34.4 | 84.6 | 64.0 | 54.0 | 53.0 |
| Location of positive sites (% of all scans) | |||||||||
| Local recurrence | 17.0 | 17.5 | 23.0 | 2.5 | 21.0 | 30.9 | 31.3 | 7.1 | |
| LN metastases | 50.0 | 58.0 | |||||||
| ~Pelvic | 9.0 | 30.5 | 47.0 | 17.6 | 29.0 | 44.4 | 18.6 | ||
| ~Extrapelvic | 3.5 | 21.0 | 3.4 | 21.0 | 30.0 | 8.6 | |||
| Bone | 8.5 | 19.0 | 17.6 | 26.0 | 29.6 | 5.0 | 25.7 | ||
| Visceral/other/multiple | 21.0 | 1.0 | 7.0 | 0 | 2.0 | 13.6 | 7.1 | ||
| Change of management based on PSMA PET/CT results (%) | |||||||||
| % of management changed in total | 39.0 | 76.6 | 19.0 | 53.0 | 30.2 | 59.0 | 63.4 (of 104, 21 lost to follow-up) | 28.6 | 43.5 |
| % of management changed due to positive scans | 69.4 | 39.0 | 87.8 | 85.5 | |||||
| % of management changed due to negative scans | 93.9 | 2.6 | 20.0 | ||||||
| Predominant changes | Avoidance or change of hormonal therapy (11%), active treatment instead of surveillance (9%) | Avoidance of ADT (64%), avoidance of salvage RT (22%), treatment of oligometastatic disease (34%) | Conversion to focal (29%) or systemic treatment (13%) | Modification of planned radiation therapy | Individualization of treatment concepts (59.0%) | Definitive treatment in local recurrence, avoidance of surgery in patients with visceral/bone metastases | Enlarging the volume of salvage RT, ADT | From curative – noncurative (26.6%); abandonment/avoidance of salvage RT | |
PSMA: prostate specific membrane antigen, PET/CT: positron-emission tomography/computed tomography, PSA: prostate specific antigen, LN: lymph node, RP: radical prostatectomy, RT: radiation therapy, EBRT: external beam radiation therapy, HIFU: high-intensity focused ultrasound, ADT: androgen deprivation therapy.
![]()
2) Comparison to alternative imaging modalities for recurrent prostate cancer
(1) Prostate specific membrane antigen- vs. Cholinepositron-emission tomography/computed tomography
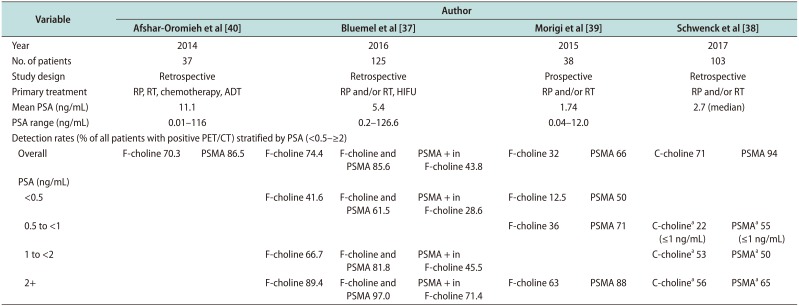
Table 3
Detection rates of 68Ga PSMA PET/CT vs. Choline-PET/CT
| Variable | Author | ||||||||
|---|---|---|---|---|---|---|---|---|---|
| Afshar-Oromieh et al [40] | Bluemel et al [37] | Morigi et al [39] | Schwenck et al [38] | ||||||
| Year | 2014 | 2016 | 2015 | 2017 | |||||
| No. of patients | 37 | 125 | 38 | 103 | |||||
| Study design | Retrospective | Retrospective | Prospective | Retrospective | |||||
| Primary treatment | RP, RT, chemotherapy, ADT | RP and/or RT, HIFU | RP and/or RT | RP and/or RT | |||||
| Mean PSA (ng/mL) | 11.1 | 5.4 | 1.74 | 2.7 (median) | |||||
| PSA range (ng/mL) | 0.01–116 | 0.2–126.6 | 0.04–12.0 | ||||||
| Detection rates (% of all patients with positive PET/CT) stratified by PSA (<0.5–≥2) | |||||||||
| Overall | F-choline 70.3 | PSMA 86.5 | F-choline 74.4 | F-choline and PSMA 85.6 | PSMA + in F-choline 43.8 | F-choline 32 | PSMA 66 | C-choline 71 | PSMA 94 |
| PSA (ng/mL) | |||||||||
| <0.5 | F-choline 41.6 | F-choline and PSMA 61.5 | PSMA + in F-choline 28.6 | F-choline 12.5 | PSMA 50 | ||||
| 0.5 to <1 | F-choline 36 | PSMA 71 | C-cholinea 22 (≤1 ng/mL) | PSMAa 55 (≤1 ng/mL) | |||||
| 1 to <2 | F-choline 66.7 | F-choline and PSMA 81.8 | PSMA + in F-choline 45.5 | C-cholinea 53 | PSMAa 50 | ||||
| 2+ | F-choline 89.4 | F-choline and PSMA 97.0 | PSMA + in F-choline 71.4 | F-choline 63 | PSMA 88 | C-cholinea 56 | PSMAa 65 | ||
68Ga: 68Gallium, PSMA: prostate specific membrane antigen, PET/CT: positron-emission tomography/computed tomography, PSA: prostate specific antigen, RP: radical prostatectomy, RT: radiation therapy, ADT: androgen deprivation therapy, HIFU: high-intensity focused ultrasound.
aDetection rates based on lymph nodes.
![]()
(2) Prostate specific membrane antigen as a target protein for single photon-emission tomography/computed tomography
Table 4
Detection rates of PSMA SPECT/CT in patients with biochemical recurrence of prostate cancer
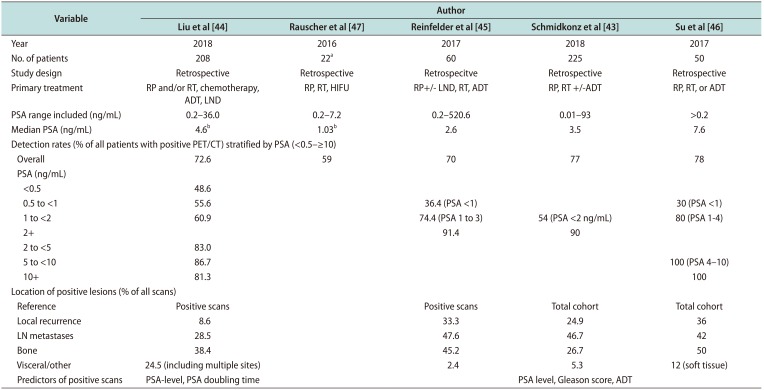
| Variable | Author | ||||
|---|---|---|---|---|---|
| Liu et al [44] | Rauscher et al [47] | Reinfelder et al [45] | Schmidkonz et al [43] | Su et al [46] | |
| Year | 2018 | 2016 | 2017 | 2018 | 2017 |
| No. of patients | 208 | 22a | 60 | 225 | 50 |
| Study design | Retrospective | Retrospective | Retrospecitve | Retrospective | Retrospective |
| Primary treatment | RP and/or RT, chemotherapy, ADT, LND | RP, RT, HIFU | RP+/− LND, RT, ADT | RP, RT +/−ADT | RP, RT, or ADT |
| PSA range included (ng/mL) | 0.2–36.0 | 0.2–7.2 | 0.2–520.6 | 0.01–93 | >0.2 |
| Median PSA (ng/mL) | 4.6b | 1.03b | 2.6 | 3.5 | 7.6 |
| Detection rates (% of all patients with positive PET/CT) stratified by PSA (<0.5–≥10) | |||||
| Overall | 72.6 | 59 | 70 | 77 | 78 |
| PSA (ng/mL) | |||||
| <0.5 | 48.6 | ||||
| 0.5 to <1 | 55.6 | 36.4 (PSA <1) | 30 (PSA <1) | ||
| 1 to <2 | 60.9 | 74.4 (PSA 1 to 3) | 54 (PSA <2 ng/mL) | 80 (PSA 1-4) | |
| 2+ | 91.4 | 90 | |||
| 2 to <5 | 83.0 | ||||
| 5 to <10 | 86.7 | 100 (PSA 4–10) | |||
| 10+ | 81.3 | 100 | |||
| Location of positive lesions (% of all scans) | |||||
| Reference | Positive scans | Positive scans | Total cohort | Total cohort | |
| Local recurrence | 8.6 | 33.3 | 24.9 | 36 | |
| LN metastases | 28.5 | 47.6 | 46.7 | 42 | |
| Bone | 38.4 | 45.2 | 26.7 | 50 | |
| Visceral/other | 24.5 (including multiple sites) | 2.4 | 5.3 | 12 (soft tissue) | |
| Predictors of positive scans | PSA-level, PSA doubling time | PSA level, Gleason score, ADT | |||
PSMA: prostate specific membrane antigen, SPECT/CT: single photon emission computed tomography/computed tomography, PSA: prostate specific antigen, PET: positron-emission tomography, LN: lymph node, RP: radical prostatectomy, RT: radiation therapy, ADT: androgen deprivation therapy, LND: lymph node dissection, HIFU: high-intensity focused ultrasound.
aPatients with known positive lesions in PSMA PET/CT. bMean.
![]()
3) Accuracy of 68Gallium-prostate specific membrane antigen positron-emission tomography/computed tomography before salvage lymphadenectomy
Table 5
Accuracy of 68Ga PSMA PET diagnostic in men undergoing salvage lymph node dissection for recurrent prostate cancer
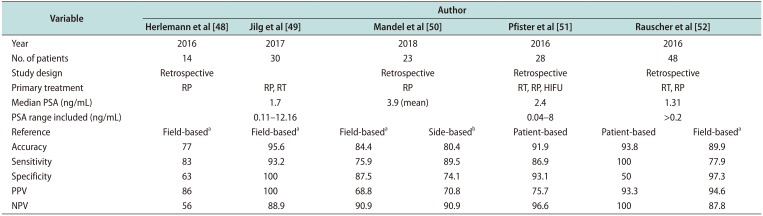
| Variable | Author | ||||||
|---|---|---|---|---|---|---|---|
| Herlemann et al [48] | Jilg et al [49] | Mandel et al [50] | Pfister et al [51] | Rauscher et al [52] | |||
| Year | 2016 | 2017 | 2018 | 2016 | 2016 | ||
| No. of patients | 14 | 30 | 23 | 28 | 48 | ||
| Study design | Retrospective | Retrospective | Retrospective | Retrospective | |||
| Primary treatment | RP | RP, RT | RP | RT, RP, HIFU | RT, RP | ||
| Median PSA (ng/mL) | 1.7 | 3.9 (mean) | 2.4 | 1.31 | |||
| PSA range included (ng/mL) | 0.11–12.16 | 0.04–8 | >0.2 | ||||
| Reference | Field-baseda | Field-baseda | Field-baseda | Side-basedb | Patient-based | Patient-based | Field-baseda |
| Accuracy | 77 | 95.6 | 84.4 | 80.4 | 91.9 | 93.8 | 89.9 |
| Sensitivity | 83 | 93.2 | 75.9 | 89.5 | 86.9 | 100.0 | 77.9 |
| Specificity | 63 | 100 | 87.5 | 74.1 | 93.1 | 50.0 | 97.3 |
| PPV | 86 | 100 | 68.8 | 70.8 | 75.7 | 93.3 | 94.6 |
| NPV | 56 | 88.9 | 90.9 | 90.9 | 96.6 | 100.0 | 87.8 |
68Ga: 68Gallium, PSMA: prostate specific membrane antigen, PET: positron-emission tomography, PSA: prostate specific antigen, PPV: positive predictive value, NPV: negative predictive value, RP: radical prostatectomy, RT: radiation therapy, HIFU: high-intensity focused ultrasound.
aBased on predefined lymph node fields. bLeft/right.
![]()
 XML Download