

 PDF
PDF ePub
ePub Citation
 Print
Print


INTRODUCTION
Myocardial Perfusion Imaging
Visual Assessment
I. What-to-See
1. Evaluate the presence or absence of inducible perfusion defects (Table 1).
2. If perfusion defects exist, describe location based on a 17-segment model, transmural extent, and extent of perfusion defects relative to scar on LGE.
3. Estimate the number of involved segments.
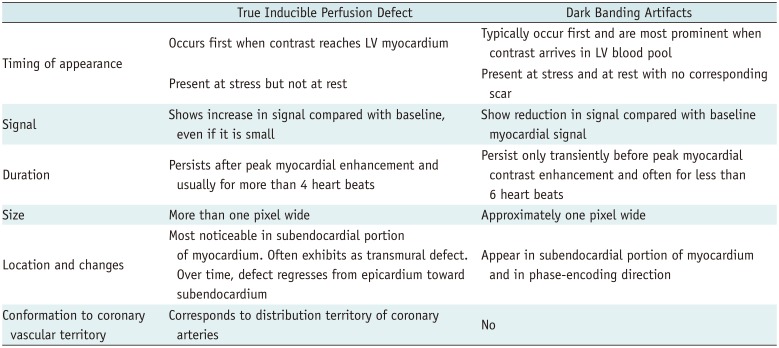
Table 1
Comparison between True Inducible Perfusion Defect and Dark Banding Artifacts Adapted from Reference (2)
![]()
II. How-To
1. Display both rest and stress perfusion images sideby-side, using a stack or cine mode. If possible, also display corresponding LGE images.
2. Adjust window width and level. Avoid “overspilling” of the left ventricular (LV) cavity signal into the myocardium.
3. Apply the same window setting to all images.
4. Compare rest and stress images to identify relative hypoperfusion.
III. Pitfalls
1. Dark banding (rim) artifacts: Subendocardial dark banding artifacts are common sources of false-positive interpretation (Fig. 1, Supplementary Movie 1). Table 1 summarizes differential points (12).
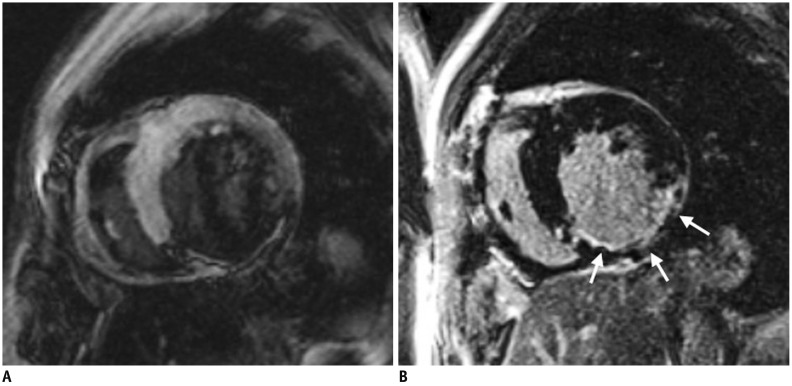
2. Multi-vessel disease: Balanced multi-vessel disease can result in subendocardial hypoperfusion in most, or all segments (Fig. 2, Supplementary Movie 2), which can lead to false-negative interpretation, or misdiagnosis of microvascular disease, as visual analysis reflects a relative myocardial perfusion (3). On visual analysis, a discernible signal gradient between subendocardial and subepicardial myocardium may be seen in multi-vessel disease. Quantitative analysis of absolute coronary blood flow can help to further reveal diminished myocardial perfusion reserve in multi-vessel disease (24).
3. Microvascular disease: Diseases that affect the myocardial microvasculature, such as diabetes mellitus or systemic hypertension (also called “syndrome X”), may result in subendocardial concentric reduction in perfusion, traversing coronary territories (5) (Fig. 3, Supplementary Movie 3). Differentiation from multi-vessel disease or dark banding artifacts can be challenging.
4. Hypertrophic cardiomyopathy (HCM): Patchy or subendocardial inducible ischemia can be seen in HCM (Fig. 4, Supplementary Movie 4). Intramural coronary artery disease (CAD), which is pathologically characterized by smooth muscle thickening and luminal narrowing, may be attributable to an ischemia in HCM (6). The fact that fibrosis is present within the area of an ischemia, and is smaller than the area of an ischemia, supports this speculation (7).
5. Delayed perfusion in a patient who is post bypass graft: A delayed perfusion due to long graft pathway in a post bypass graft can mimic a true perfusion defect on myocardial stress MRI (8). The differential points are extent and duration: delayed perfusion from a long bypass graft pathway is transmural, while in true perfusion defects, hypoenhancement is non-transmural in most cases, and true perfusion defects tend to last longer. Additionally, a delayed perfusion from a long bypass graft pathway appears on both stress and rest images. Semi-quantitative and quantitative measurements are helpful to differentiate between them, because perfusion parameters of a delayed perfusion from a long graft are not deteriorated, and like those of the normal myocardium (Fig. 5, Supplementary Movie 5).
6. Overcalling of inducible ischemia: Certain conditions, such as microvascular obstruction (MVO) in acute myocardial infarction, infarcted tissue, thrombus, and tumor, can appear as a hypo-signal on stress perfusion imaging. Evaluating them with LGE images is important to prevent misinterpretation as inducible ischemia.
7. Inadequate effect of vasodilator stress: Caffeine is a nonspecific competitive antagonist of all adenosine receptor subtypes; therefore, it may hamper the coronary vasodilatory effects of adenosine agonists (9). Despite the conflicting and limited published data, current guidelines recommend that caffeine be withheld for 12 hours prior to vasodilator stress myocardial perfusion imaging (10).
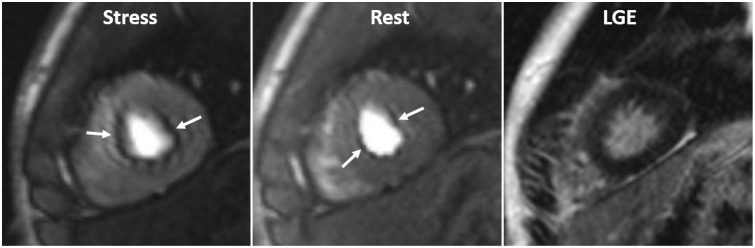 | Fig. 1Dark banding artifact in 18-year-old man.Defect (arrows) is approximately one pixel wide, prominent in phase-encoding direction (right-left in this case), and already appears before contrast reaches myocardium. Even though this defect is seen on both stress and rest perfusion images, there is no delayed enhancement in corresponding region on LGE image. LGE = late gadolinium enhancement
|
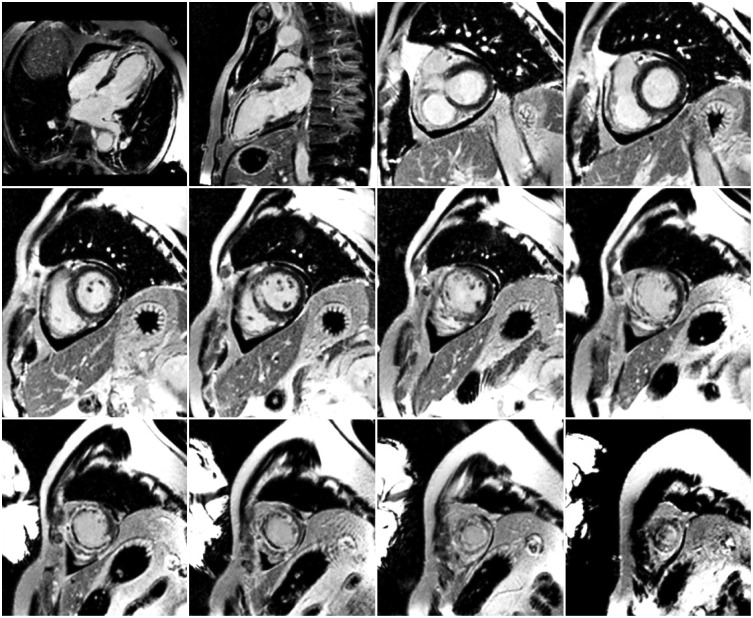
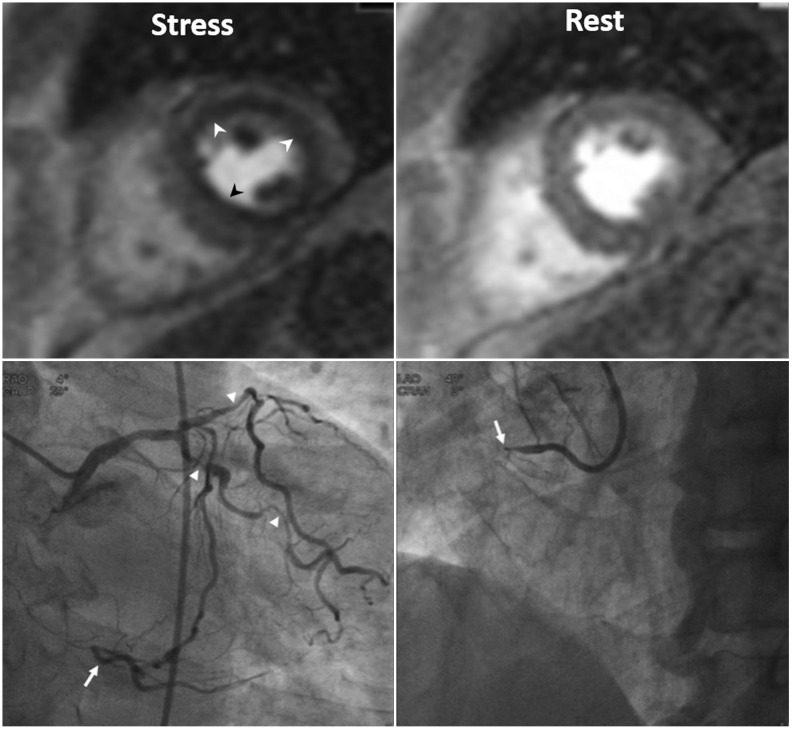 | Fig. 2Three-vessel disease in 70-year-old man.Ring-like subendocardial perfusion defect (arrowheads) is seen on stress, and disappears on rest images (upper row). Differentiation from microvascular disease may be challenging. Patient had multifocal severe stenosis (arrowheads) at left anterior descending and left circumflex coronary arteries. Right coronary artery angiogram (on right lower) shows total occlusion (arrow) at proximal segment, and distal segment (arrow) reconstituted via big septal branch is seen on left coronary angiogram (on left lower) (Courtesy of Sung-A Chang, Samsung Medical Center).
|
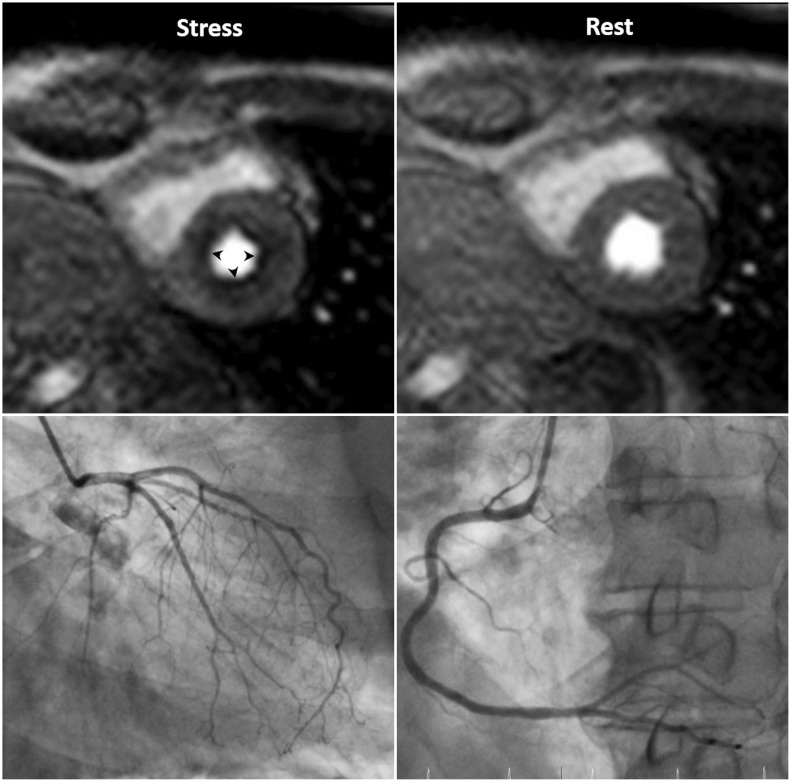 | Fig. 3Microvascular disease in 73-year-old man with 20-year history of diabetes mellitus.Patient complains of chest pain. Invasive coronary angiography shows insignificant findings. Note global subendocardial perfusion defect (arrowheads), which is more than one pixel wide on stress perfusion images.
|
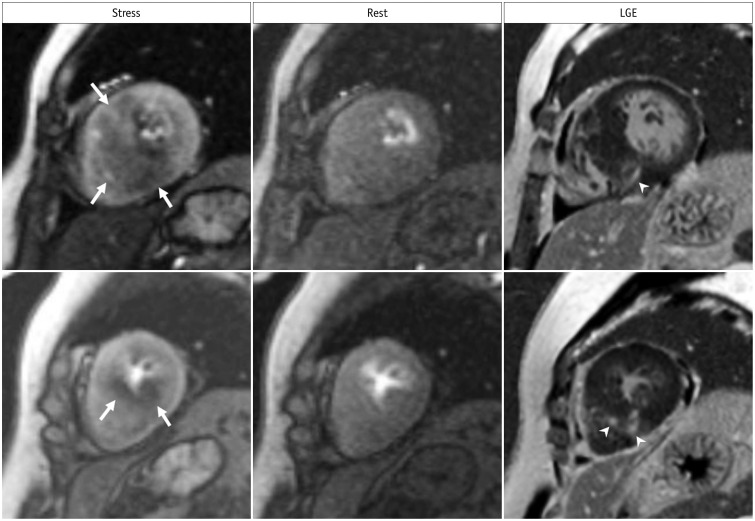 | Fig. 4Inducible ischemia in 52-year-old woman with septal-type HCM.Inducible, global, subendocardial perfusion defects (arrows) are present in mid to apical segments, and extent of defects is greater in hypertrophied septum of left ventricle on stress images. Compared to LGE images, fibrosis (arrowheads) exists within area of ischemia and is smaller than perfusion defects. HCM = hypertrophic cardiomyopathy
|
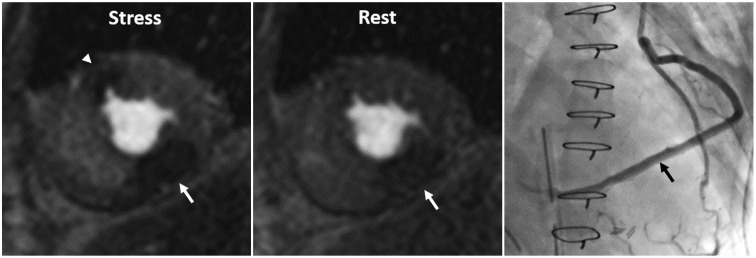 | Fig. 5Inducible ischemia and delayed perfusion in 50-year-old man who underwent coronary bypass graft surgery.Delayed perfusion (arrow) due to long bypass graft is transmural and appears on both stress and rest images, while inducible perfusion defect (arrowhead) is subendocardial, lasts longer, and appears only on stress perfusion image. Invasive coronary angiography shows long, saphenous venous Y graft (arrow) to posterior descending coronary artery (Adapted from Kim et al. Korean J Radiol 2014;15:188-194 (8)).
|
Semi-Quantitative Assessment
I. What-to-See
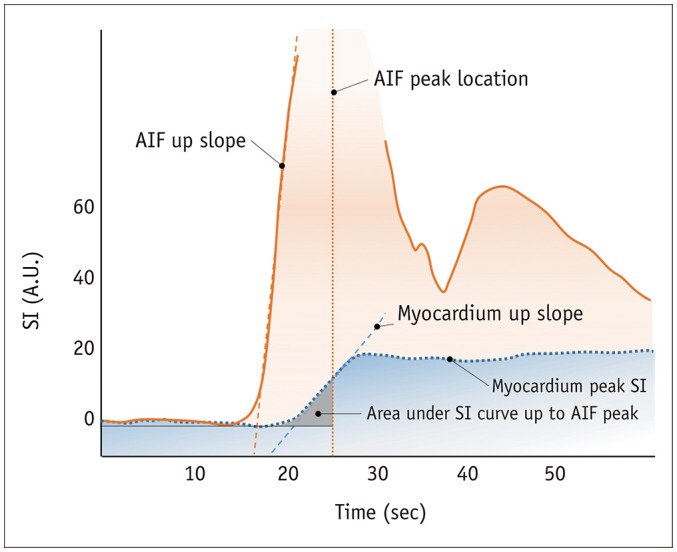
1. Analysis methods of the signal intensity (SI) profile of myocardial dynamic perfusion CMR data, without estimating the absolute myocardial blood flow (11) (Fig. 6).
2. Maximal up-slope (12): May be normalized to LV up-slope.
3. Time to peak SI of the myocardial SI profile (13).
4. The up-slope integral (14): Area under the SI–time curve until arterial input function (AIF) peak, also normalized to the up-slope integral of LV.
5. Myocardial perfusion reserve index (15): Ratios of stress value divided by the rest value of each above parameter.
II. How-To
1. Select an image from the dynamic series with good contrast.
2. Draw LV endocardial and epicardial contours on this image manually or automatically.
3. Propagate contours to all other dynamic images.
4. Place a separate region of interest (ROI) in the LV blood pool. Preferably, the basal slice is used without including papillary muscles.
5. Select a reference point in the LV myocardium for segmentation (usually the right ventricular [RV] insertion point).
6. Generate time-intensity curve from myocardial segments and LV blood pool.
7. Make sure to substrate baseline signal in the time-intensity curve.
8. Time window for calculation starts from the contrast arrival in the LV.
9. Some MR vendors provide inline post-processing of up-slope mapping after automatic motion correction and registration at each perfusion imaging.
10. Dedicated software provides regional values for myocardial segments, and LV blood pool, according to American Heart Association classification (Fig. 7).
11. Consider separate calculation of endocardial and epicardial layers, and repeat analysis.
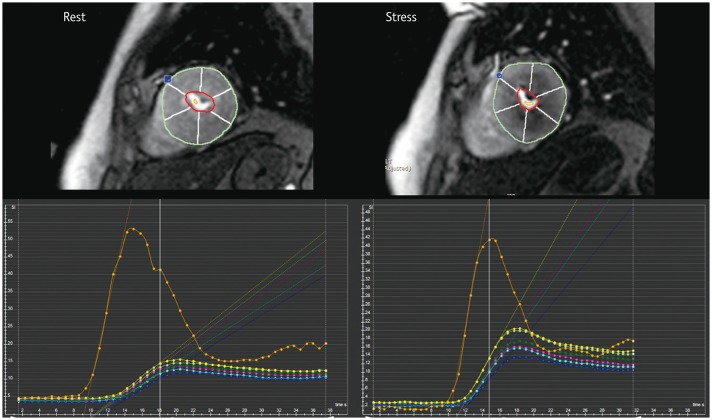 | Fig. 7Example of semi-quantitative perfusion analysis using dedicated software.Regional maximal up-slope values are demonstrated based on 17-segment model on time–SI profile. Blue dot in anterior junction of right ventricular insertion point indicates reference point in left ventricular myocardium for segmentation.
|
III. Pitfalls
1. SI may vary according to the distance from coil.
2. No absolute measurement of myocardial blood flow derived.
3. Confounding effect of the quantity in the denominator, which serves the role of normalization, causes unreliable results. For example, in patients with hypertension, resting blood flow may be abnormally elevated in proportion to the rate-pressure product (10). Evaluating the myocardial perfusion reserve from a ratio in this situation would be inaccurate.
Quantitative Assessment
I. What-to-See
1. Estimation of absolute myocardial blood flow (unit: mL/min/g) by analyzing the SI profile of myocardial dynamic perfusion CMR data (11).
II. How-To
1. Quantitative analysis is performed in the same manner as the semi-quantitative analysis.
2. AIF to analyze absolute myocardial blood flow is required, and can be derived from the ROI in the LV blood pool.
3. Generally, there are two approaches that can be used to quantify myocardial blood flow using contrast-enhanced CMR perfusion data: model-based (16) and model-independent methods (17).
III. Pitfalls
1. Use of an adequate pulse sequence and contrast regime is the prerequisite for reliable quantification.
2. Correction of the AIF for saturation effects, resulting in the nonlinearity of the relationship between SI and contrast concentration.
3. Dual-bolus injection method that uses diluted contrast agent as pre-bolus before the main bolus (1819): an initial minibolus (i.e., 0.0025 mmol/kg) to maintain blood pool linearity followed by a high dose (i.e., 0.05 or 0.10 mmol/kg) to maximize myocardial signal-to-noise ratio (SNR) 10 or 20 seconds later. Low doses of contrast to minimize saturation effects: 0.025–0.050 mmol/kg for quantification is usually used, strictly less than 0.03 mmol/kg.
4. Dual-T1 sensitivity method with high dose, single injection (20): This method uses a low-resolution sequence with a short saturation-recovery time to measure AIF and a high-resolution sequence with a long saturation-recovery time to assess myocardial output within each R-R interval.
5. The optimal solution to the nonlinearity of the myocardium has not been defined yet because of more complex challenges.
6. Use of an intravascular contrast agent instead of an extracellular agent can simplify the estimation of blood flow, due to absence of leakage into the interstitial space (zero permeability surface area product), and it can improve the accuracy of blood flow estimates (21).
7. Baseline correction: Background signal should be subtracted before contrast enhancement.
8. At least 10 minutes interval after contrast injection to minimize the influence of the first perfusion scans.
Late Gadolinium Enhancement Imaging
Visual Assessment
I. What-to-See
1. Identify irreversibly injured myocardial tissue.
2. If delayed enhancement exists, describe the location based on a 17-segment model, pattern of LGE (subepicardial, intramural, subendocardial, or transmural), transmural extent, viability, and the presence of MVO or thrombus.
3. Estimate the number of segments involved.
II. How-To
1. Determine the optimal inversion time (TI) using initial TI scout imaging, to obtain a good-quality LGE image. The optimal TI differs depending on the contrast material clearance from the normal myocardium. In general, a slightly too long TI is preferred over a slightly too short TI (22) (Fig. 8).
2. Use phase-sensitive inversion recovery (PSIR) imaging. PSIR imaging is less sensitive to TI, and shows infarct tissue as bright, and always shows the normal myocardium as dark, regardless of the TI.
3. Adjust window width and level to avoid noise, and to prevent the LGE regions to be cut-off.
4. Determine the presence of LGE. If high SI is as bright as the LV blood pool, it is considered as LGE.
5. Assess the pattern of LGE (2324). CAD type is typically seen as subendocardial involvement that corresponds to a coronary artery perfusion territory (Fig. 9). Non-CAD type is usually described as subendocardial sparing and myocardial enhancement restricted to the mid-wall or epicardium (Fig. 10).
6. Evaluate the average transmural extent of LGE. In each of 17 standardized myocardial segments, the LGE region is scored with a five-point scale (0%, 1–25%, 26–50%, 51–75%, 76–100%) (25).
7. Compare LGE image with cine and perfusion images to categorize ischemia and viability (26).
-
8. Identify MVO or thrombus, and distinguish it from viable myocardium.
A. MVO is shown as a central hypo-enhanced region within an avidly hyper-enhanced region of infarcted myocardium on LGE image (Fig. 11). Although the appearance of MVO on first-pass perfusion and early and LGE sequences is similar, LGE is a more accurate predictor of adverse ventricular remodeling and future major adverse cardiovascular events (27).
B. LV thrombus occurs at the endocardial surface area covering the site of myocardial infarction. In patients with MVO, the low SI on LGE is localized within the myocardium. However, in patients with thrombus, the low SI on LGE is observed within the cavity adjacent to the wall of the myocardium (28).
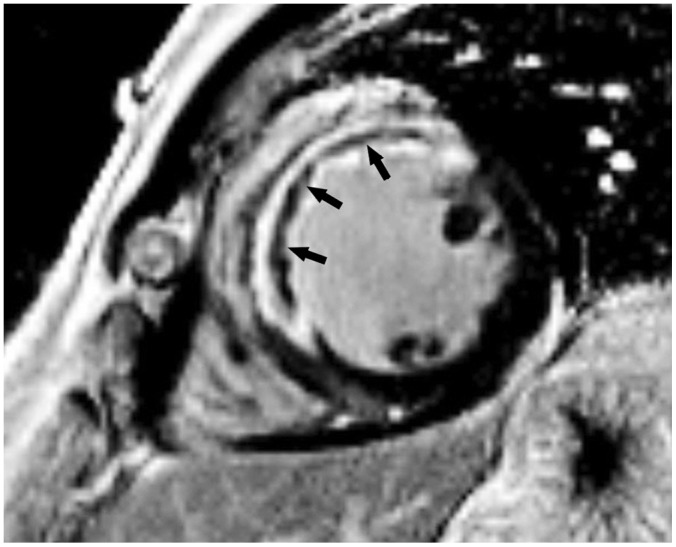
Fig. 11
Short-axis LGE image in 49-year-old man with exertional chest pain performed 5 days after primary percutaneous coronary intervention to left anterior descending artery.
Full-thickness infarct within anterior and anteroseptal left ventricular mid-wall with microvascular obstruction (arrows) is shown as central hypo-enhanced region within avidly hyper-enhanced region of infarcted myocardium on LGE image.
 | Fig. 8Role of TI in LGE imaging.Left image (A) shows wrong nulling of normal myocardium that is shown to be darkest at border with higher SI centrally. These findings signify that degree of LGE may be underestimated if TI is too short. Right image (B) shows optimal nulling of myocardium with repeated image taken at longer TI and demonstrates larger LGE area in inferior wall (arrows). TI = inversion time
|
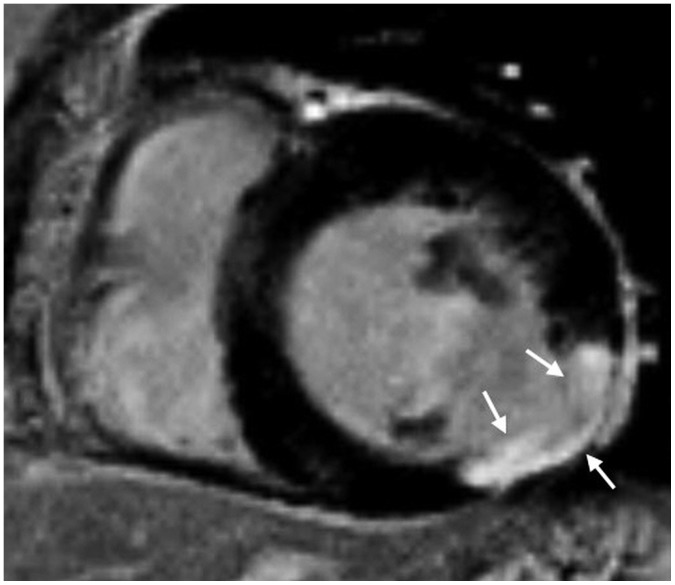 | Fig. 9Pattern assessment in LGE image in patient with coronary artery disease.Most important finding of ischemic pattern is that LGE lesion follows coronary artery distribution. This patient shows delayed enhancement (arrows) at mid inferolateral wall of left ventricular myocardium, indicating left circumflex artery territory. Lesion of ischemic pattern starts at endocardium extending toward epicardium, according to concept of wave front phenomenon of myocardial death.
|
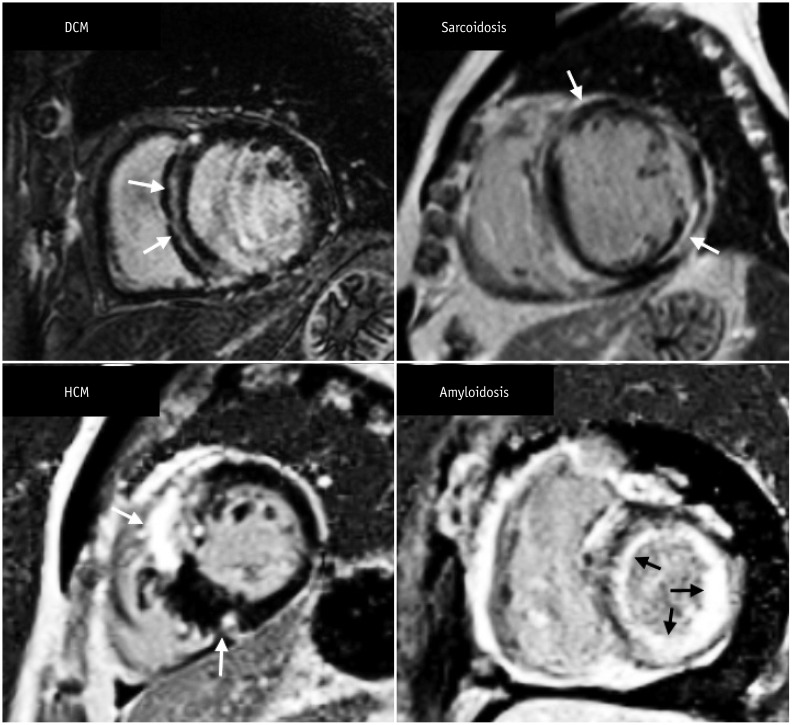 | Fig. 10Short-axis MR images demonstrate LGE pattern in various types of non-ischemic cardiomyopathy.There is mid-wall enhancement in basal, interventricular, septal wall of myocardium in patient with DCM (black arrows), epicardial enhancement in patient with sarcoidosis (white arrows), patchy enhancement at junction of both ventricles in patient with HCM (white arrows), and global subendocardial enhancement in patient with amyloidosis (white arrows). DCM = dilated cardiomyopathy
|
III. Pitfalls
1. Bright ghosting artifacts can occur in areas within the field-of-view that have long T1 species (cerebrospinal fluid, pericardial or pleural effusion, and gastric fluid), poor electrocardiography gating, and poor breath-holding (29). Decreasing scan time (single shot technique), or increasing the average factor is helpful in reducing bright ghosting artifacts.
2. On non-PSIR images, tissues with long T1 value may appear to be enhanced (30).
3. It can be difficult to discriminate no-reflow zones or LV thrombus from viable myocardium. Adding post-contrast cine imaging with LGE may be helpful in the evaluation.
4. If the contrast enhancement is reduced, interpretation of additional sequences may be required. The contrast between the infarcted myocardium, and blood in the inversion recovery image relies on variables such as blood velocity, dosage of contrast material, time from gadolinium administration, clearance rate of contrast media, and imaging parameters. The solution to these problems includes using multiple contrasts, such as T1 and T2, or using blood suppression techniques (3132).
Semi-Quantitative Assessment
II. How-To
1. Several different methods of describing LGE extents are documented in the literature, including manual planimetry, the “n”-standard deviation (SD) technique, and full width at half maximum (FWHM) technique.
-
2. Manual planimetry: It is considered as a subjective technique, because all the measurements depend on a human decision.
A. Outline endocardial and epicardial borders.
B. Perform manual planimetry of the LGE in each short-axis slice.
C. Obtain a sum of LGE areas multiplied by slice thickness plus inter-slice gap, corresponding to the volume of scar/fibrosis.
D. Multiplying this total LGE area by the specific gravity of myocardium supplies the approximate LGE weight, and the ratio of LGE to normal myocardium can be calculated.
-
3. The “n”-SD technique: The rule of thumb is to select the reference myocardium and an appropriate threshold method that produces the results matched to “radiologist's eye.”
A. Outline endocardial and epicardial borders to draw the myocardial ROI.
B. Select a normal “remote” (dark) ROI in the myocardium for the reference SI (mean and SD).
C. The software will distinguish the areas within the myocardial ROI with a SI greater than a certain mean ± SD threshold, which is defined by the operator.
-
D. Select a threshold between the normal myocardium and the area of LGE.
1) The relative SNR between scar tissue and normal myocardium varies according to the type and dose of contrast agent, time after injection, type of sequence, field strength, and the underlying injury itself.
2) There is no fixed cut-off value. Recommended semi-automatic thresholding: n + 5 SD in infarction and n + 3 SD in myocarditis (3334) (Fig. 12).
3) The LGE area within the myocardium is determined automatically.
4) Automated thresholding may provide better reproducibility after appropriate standardization.
5) Manually modify to include no-reflow zones, except for artifacts and LV blood pool, which are caused by an error in drawing the endocardial contour.
6) It is receptive to spatial variations of the radiofrequency (RF) field, generated by the surface coil.
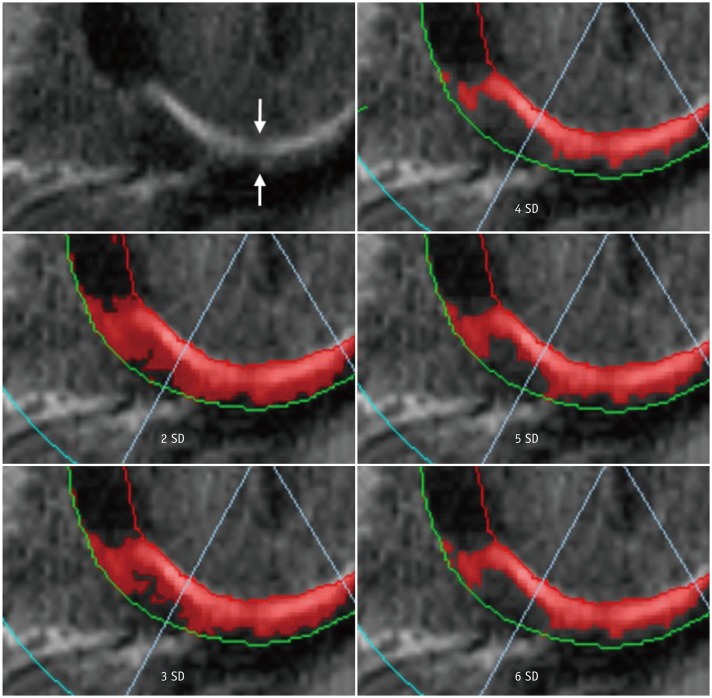
Fig. 12
“n”-SD technique for quantifying LGE extent.
LGE image in 57-year-old man with chest pain shows subendocardial infarction at basal inferior wall of myocardium (arrows). Endocardial and epicardial borders are outlined and region of interest within remote dark myocardium as reference is drawn. According to threshold between enhanced and unenhanced myocardium selected, extent of LGE varies significantly as shown in these color maps. SD = standard deviation
-
4. The FWHM technique: The rule of thumb is to appropriately determine both, the reference and LGE myocardium, so that the results match with those of the “radiologist's eye.” The location and size of ROI for the reference and LGE myocardium can be adjusted to match the results with those of the “radiologist's eye.”
A. Outline the endocardial and epicardial borders to draw the myocardial ROI.
-
B. Evaluate whether the LGE is present. If there is an LGE lesion, choose an ROI that contains the “maximum” signal.
1) Threshold is set at half of the maximal SI within the scar.
2) The FWHM technique is less receptive to spatial variations of the RF field generated by the surface coil than the “n”-SD technique (35).
3) The FWHM technique is more reproducible compared to the “n”-SD technique (3637).
4) The accuracy of the FWHM technique may be reduced compared to the “n”-SD technique if LGE is patchy or gray, because the technique presumes a bright LGE core.
C. Manually modify to include no-reflow zones except for artifacts and LV blood pool, which are caused by an error in drawing the endocardial contour.
T1-Weighted Imaging
Quantitative Assessment
I. What-to-See
-
1. Native T1
A. ‘Native T1’ means tissue longitudinal relaxation time (T1) values, without using contrast agent (38).
B. T1 is affected by water (edema), proteins, and other T1-altering substances (lipid, iron) (39404142). T1 is sensitive to change of composition, and structure of myocardial tissue.
C. It may also be used with terms such as “native myocardial T1,” “pre-contrast T1,” or “non-contrast T1.” “Native T1” or simply “T1” is used in this paper.
D. Native T1 mapping is one of the CMR techniques that provides a parametric map in which each pixel is encoded with a native T1 value (43).
-
2. Post-contrast T1
A. “Post-contrast T1” means tissue longitudinal relaxation time values with the use of a contrast agent.
B. Post-contrast T1 mapping is a CMR technique that provides a parametric map in which each pixel is encoded with a post-contrast T1 value (40).
-
3. Extracellular volume (ECV) fraction or myocardial ECV
A. ECV reflects the fraction of the volume occupied by extracellular space of heart tissues (38). It can be altered by diseases involving the myocardium.
B. Measurements of ECV are obtained by measuring the native and post-contrast T1 of the myocardium and blood.
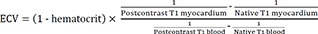
C. Using the relationship between the fraction of plasma and the change in T1 relaxation rate of blood before and after contrast agent administration, the change in T1 relaxation rate in myocardial tissue can be used to estimate ECV (4445). This can be expressed as follows:
D. ECV map can be formed by encoding the ECV value at each pixel (46).
E. ECV measures and predicts the space occupied by the extracellular matrix, which is also associated with the collagen volume fraction (474849).
F. Unless there is infiltrative disease or myocardial edema, it is associated with myocardial fibrosis, and myocardial remodeling.
II. How-To
-
1. Preparation
A. Because normal values may vary due to various causes (sex/age, vendor, field strength, sequence contrast, etc.), normal values should be measured in advance on each MR equipment, with more than 10 healthy volunteers (38).
B. Hematocrit is essential for measuring ECV. A process that can perform the blood test near the time of CMR is needed. As a noninvasive test, the method of obtaining the synthetic ECV using the longitudinal relaxation rate of blood may be used; however, further research is needed (505152).
-
2. Visual check
A. T1 and ECV maps should be displayed with the appropriate color or grayscale, so that the difference from normal is clearly visible, and kept the same within the study.
B. It is necessary to check whether the slices obtained before and after contrast are matched with each other. An error may occur in ECV measurement if they do not match.
-
3. Measurement; drawing ROI
A. ROI should be drawn to minimize partial volume effects.
B. When drawing the ROI, a sufficient distance should be secured from the unclear tissue interface, such as between myocardium and blood.
C. It is necessary to decide whether to include LGE in the drawing area and record whether it is included in the reading. For example, patients with non-ischemic myocardial disease can be drawn to include non-ischemic LGE except for those considered as old infarction.
-
D. Measurement technique
1) Singular measurement: Either measure once in the septum or measure the total myocardium on the short axis and, then, find the mean value. However, if the ROI does not match the pathologic lesion, the disease may be missed (Fig. 13).
2) The 16 segments approach: This measures the total myocardium. However, there can be problems with off resonance or partial volume error (53) (Fig. 14).
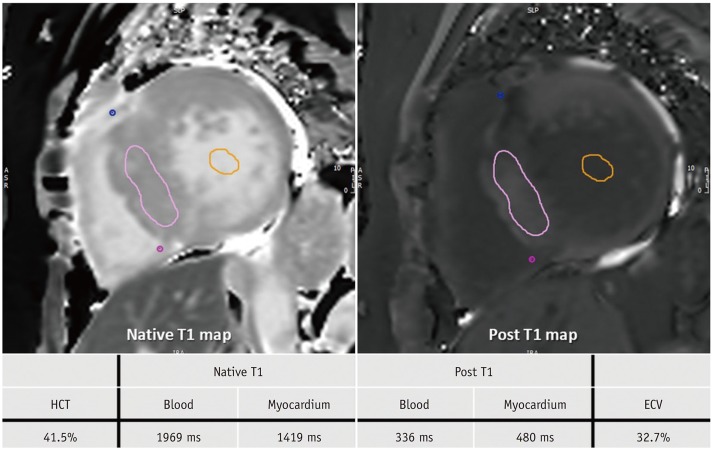
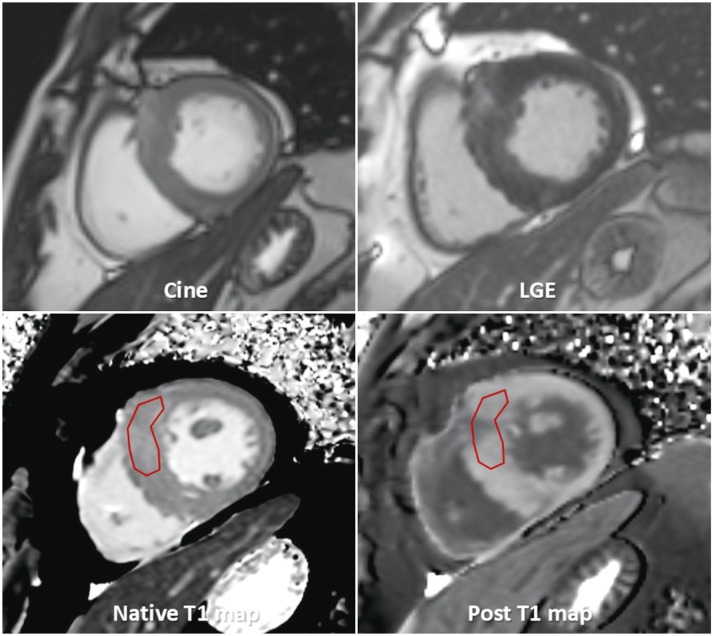
Fig. 13
T1 mapping images of 60-year-old woman with HCM.
After obtaining native T1 and post-contrast T1 values in myocardium and blood, values and HCT are inserted into ECV formula. HCM is usually characterized by high T1 value and high ECV. This patient also had high T1 value of 1419 ms and high ECV value of 32.7%. ECV = extracellular volume, HCT = hematocrit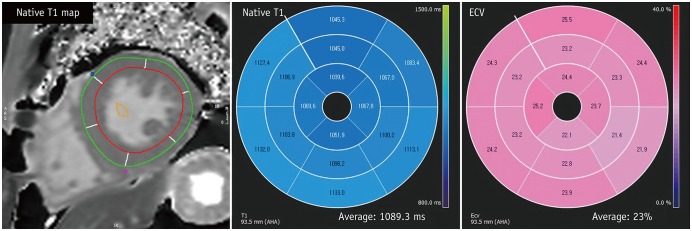
Fig. 14
T1 mapping images of 43-year-old male with Fabry disease.
After drawing endocardial contour and epicardial contour in native T1- and post T1 mapping images, T1 value and ECV are calculated. Fabry disease has special characteristics of low T1 value and normal ECV. This patient also had low T1 value of 1089.3 ms and normal ECV value of 23%.
T2-Weighted Imaging
Visual Assessment
I. What-to-See
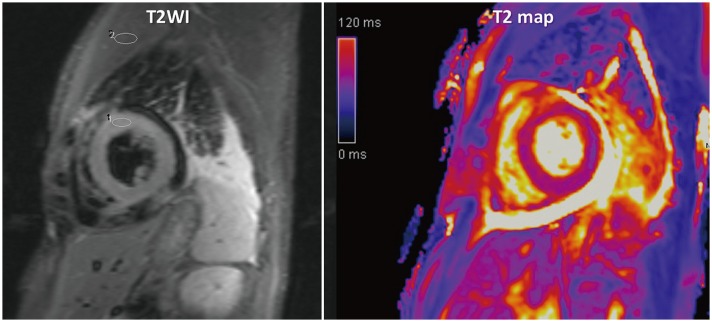
1. The aim is to detect the increased SI area, indicating increased free water content.
2. Indications are acute coronary syndromes, including myocardial infarction (Fig. 15), acute myocarditis (Fig. 16), sarcoidosis, tako-tsubo cardiomyopathy, and heart transplantation rejection.
3. Cleary-detectable high SI area following anatomical borders, and expected regional distribution pattern is suggestive of myocardial edema.
II. How-To
1. Identify appropriate images.
2. Modify image contrast and brightness to minimize SI in the background, and reduce maximal SI in the highest SI area, to remove the “over-shining” effect.
3. Check for artifacts, such as surface coil reception field inhomogeneity, low SI artifacts due to arrhythmia or myocardial motion, and high SI artifacts due to slow flowing blood, especially in dark-blood triple-inversion recovery spine echo (short tau inversion recovery, turbo inversion recovery magnitude) images.
Semi-Quantitative Assessment
II. How-To
1. Draw the largest ROI for short-axis views in the serratus anterior muscle (global SI), and the ROI in the affected myocardial area (regional SI).
2. Divide the regional SI by global SI.
3. Cut-off value of SI ratio is 1.9 in dark-blood triple-inversion recovery spine echo images (54).
T2* Imaging
Quantitative Assessment
I. What-to-See
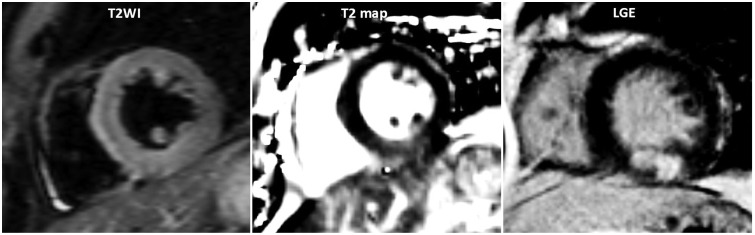
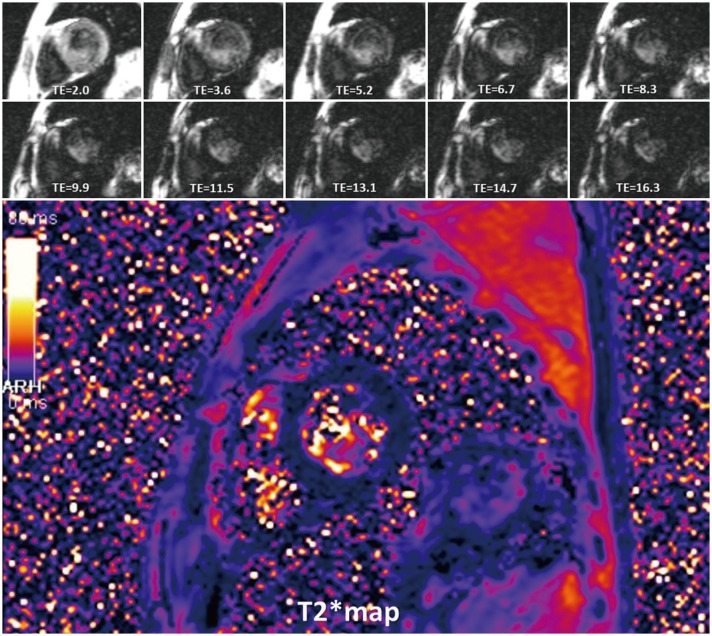
1. The aim is to detect myocardial hemorrhage or iron deposition (Fig. 17).
2. If iron burden is increasing, rapid signal loss develops along with increasing echo time (TE).
II. How-To
1. Draw the ROI of the ventricular septum with avoidance of blood pool, and proximal blood vessels (full-thickness ROI).
2. Calculate mean myocardial SI from the ROI.
3. Check SI with changes of TE, and get a mono-exponential curve.
4. Truncate the curve by removing later TEs, to avoid underestimating T2* in patients with heavy iron overload (55).
5. Cut-off value of T2* at 1.5 tesla is 40 ms (56).
6. T2* < 20 ms indicates cardiac iron overload, and T2* < 10 ms indicates increased risk of developing heart failure (5758).
7. T2* evaluation at 3 tesla is not recommended.
Sample Report
Example 1: HCM
Example 2: Ischemic Heart Disease
I. Imaging findings:
-
1. Conclusion
A. Impaired LV global systolic function (EF, 45.9%)
Normal LV cavity size (left ventricular end-diastolic volume index, 79.1 mL/m2)
B. Delayed enhancement (Fig. 19)
75–100% transmural infarct at LV mid anterior and septal wall, apical anterior, septal, and inferior wall, and apex
Associated with large amount of no reflow zone → suggesting acute myocardial infarction of left anterior descending artery territory
C. Regional wall motion abnormality (+)–see findings
D. Pericardial effusion
-
2. Findings
-
A. Delayed enhanced segments
1) Basal anterior (−)
2) Basal anteroseptal (−)
3) Basal inferoseptal (−)
4) Basal inferior (−)
5) Basal inferolateral (−)
6) Basal anterolateral (−)
7) Mid anterior (+): 100% transmurality, 4/4 of area
8) Mid anteroseptal (+): 100% transmurality, 4/4 of area
9) Mid inferoseptal (+): 75% transmurality, 2/4 of area
10) Mid inferior (−)
11) Mid inferolateral (−)
12) Mid anterolateral (−)
13) Apical anterior (++): 75% transmurality, 4/4 of area
14) Apical septal (+): 75% transmurality, 4/4 of area
15) Apical inferior (+): 75% transmurality, 4/4 of area
16) Apical lateral (+): 75% transmurality, 4/4 of area
17) Apex (+)
-
B. Motion (1, normokinesia; 2, hypokinesia; 3, akinesia; 4, dyskinesia; 5, aneurysm)
1) Basal anterior: 1
2) Basal anteroseptal: 1
3) Basal inferoseptal: 1
4) Basal inferior: 1
5) Basal inferolateral: 1
6) Basal anterolateral: 1
7) Mid anterior: 3
8) Mid anteroseptal: 3
9) Mid inferoseptal: 2
10) Mid inferior: 1
11) Mid inferolateral: 1
12) Mid anterolateral: 1
13) Apical anterior: 3
14) Apical septal: 3
15) Apical inferior: 3
16) Apical lateral: 2
17) Sum of cardiac motion index = 28
-
C. LV function measurement (absolute [normalized])
-
D. Forward volume/reverse volume/net forward volume (mL)
-

 XML Download