

 PDF
PDF ePub
ePub Citation
 Print
Print


INTRODUCTION
High blood pressure (BP) is the leading global cause of death and disability.1) While extensive evidence supports the beneficial effects of rapid BP control below the target in preventing mortality and cardiovascular disease (CVD),2) initial treatment with monotherapy is often insufficient or slow to achieve the BP target.3) Observational studies and meta-analyses have suggested that initial combination of hypertensive treatments confers a decreased risk for CVD compared to monotherapy.4)5)6) Therefore 2018 European Society of Cardiology (ESC)/European Society of Hypertension (ESH) guideline recommends dual combination treatment as initial therapy in most hypertensive patients rather than monotherapy.7) Despite the evidences from previous randomized controlled trials (RCTs) that directly compared the effects of different combination regimens,8)9)10)11) the optimal first-line antihypertensive combination regimen is a matter of controversy because 1) the results were heterogeneous, 2) the baseline characteristics of the study population were mostly at a high risk for CVD, and 3) most participants had taken anti-hypertension medications at baseline in these RCTs.
Therefore, we aimed to compare the therapeutic effectiveness of dual combination regimens in large cohorts of treatment-naïve hypertensive patients without CVD at baseline who initiated treatment with 2 out of the following 3 classes of drugs: angiotensin system blockage (angiotensin converting enzyme inhibitors [ACEIs]/angiotensin-receptor blockers [ARBs]), calcium channel blockers (CCBs), and thiazide diuretics (TZDs).
METHODS
Data source
The study consisted of a retrospective analysis of five data sources encoded in the Observational Medical Outcome Partnership (OMOP) Common Data Model (CDM) version 5 from participating research partners across the Observational Health Data Sciences and Informatics (OHDSI) community.12) All 5 data sources are administrative claims databases: OptumInsight's Clinformatics™ Data Mart (CEDM, 79,600,000 subjects), Truven MarketScan Commercial Claims and Encounters (CCAE, 135,000,000 subjects), Truven MarketScan Medicare Supplemental Beneficiaries (Medicare, 9,800,000 subjects), Truven MarketScan Multi-State Medicaid (Medicaid, 25,500,000 subjects) from US, and the National Health Insurance Service-National Sample Cohort (NHIS-NSC, 1,100,000 subjects)13) from Korea.
This study was performed through a network model of OHDSI, where access to data and statistical testing was executed inside each data partner's institution. The entire analytical process was pre-specified before execution. Only pre-specified aggregated results lacking patient-level information were collected for interpretation and meta-analysis. Each data partner obtained the necessary Institutional Review Board (IRB) approval or exemption (IRB number: AJIRB-MED-EXP-17-054).
Study population
The cohort included adults (≥20 years) with hypertension whose first anti-hypertensive treatment was initiated with recommended first-line dual combination regimens from 2001 to 2017. The entry date in the cohort (index date) was defined as the date of first prescription of one of the combination drugs. The second class of antihypertensive medications should have been started within 30 days after index date. Only patients, enrolled in the database for at least 1 year before the index date, were included to avoid left censoring. Patients who had a prescription containing an ACEI/ARB, β-blocker, CCB, or TZD during the 12 months preceding the index date were excluded to limit the study to treatment-naïve subjects. The list of anti-hypertensive drugs is presented in the Supplementary Table 1. Patients who had a previous history of ischemic heart disease, stroke, or heart failure before the index date were also excluded.
Exposure
Three matched cohorts using the recommended combination treatments were created: ACEI/ARB+CCB (A+C) vs. ACEI/ARB+TZD (A+D), CCB+TZD (C+D) vs. A+C, and C+D vs. A+D. The exposure was started when one drug of interest was prescribed without history of any anti-hypertensive medication within previous 365 days. Continuous drug exposures were constructed by allowing fewer than 30-day gaps between prescriptions. Only patients who continued both classes of drugs for more than 180 days were included in the primary analysis. Patients starting a third class of drug within 180 days of the index date were excluded.
Outcomes
The primary outcome was all-cause mortality occurring at least 180 days after the index date. The secondary outcomes were incident myocardial infarction (MI) requiring hospitalization, stroke requiring hospitalization, heart failure requiring hospitalization, and major adverse cardiac and cerebrovascular events (MACCE) as a composite outcome including MI, stroke, heart failure, and mortality occurring at least 180 days after the index date. Diagnosis codes for outcomes are listed in Supplementary Table 2.
Statistical analysis
Large-scale propensity score (PS)14) matching was used to balance the differences in baseline characteristics between treatment groups (R, "CohortMethod” package). PS was estimated using L1-regularized large-scale logistic regression models based on all available demographic characteristics, medical, medication, and procedure history with the L1 penalty hyper-parameter selected through 10-fold cross-validation using high-performance computing.15) The details of covariates for propensity score matching and prespecified statistical analysis plan are presented in supplemental statistical analytic plan.
The PS was transformed to preference scores that account for differences in drug prevalence and availability. Confounding control was assessed by preference score distributions and covariate balance metrics. One-to-one greedy-search matching was used to match patients using a caliper of 0.15 times the standard deviation of the propensity score distribution. Cox proportional hazards models were used to compare the matched cohorts. After combining the results from five data sources, random effects model meta-analysis was performed to calculate summary hazard ratios and rate differences.
The same analytical process was adopted for subgroup and sensitivity analyses. Subgroup analyses included stratification by age (<60 years and ≥60 years) and gender. Medicare data were not included in the subgroup analysis for younger patients.
A pre-specified p<0.05 was considered statistically significant for all two-sided tests. The entire analytical protocol and code is available on github (https://github.com/OHDSI/StudyProtocolSandbox/tree/master/HypertensionCombination) for reproducibility, which enables other researchers to perform and replicate this study with any database in the format of OMOP-CDM.
Sensitivity analyses
To assess the robustness of results with respect to the definition of combination treatment, we re-ran the same analyses using 30-day, 1-year, and 2-year periods of initial regimen continuation. This could also estimate proportion of continuation over 180 days and the trend of survival difference along the duration of the initial regimen continuation.16)
A total of 39 negative control outcomes were employed to quantify systematic error.17) These negative control outcomes were unlikely to have a relationship with anti-hypertensive medications, identified through a data-rich algorithm.18) For further calibration of p values for the outcomes, we fit an empirical null distribution to these negative control point estimates to allow further calibration of p values.19) While also pre-specified, sensitivity and subgroup analyses were nonetheless regarded exploratory. After collection of the results, the meta-analysis aggregating only the results from US data sources was conducted as a sensitivity analysis.
RESULTS
Baseline characteristics of study population
A total of 1,062,605 patients were identified across five data sources. Three one-to-one propensity-score-matched cohorts were created by comparing A+C vs. A+D (n=445,372), C+D vs. A+C (n=64,688), and C+D vs. A+D (n=77,026). Among these patients, the covariates were well-balanced between treatment regimens after PS matching in each data source. The aggregated baseline characteristics of the study population across data sources before and after PS matching of three comparisons are summarized in Table 1. The PS distribution and the baseline characteristics of each data source before and after matching are presented in Supplementary Figure 1 and Supplementary Tables 3-7.
Table 1
Baseline characteristics of all propensity-score-matched patients
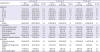
The total follow-up duration was 1,806,077 person-years (mean, 3.1 years). The median age ranged from 55 to 59 years in A+C vs. A+D, 60 to 64 years in C+D vs. A+C, and 60 to 64 years in C+D vs. A+D comparison. Approximately one-third of study patients (29.6–35.6%) had been treated with 3-hydroxy-3-methylglutaryl coenzyme A (HMG-CoA) reductase inhibitors previously. The frequency of patients with a history of diabetes ranged from 13.6% to 21.4% and was the highest in the A+C and A+D comparison. About one-fifth of the cohort from NHIS-NSC also had results from a national health examination during the previous year of enrollment. Most examination measurements including BP were balanced after matching other patient characteristics, even though data from examinations were not included in the model to calculate the propensity score (Supplementary Table 7).
Primary and secondary outcome assessment
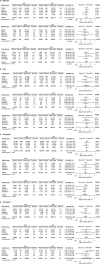
For the primary outcome of overall mortality, there were no significant differences between any of the combination treatment in each data source (Figure 1). Moreover, the summary hazard ratio (HR) from 5 data sources did not demonstrate a statistically significant difference in mortality between recommended dual combination regimens (summary rate difference [RD], 0.53 [95% confidence interval {CI}, −0.06 to 1.13] per 1,000 person-years; summary HR, 1.08 [95% CI, 0.97 to 1.20]; p=0.127 for A+C vs. A+D; summary RD, −0.45 [95% CI, −0.95 to 0.04]; summary HR, 0.93 [95% CI, 0.87 to 1.01]; p=0.067 for C+D vs. A+C; summary RD, 0.72 [95% CI, −0.74 to 2.18]; summary HR, 1.18 [95% CI, 0.95 to 1.47]; p=0.104 for C+D vs. A+D) (Figure 2).
Figure 1
Kaplan-Meier plots for overall survival comparing different dual combination treatments in propensity score-matched cohorts from each data source. (A) CEDM, (B) CCAE, (C) Medicare, (D) Medicaid, and (E) NHIS-NSC.
A = angiotensin converting enzyme inhibitors/angiotensin-receptor blockers; C = calcium-channel blocker; CCAE = Truven MarketScan Commercial Claims and Encounters; CEDM = OptumInsight's Clinformatics™ Data Mart; D = thiazide diuretics; Medicaid = Truven MarketScan Multi-State Medicaid; Medicare = Truven MarketScan Medicare Supplemental Beneficiaries; NHIS-NSC = National Health Insurance Service-National Sample Cohort.
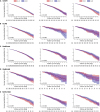
Figure 2
Forest plots depicting HR and 95% CI for primary outcome in each data source. The overall HRs were calculated using a random-effects model. The size of data markers indicates the weight of the study. Error bars indicate 95% CIs. (A) A+C vs. A+D, (B) C+D vs. A+C, and (C) C+D vs. A+D.
A = angiotensin converting enzyme inhibitors/angiotensin-receptor blockers; C = calcium-channel blocker; CCAE = Truven MarketScan Commercial Claims and Encounters; CEDM = OptumInsight's Clinformatics™ Data Mart; CI = confidential interval; D = thiazide diuretics; HR = hazard ratio; Medicaid = Truven MarketScan Multi-State Medicaid; Medicare = Truven MarketScan Medicare Supplemental Beneficiaries; NHIS-NSC = National Health Insurance Service-National Sample Cohort.
*Event rate per 1,000 person-year.
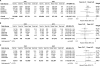
The result for secondary outcomes is summarized in Figure 3. The combination treatment regimens had similar effectiveness for prevention of MI (all p>0.05). A+C combination was associated with slightly higher risk of heart failure compared to A+D combination (summary HR, 1.09 [95% CI, 1.01 to 1.18]; p=0.040). A+C combination also was related with worse outcome for stroke admission compared to A+D combination (summary HR, 1.08 [95% CI, 1.01 to 1.17]; p=0.040). MACCE risk was not different across the matched cohorts (summary HR, 1.05 [95% CI, 1.00 to 1.11]; p=0.051 for A+C vs. A+D; summary HR, 1.01 [95% CI, 0.85 to 1.21]; p=0.857 for C+D vs. A+C; summary HR, 1.12 [95% CI, 0.85 to 1.43]; p=0.263 for C+D vs. A+D). The relationship between combination treatment and secondary outcome in each data source is described in Supplementary Figure 2.
Figure 3
Forest plots depicting HR and 95% CI for secondary outcomes in each data source. The overall HRs were calculated using a random-effects model. The size of data markers indicates the weight of the study. Error bars indicate 95% CIs. (A) Myocardial infarction, (B) Heart failure, (C) Stroke, and (D) MACCE.
A = angiotensin converting enzyme inhibitors/angiotensin-receptor blockers; C = calcium-channel blocker; CCAE = Truven MarketScan Commercial Claims and Encounters; CEDM = OptumInsight's Clinformatics™ Data Mart; CI = confidential interval; D = thiazide diuretics; HR = hazard ratio; MACCE = major adverse cardiac and cerebrovascular event; Medicaid = Truven MarketScan Multi-State Medicaid; Medicare = Truven MarketScan Medicare Supplemental Beneficiaries; NHIS-NSC = National Health Insurance Service-National Sample Cohort.
*Event rate per 1,000 person-year.
Subgroup analysis
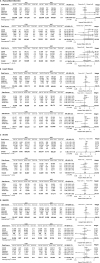
The summary HRs of overall mortality in subgroups stratified by gender and age are depicted in Figure 4. In women, A+C therapy was related with worse survival than A+D therapy (summary HR, 1.20 [95% CI, 1.09 to 1.31]; p=0.006). In men, C+D therapy was associated with worse survival outcome compared to A+D therapy (summary HR, 1.31 [95% CI, 1.12 to 1.53]; p=0.009). There was no difference in overall mortality between recommended combination therapies in young (<60 years) and old patient (≥60 years) groups.
Figure 4
Forest plots depicting HR and 95% CI for primary outcome in subgroups. The overall HRs were calculated using a random-effects model. The size of data markers indicates the weight of the study. Error bars indicate 95% CIs. (A) Women, (B) Men, (C) ≥60 years, (D) <60 years.
A = angiotensin converting enzyme inhibitors/angiotensin-receptor blockers; C = calcium-channel blocker; CCAE = Truven MarketScan Commercial Claims and Encounters; CEDM = OptumInsight's Clinformatics™ Data Mart; CI = confidential interval; D = thiazide diuretics; HR = hazard ratio; MACCE = major adverse cardiac and cerebrovascular event; Medicaid = Truven MarketScan Multi-State Medicaid; Medicare = Truven MarketScan Medicare Supplemental Beneficiaries; NHIS-NSC = National Health Insurance Service-National Sample Cohort.
*Event rate per 1,000 person-year.
Sensitivity analyses
The proportion of patients with adherence to initial combination therapy was about two-thirds for 365 days and about one-thirds for 730 days compared to 180 days: 63.7% in A+C, 61.7% in A+D, 62.2% in C+D group for 365 days; 31.6% in A+C, 29.5% in A+D, 28.6% in C+D group for 730 days. A+C cohorts with minimum 365 days on continuation of combination therapy showed worse survival than A+D cohorts (summary HR, 1.15 [95% CI, 1.03 to 1.29]; p=0.026). Other results from the sensitivity analyses using various minimum periods of dual drug continuation did not indicate any significant difference in all-cause mortality (Supplementary Figure 3).
In the absence of bias, estimates among 95% of negative control outcomes are theoretically expected to include a HR of 1. Among 39 negative control outcomes, less than 5% analyses had a significant relationship with the specific combination treatment. All results from analysis of negative control outcomes are presented in Supplementary Figure 4. Calibrated p values based on the results of negative control outcomes analysis are also shown in Supplementary Table 8. The finding from the meta-analysis combining only the results from the US data sources was concordant with the finding from meta-analysis combining all results including the results from NHIS-NSC. All confidential intervals of the HR were overlapped for primary and secondary outcomes (Supplementary Table 9).
DISCUSSION
Based on the results of this real-world retrospective cohort study, there appears to be no significant difference in all-cause mortality between A+C, A+D, and C+D combination as first-line treatments of hypertension. This finding is consistent across the heterogeneous cohorts in both US and Korea, regardless of variability in the healthcare system. There was a slight benefit with initial A+D combination treatment for heart failure and stroke prevention over A+C.
To the best of our knowledge, this is the first study comparing effectiveness of first-line dual anti-hypertensive combinations in patients without CVD at baseline. Dual combination treatment in hypertension increases effectiveness and reduces adverse effects compared to monotherapy.5)20) 2018 ESC/ESH guideline recommends anti-hypertensive therapy should be initiated with combination regimen preferentially based on A+C or A+D.7) Notwithstanding, the evidence for head-to-head comparison of the combination regimens has been scarce.
In 2008, Jamerson et al. reported benefits of A+C treatment over A+D in reducing cardiovascular events in Western patients with high risk for CVD.8) Conversely, two Japanese studies did not demonstrate a significant difference between various combination regimens in preventing cardiovascular events. Matsuzaki et al.21) compared the CCB-based combinations with ARB, β-blocker, or TZD and demonstrated that all three combinations had similar efficacy for prevention of CVD and the achievement of target BP in population without high risk for CVD. Moreover, in a study by Ogihara et al.,9) there was no significant difference in terms of reduction of cardiovascular events between a combination of ARB and CCB versus ARB and TZD. In a meta-analysis analyzing the aforementioned RCTs, the all-cause mortality was not different between A+C and other combinations.22)
It is well-known that TZD is better for the prevention of heart failure compared to CCB.23)24) Although a previous meta-analysis demonstrated that CCB is the most effective drug class for stroke prevention, the protective effects of CCB for stroke were not significant compared to TZD.23)24) In this study, A+D treatment was associated with lower incidence of heart failure and stroke compared to A+C treatment, which should be interpreted with caution. A+D also showed benefits over A+C in women. A previous study reported that CCB monotherapy was associated with a greater risk of cardiovascular death compared to diuretics monotherapy in women.25) However, in another meta-analysis, there was no significant gender difference in efficacy among various classes of anti-hypertensive agents between men and women.26) The long-term effectiveness of dual anti-hypertensive combinations between sexes should be investigated further.
For assessing study robustness and residual systemic error, extensive efforts were made, including analysis of negative control outcomes. We demonstrated that body mass index, systolic BP, smoking history, and other laboratory measures were well-matched in the sub-cohort of NHIS-NSC after PS matching even though these variants were not included in the PS model. Furthermore, the results from analyses on various minimum drug continuation periods were consistent. The numbers of patients who took the initial combination therapy for at least 365 days and 730 days were about two-thirds and one-third of the number in the original 180-day cohort, respectively. Although this number is low, it is in line with a previous cohort study in Italy, which demonstrated a medication discontinuation rate of 41% at 1 year and 50% at 5 years after initiation of monotherapy.27)
Consistent findings demonstrated across the US and Asian cohorts analyzed under the same pre-specified analysis suggest generalizability of the study. Since all protocols and analytic codes are available publicly, the detailed review and reproduction of this study is possible. Still, this study carries several limitations. First, because of the nature of retrospective study, the true balance of baseline characteristics between cohorts and accuracy of non-fatal cardiovascular outcomes cannot be guaranteed. Although this problem can only be solved by RCTs, a randomized outcomes study to compare three different regimens in treatment-naïve hypertensive patients without previous CVD is unlikely to be feasible. Second, we could not assess the racial proportions in data sources except in the Medicaid, although we demonstrated that there was no difference in the effectiveness of combination regimens between US and Korean populations. Third, the overall mortality rate might be underestimated in the four US administrative datasets, because only hospital-reported mortality was captured in these data sources. Fourth, we did not adjust for dosage of anti-hypertensive medications and single-pill combinations. Although adherence to the single-pill combination is reported to be higher than individual-pill combination, the meta-analysis concluded that beneficial effects of single-pill combination in changes to BP or adverse effects was not significant.28) To assess potential bias caused by compliance, we replicated the same analysis in the cohorts with various initial regimen continuation periods, in which the results were consistent with those of the primary analysis. Fifth, although a recent meta-analysis showed no significant differences in cardiovascular outcomes between ACEIs and ARBs,29) whether these two classes of drugs can be considered a single class may be a matter of controversy. Lastly, an aggregate meta-analysis approach without pooling the individual data can be another limitation of this study. Nonetheless, a previous study demonstrated that an aggregate meta-analysis approach generates estimates at least as accurate and precise as pooled dataset analysis, especially when the effects of interest are heterogeneous.30)
In conclusion, this is the first observational study comparing effectiveness of first-line dual combination treatments in multi-national heterogeneous cohorts in real-world practice. In this study, there is no significant difference in mortality among recommended dual combination treatment regimens in treatment-naïve hypertensive patients without previous CVD. This finding provides evidence for comparable effectiveness between recommended initial anti-hypertensive combination treatments in real-world practice.
 XML Download