

 PDF
PDF ePub
ePub Citation
 Print
Print


INTRODUCTION
Current guidelines recommend decision making based on the SYNergy between percutaneous coronary intervention with TAXus and cardiac surgery (SYNTAX) score (SS) for patients with left main and/or 3-vessel disease.1)2) Five-year clinical outcomes from the SYNTAX trial showed that the major adverse cardiac and cerebrovascular events (MACCE) were similar between the percutaneous coronary intervention (PCI) arm and the coronary artery bypass graft (CABG) arm in patients with low/intermediate SS (0–32).3)4) In contrast, MACCE was significantly higher after PCI than after CABG in patients with high scores (≥33). Recently, SS II was proposed to overcome the limitations of anatomical SS by incorporating clinical variables, such as age, sex, creatinine clearance, left ventricular (LV) ejection fraction, chronic obstructive pulmonary disease, and peripheral vascular disease. However, SYNTAX trials were performed with paclitaxel-eluting stent, which is not used any more. Contemporary second-generation drug-eluting stent (DES), especially cobalt-chromium everolimus-eluting stent (CoCr-EES), demonstrated better safety and efficacy outcomes.5)6)7)8) CoCr-EES was suggested to have the best combination of efficacy and safety6) and may be one of the most advanced contemporary DESs. SS systems, including SS and SS II have not been validated in CoCr-EES; thus, we are not confident that the current guidelines based on SS systems can be justified in the contemporary DES era. In this study, we aimed to test whether the anatomical SS and SS II in incorporating clinical factors could still effectively predict the outcomes of patients with left main and/or 3-vessel disease undergoing PCI with the contemporary CoCr-EES.
METHODS
Extended information of the Methods is presented in the Supplementary Data.
Study design and population
Patients were enrolled from multicentre prospective registries which are the Efficacy of Xience/promus versus Cypher in rEducing Late Loss after stENTing registry (NCT00698607) and Efficacy and Safety of Xience in Coronary artEry Disease aLL-comers After stENTing Using the PRIME Platform registry (NCT01605721). The study protocol was approved by the ethics committee at each participating centre, and was conducted according to the principles of the Declaration of Helsinki. All patients provided written, informed consent for participation in the registry. Clinical follow-up was performed upto 36 months after index PCI. All clinical events were reviewed by a clinical event committee whose members were unaware of the study purpose. Among patients enrolled in these registries, those with left main disease or 3-vessel disease who underwent CoCr-EES (Xience V, Promus, or Xience Prime) implantation were included in the current analysis.
Calculation of the SYNergy between percutaneous coronary intervention with TAXus and cardiac surgery score
For calculation of the SS, quantitative analysis of baseline coronary angiographic images was performed by 3 specialized QCA technicians at the Seoul National University Hospital Cardiovascular Clinical Research Centre Angiographic Core Laboratory. The core lab has been validated with SS calculation, showing measurement correlation above 95%.9) Baseline SS was defined as the SS at initial coronary angiography. Based on the anatomical SS, the SS II was calculated as has been described in detail previously.10) SS II was also calculated in the core laboratory, with scores assigned for the presence and magnitude of each predictor.
Study endpoints and definitions
The primary endpoint is the patient-oriented composite endpoint (POCE). POCE was defined as a composite of all-cause death, any myocardial infarction (MI; including non-target vessel territory), and any repeat revascularization (including all target and non-target vessels, regardless of percutaneous or surgical methods). Secondary endpoints were target lesion failure (TLF: a composite of cardiac death, target-vessel MI, and target lesion revascularization) and the individual components of the POCE. Extended description of the endpoint definitions is included in the Supplementary Data.
Statistical analyses
All variables and outcome analysis were based on SS and SS II. Data are presented as numbers and frequencies for categorical variables and as mean±standard deviation for continuous variables. For comparison among groups, χ2 (or the Fisher exact test when any expected count was <5 for a 2×2 table) test for categorical variables and unpaired Student t-test or 1-way analysis of variance for continuous variables were applied. To estimate the independent effect of SS and SS II on clinical outcome, a multivariable Cox proportional hazards regression model using a stepwise algorithm was used. SS (or SS II) was entered both as a continuous variable (to analyze the independent incremental risk by each point) or as a strata (to analyze the independent incremental risk by strata) in 2 different models. The Kaplan-Meier event curves were drawn up to 36 months and the log rank test was used to analyse the significance in difference of clinical outcomes. Area under the curve (AUC) of receiver operating characteristic (ROC) curves for baseline SS and clinical SS were performed. To compare the discriminative ability of the baseline SS and SS II, and the net reclassification improvement (NRI) and integrated discrimination improvement (IDI) statistics were calculated.11) A 2-sided probability value less than 0.05 was considered statistically significant. Statistical tests were performed using SPSS, V20 (SPSS Inc., IBM Corp., Armonk, NY, USA) and R programming language, version 3.0.2 (R Foundation for Statistical Computing, Vienna, Austria).
RESULTS
SS in patients with left main and/or 3-vessel disease
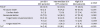
A total of 1,248 patients with left main and/or 3-vessel disease were enrolled in the current analysis. Mean SS was 21.1±9.6, while 698 patients (55.9%) were treated with XienceV or Promus and 550 (44.1%) patients were treated with Xience Prime. Using the original cut off values defined as high, intermediate, and low SS,12) the population was divided into 3 groups: low SS (SS≤22), 729 patients (58.4%); intermediate SS (23≤SS≤32), 362 patients (29.0%); and high SS (SS≥33), 157 patients (12.6%). Baseline characteristics of each group are shown in Table 1. Patients with higher SS were older and had a lower LV ejection fraction, whereas other clinical factors were similar between groups. Regarding lesion characteristics, left main and bifurcation lesions were more common in the high SS group. Stent numbers were higher, and the total stent length was longer in the high SS group. SS showed good calibration for 3-year POCE prediction (R2=0.949, Supplementary Figure 1), and the rate of the 3-year POCE was significantly increased along with SS group, indicating that SS can still effectively predict the clinical outcomes in CoCr-EES era (15.2%, 111 patients; 19.9%, 72 patients; and 27.4%, 43 patients; p<0.001 for trend, in the low, intermediate, and high SS group, respectively; Table 2). Three-year TLF also showed a similar trend. The difference was mainly driven by all-cause death and any revascularization. Although statistically insignificant, MI rate numerically increased along with SS. A Kaplan-Meier analysis curve proved significant discrimination of the 3-year POCE and 3-year TLF between SS groups (Figure 1). A multivariable Cox regression model revealed SS as an independent risk factor for 3-year POCE along with diabetes mellitus, chronic renal failure, and hypertension (Table 3).
Table 1
Baseline clinical and angiographic characteristics of patients according to baseline SS
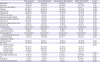
Data are shown as mean±standard deviation or number (%). Complete revascularization was defined as a residual SS of 0.
ACS = acute coronary syndrome; CAD = coronary artery disease; CVA = cerebrovascular accident; LV = left ventricular; PCI = percutaneous coronary intervention; SS = SYNergy between percutaneous coronary intervention with TAXus and cardiac surgery score.
*Smoking: current smokers/ex-smokers/never smokers; †Clinical diagnosis: stable angina/unstable angina/non-ST elevation myocardial infarction.
Table 2
Clinical outcomes according to SS strata

Values are presented as number (%).
MI = myocardial infarction; POCE = patient oriented composite endpoint; SS = SYNergy between percutaneous coronary intervention with TAXus and cardiac surgery score; TLF = target lesion failure.
*Including all cause death, all cause MI and revascularization; †Cardiac death, target vessel MI, target lesion revascularization.
Figure 1
Kaplan-Meier curve according to SS, for (A) 3-year POCE, and (B) 3-year TLF. 3-year POCE and 3-year TLF increased along with SS, in the low-, intermediate-, and high SS group (low SS, SS<23; intermediate SS, 23≤SS≤32); high SS, SS>32).
POCE = patient-oriented composite endpoint; SS = SYNergy between percutaneous coronary intervention with TAXus and cardiac surgery score; TLF = target lesion failure.
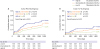
Table 3
Independent predictors of 3-year POCE*
SS was entered both as a continuous variable (to analyze the effect of each point) or as a strata (to analyze the independent incremental risk by strata) in 2 different models. The HR of variables other than SS was calculated from the model that included SS as a continuous variable.
CI = confidence interval; HR = hazard ratio; POCE = patient oriented composite endpoint; SS = SYNergy between percutaneous coronary intervention with TAXus and cardiac surgery score.
*Including all cause death, all cause myocardial infarction and revascularization.
Comparison of the predictive power between baseline SS and SS II
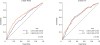
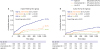
Subsequently, we calculated SS II in our study population and compared its predictive power with that of SS. SS II was available in 1,120 patients and varied from 11.0 to 78.2 (median 34.2, interquartile range: 27.1, 42.8). SS II showed good calibration for POCE prediction in our study population (R2=0.977, Supplementary Figure 2). With regard to the predictive power for 3-year POCE, SS II was superior to SS (AUC for 3-year POCE: 0.611 vs. 0.669 for SS vs. SS II, p=0.019). However, SS II had no additive value in predicting 3-year TLF compared with SS (AUC for 3-year TLF: 0.661 vs. 0.661 for SS vs. SS II, p=0.996; Figure 2, Supplementary Table 1). SS II showed markedly enhanced predictability for all-cause mortality rather than for non-target lesion related cardiac events (non-toll-like receptor, non-target vessel MI) compared with SS (Supplementary Figure 3). It demonstrated that all-cause mortality was a major factor determining the difference of predictability between SS II and SS. Regarding left main and/or 3-vessel coronary artery disease subsets, SS II had a higher predictive value compared with SS for 3-year POCE, both in patients with left main disease (AUC for 3-year POCE: 0.598 vs. 0.652 for SS vs. SS II, p=0.031) and 3-vessel disease (AUC for 3-year POCE: 0.601 vs. 0.658 for SS vs. SS II, p=0.028). The predictive values of various scoring systems (i.e., SS, residual SS, EuroSCORE, Society of Thoracic Surgery risk score, Mayo Clinic risk score for PCI, age, creatinine, ejection fraction (ACEF) score, and the modified ACEF score) were additionally compared (Supplementary Figure 4, Supplementary Table 2). The results showed that SS II had numerically the largest AUC for 3-year POCE and 3-year TLF.
Figure 2
Comparison of the SS and SS II. By the AUC of the receiver operating characteristic curve, SS II was superior to SS for predicting 3-year POCE, but equivocal for predicting 3-year TLF.
AUC = area under the curve; POCE = patient-oriented composite endpoint; SS = SYNergy between percutaneous coronary intervention with TAXus and cardiac surgery score; TLF = target lesion failure.
The population was divided into 3 strata according to SS II: low SS II (SS II<30), 388 patients (34.3%); intermediate SS II (30≤SS II≤40), 377 patients (33.3%); high SS II (SS II>40), 367 patients (29.4%). All clinical events increased along with SS II strata as in Table 4, and the survival curve showed fair discrimination by SS II strata (Figure 3). A multivariable Cox regression model revealed SS II as an independent predictor of 3-year POCE with an HR of 1.758 per strata (95% CI, 1.430–2.162; p<0.001; Supplementary Table 3). In addition, NRI and IDI analysis showed that SS II had better prognostic value for 3-year POCE compared with SS (NRI: p=0.020; IDI: p=0.050) but had similar prognostic value for 3-year TLF (NRI: p=0.697; IDI: p=0.517).
Table 4
Clinical outcomes according to SS II strata
Values are presented as number (%).
MI = myocardial infarction; POCE = patient oriented composite endpoint; SS = SYNergy between percutaneous coronary intervention with TAXus and cardiac surgery score; TLF = target lesion failure.
*Including all cause death, all cause MI and revascularization; †Including cardiac death, target-vessel MI, and target lesion revascularization.
Figure 3
Kaplan-Meier curve according to SS II strata, for (A) 3-year POCE, and (B) 3-year TLF. 3-year POCE and 3-year TLF increased along with SS II, in the low-, intermediate-, and high SS II group (low SS II, SS II<30; intermediate SS II, 30≤SS II≤40); high SS II, SS II>40).
POCE = patient-oriented composite endpoint; SS = SYNergy between percutaneous coronary intervention with TAXus and cardiac surgery score; TLF = target lesion failure.
Subgroup analysis in patients with various cardiovascular risk factors
For subgroup analysis, the total population was divided according to the presence of cardiovascular risk factors (i.e. sex, old age >[60 years old], low body mass index [BMI; ≤25 kg/m2], hypertension, diabetes mellitus, chronic renal failure, depressed LV systolic function (LV ejection fraction <50%), or presentation as acute coronary syndrome [ACS]). The predictive power of SS and SS II were compared using the ROC curve. As shown in Table 5, SS II had an improved predictive value than SS for 3-year POCE in patients with risk factors, such as male sex, old age, low BMI, hypertension, diabetes mellitus, chronic renal failure, and depressed LV systolic function. The delta AUC value (‘AUC of SS II’ minus ‘AUC of SS’) was relatively large with significant difference of AUC between SS and SS II. In contrast, SS showed better predictive power for patients who presented with stable angina, not ACS. Additionally, we divided the total population into tertiles according to the numbers of predefined risk factors; low-risk group (1–3 risk factors): 406 patients (32.5%), mid-risk group (4 risk factors): 340 patients (30.7%), high-risk group (5-8 risk factors): 363 patients (32.7%). For 3-year POCE, the predictive value for SS was comparable with SS II in the low and mid risk group, while SS II was superior in the high-risk group. For 3-year TLF, the SS and SS II had a comparable predictive value throughout all risk groups (Supplementary Figure 5).
Table 5
Comparison of SS and SS II for 3-year POCE* according to the presence of clinical risk factors
AUC = area under the curve; IDI = integrated discrimination index; NRI = net reclassification index; POCE = patient oriented composite endpoint; SS = SYNergy between percutaneous coronary intervention with TAXus and cardiac surgery score.
*Including all cause death, all cause myocardial infarction and revascularization; †Area under the ROC curve (AUC); ‡Δ: (AUC of SS II) minus (AUC of SS).
DISCUSSION
In this study, SS and SS II were assessed in patients with left main and/or 3-vessel disease who underwent PCI with the contemporary CoCr-EES from 2 large all-comer registries. The main findings were that: 1) SS was an independent predictor of 3-year POCE, 2) SS II held a substantially improved predictive power for 3-year POCE, but not for TLF, and 3) in a subgroup analysis, SS II showed particularly better predictive accuracy compared with SS, for 3-year POCE in patients with clinical cardiovascular risk factors or in patients presenting with stable angina.
The SS was developed based on the population of patients with left main and/or 3-vessel disease who underwent paclitaxel-eluting stent implantation.12) Based on the long-term follow-up results of the validation study,13) the SS is regarded as a useful tool to select the appropriate method of revascularization: PCI versus surgery.14) Furthermore, various studies have shown that the SS can be used as a risk stratification tool for patients with coronary artery disease who received PCI.15)16) However, the critical weak point of SS system is that the SYNTAX trial was performed about a decade earlier. It is a study of the first-generation DES era when the DES performance was not as good as that of contemporary DESs and when intravascular imaging and fractional flow reserve were not frequently adopted. Moreover, adjunctive medical therapy, such as dual antiplatelet agents and statin was not thoroughly used. In this regard, re-validation of SS system is needed before applying SS to the current clinical practice. In addition, various scoring systems were derived from the SS so as to improve the predictability for the original SS.17)18) However, previous scores were derived from old generation stents, which was known to be inferior to current generation DESs. Especially, the SS II was recently proposed to overcome the intrinsic limitations of the SS which solely relied on anatomical factors. By adding clinical factors of a patient, SS II was intended to enhance the predictive value. This scoring system was also developed based on the SYNTAX trial, and validated on the Drug Eluting stent for LefT main coronary Artery disease registry of the first-generation DES era.19) Thus, SS II also needs re-validation in contemporary patient population.
A few studies have assessed the predictive values of SS15)18) and SS II for long-term clinical outcomes in a PCI population.20)21)22) However, these studies included patients who received 1st generation DESs, and were not limited to patients with left main and/or 3-vessel disease in whom the use of SS was intended in the original SYNTAX study3) and indicated by current guidelines.1)2) In addition, regarding the comparison of SS and SSII, Song et al. recently compared the predictive value of SS and SS II for 2-year mortality in patients with left main and/or 3-vessel disease undergoing PCI.23) In this single-center study, about 10% of study population did not receive 2nd generation DESs, and SS and SS II were quite low (SS: 16.0±8.2 compared with 21.1±9.6 in our study, SS II: 23.6±6.5 compared with 35.5±11.3 in our study). Furthermore, the mortality rate in this study was very low (1.3%, compared with 8.5% in our study), suggesting that this study included a very low-risk population that might not represent well the population that needs the calculation of SS or SS II. Collectively, previous studies did not thoroughly validate SS and SS II in a contemporary 2nd generation DES era. Therefore, the main purpose of our study was to validate the SS and SS II in a pure contemporary CoCr-EES population with left main and/or 3-vessel disease in a 3-year follow-up duration, which is the main difference between previous evidences and the current study. Through our analysis of more than 1,200 patients, we demonstrated the predictive value of both SS and SS II in the contemporary DES era. Interestingly, the predictive value of SS II was superior compared to SS for patient oriented clinical outcomes, while both values were comparable for lesion specific outcomes. This finding is reasonable because firstly, SS II was initially developed to predict all-cause mortality which was the ultimate patient-orient outcome, and secondly, SS II includes clinical variables in contrast to SS which only take anatomical variables of lesions into account. In fact, we found the superior predictive value of SS II especially for all-cause mortality.
Despite the improvement in the predictive performance of SS II, it may not have well penetrated into the daily practice. This situation is attributed to the 7 additional factors included in SS II that requires utilization of a complex nomogram or web-based calculator. Thus, to reveal the situations when SS II is superior to the SS is practically useful. Our study showed that SS II was superior in predicting patient-related outcomes, but had no additive value in predicting lesion-related outcomes. This means that an anatomical scoring system, such as SS may be sufficient to predict outcomes of the lesion. However, to predict outcomes of a patient, incorporating clinical variables are superior.
In addition, SS II was particularly useful to predict the clinical outcomes in patients with cardiovascular risk factors, such as male sex, old age, low BMI, hypertension, diabetes mellitus, chronic renal failure, and depressed LV systolic function. We think that this was a reasonable result, because combining more risk factors usually improves predictive values. Interestingly, regarding the clinical presentation, the additive value of SS II was limited in ACS patients; SS II was superior to SS only in patients presenting as stable angina. This may be explained by the importance of the coronary anatomy in ACS patients. ACS patients are more likely to have more significant stenosis which threatens the myocardial viability by decreased coronary flow. In these patients, relieving angiographic stenosis through PCI may have a larger effect on clinical outcomes. On the contrary, for patients with stable angina, medical treatment for clinical factors may have a larger portion to determine the clinical outcomes. Considering that the SYNTAX score II incorporates clinical risk factors to the anatomical risk factors, this may explain the observed better predictive value of SS II in patients with stable angina.
Our registries only included the patients undergoing PCI; hence, we could not provide the comparison between contemporary DES and CABG according to SS and SS II. In addition, our study patients were implanted with only CoCr-EES among the various contemporary DESs. However, CoCr-EES is regarded as the most advanced contemporary DESs. Thus, we believe that our study well represents the current status of the DES use. Also, according to current guidelines, CABG is preferred to those with a high SS. It should be noticed that the reason these patients were unsuitable for CABG might act as a factor of worst outcome. This can be addressed as a selection bias, that should be considered in interpretation of our results.
In conclusions, the usefulness of SS and SS II could be extended to patients with left main and/or 3-vessel disease who received PCI with CoCr-EES. SS II was superior to SS in predicting patient-oriented outcomes, particularly in patients with clinical cardiovascular risk factors or patients without ACS.
 XML Download