Abstract
Background and Objectives
This study was designed to analyze the relationship between measurement of airway length with cephalometry and AHI in children with OSA and to assess the correlations between cephalometric parameters and salivary cortisol level.
Subjects and Method
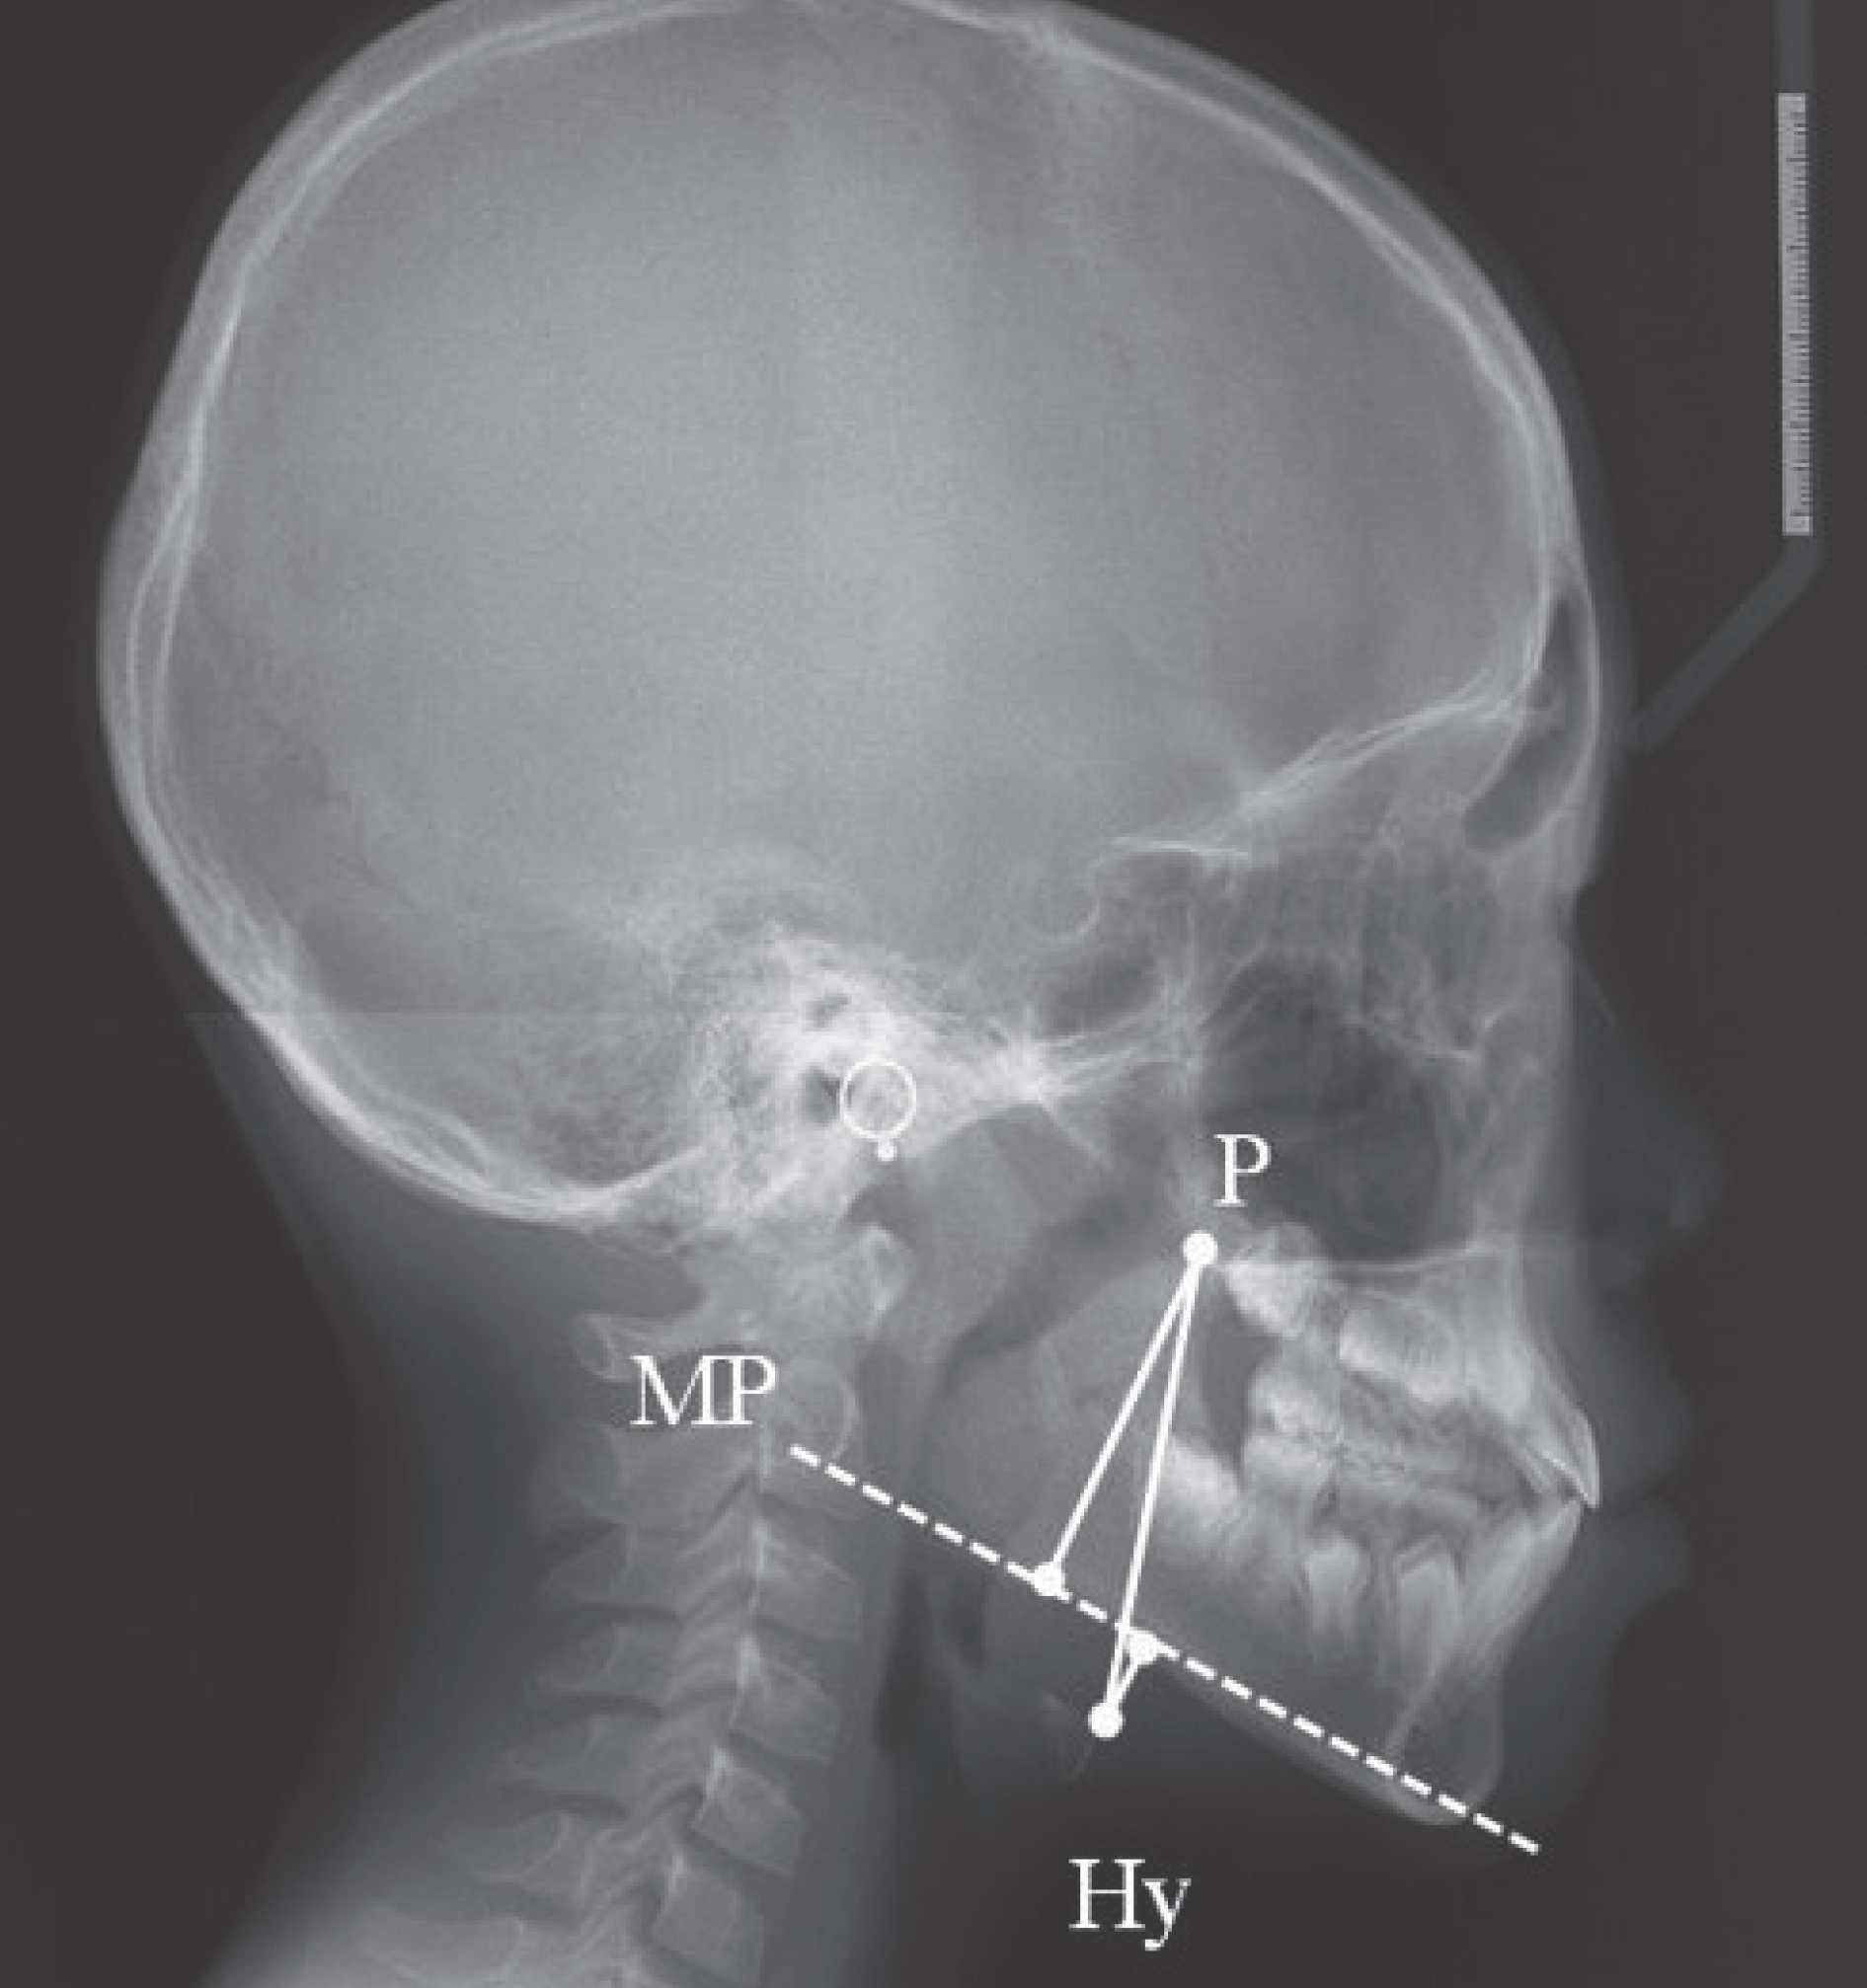
Three parameters of the upper airway were measured by cephalometry: distance from the posterior nasal spine to the hyoid bone (PHy), distance from the mandibular plane to the hyoid bone (MP-Hy), and distance from the pos-terior nasal spine to the mandibular plane (P-MP). Ratios for each segment were also determined.
Go to : 
References
1. Marcus CL, Brooks LJ, Draper KA, Gozal D, Halbower AC, Jones J, et al. Diagnosis and management of childhood obstructive sleep apnea syndrome. Pediatrics. 2012; 130:e714–55.

2. Lumeng JC, Chervin RD. Epidemiology of pediatric obstructive sleep apnea. Proceedings of the American Thoracic Society. 2008; 5:242–52.

3. Tan HL, Gozal D, Kheirandish-Gozal L. Obstructive sleep apnea in children: a critical update. Nature and science of sleep. 2013; 5:109–23.
4. De Luca Canto G, Singh V, Major MP, Witmans M, El-Hakim H, Major PW, et al. Diagnostic capability of questionnaires and clinical examinations to assess sleep-disordered breathing in children: a systematic review and metaanalysis. Journal of the American Dental Association (1939). 2014; 145:165–78.
6. Fujioka M, Young LW, Girdany BR. Radiographic evaluation of ad-enoidal size in children: adenoidal-nasopharyngeal ratio. AJR Am J Roentgenol. 1979; 133:401–4.

7. Jeong JH, Guilleminault C, Park CS, Son HL, Lee HK, Hwang SH, et al. Changes in salivary cortisol levels in pediatric patients with obstructive sleep apnea syndrome after adenotonsillectomy. Sleep Medicine. 2014; 15:672–6.

8. Park CS, Guilleminault C, Park HJ, Cho JH, Lee HK, Son HL, et al. Correlation of salivary alpha amylase level and adenotonsillar hypertrophy with sleep disordered breathing in pediatric subjects. Journal of clinical sleep medicine: JCSM: official publication of the American Academy of Sleep Medicine. 2014; 10:559–66.

9. Mitchell RB, Pereira KD, Friedman NR. Sleep-disordered breathing in children: survey of current practice. The Laryngoscope. 2006; 116:956–8.

10. Park JY, Choi SY, Lee JW, Ye MK, Shin SH. The Effect of Tonsil Size on the Obstructive Sleep Apnea in Adults. J Rhinol. 2011; 18(2):102–6.
11. Nolan J, Brietzke SE. Systematic review of pediatric tonsil size and polysomnogram-measured obstructive sleep apnea severity. Otolar-yngology–head and neck surgery: official journal of American Academy of Otolaryngology-Head and Neck Surgery. 2011; 144:844–50.

12. Abrishami A, Khajehdehi A, Chung F. A systematic review of screening questionnaires for obstructive sleep apnea. Canadian journal of anaesthesia=Journal Canadien D'anesthesie. 2010; 57:423–38.

13. Susarla SM, Thomas RJ, Abramson ZR, Kaban LB. Biomechanics of the upper airway: Changing concepts in the pathogenesis of obstructive sleep apnea. Int J Oral Maxillofac Surg. 2010; 39:1149–59.

14. Segal Y, Malhotra A, Pillar G. Upper airway length may be associated with the severity of obstructive sleep apnea syndrome. Sleep & breathing=Schlaf & Atmung. 2008; 12:311–6.

15. Susarla SM, Abramson ZR, Dodson TB, Kaban LB. Cephalometric measurement of upper airway length correlates with the presence and severity of obstructive sleep apnea. Journal of oral and maxillofacial surgery: official journal of the American Association of Oral and Maxillofacial Surgeons. 2010; 68:2846–55.

16. Arens R, McDonough JM, Corbin AM, Rubin NK, Carroll ME, Pack AI, et al. Upper airway size analysis by magnetic resonance imaging of children with obstructive sleep apnea syndrome. American Journal of Respiratory and Critical Care Medicine. 2003; 167:65–70.

17. Vieira BB, Itikawa CE, de Almeida LA, Sander HH, Aragon DC, Anselmo-Lima WT, et al. Facial features and hyoid bone position in preschool children with obstructive sleep apnea syndrome. European archives of oto-rhino-laryngology: official journal of the European Federation of Oto-Rhino-Laryngological Societies (EUFOS): affiliated with the German Society for Oto-Rhino-Laryngology-Head and Neck Surgery. 2014; 271:1305–9.

18. Ping-Ying Chiang R, Lin CM, Powell N, Chiang YC, Tsai YJ. Sys-tematic analysis of cephalometry in obstructive sleep apnea in Asian children. Laryngoscope. 2012; 122:1867–72.

19. Lee KY, Lee CM, Choi YJ, Lee YJ, Jung SS, Kim JS. Comparison of Electron Beam Tomography and Multi Detector Computed To-mography for Dynamic Upper Airway Study in Snorers. J Rhinol. 2004; 11(1,2):57–61.
Go to : 
 | Fig. 1.Cephalometric landmarks and parameters. P: posterior nasal spine, MP: mandibular plane, Hy: the most anterior and su-perior point of hyoid bone. |
Table 1.
Definition of the cephalometric parameters
Table 2.
The demographic data and PSG finding of studied patients
| Control AHI≤1 (n=18) | OSAS AHI>1 (n=21) | p value | |
|---|---|---|---|
| Gender | |||
| Male | 9 (50.0) | 17 (80.9) | 0.04 |
| Female | 9 (50.0) | 4 (19.1) | |
| Age | 7.2±1.9 | 5.9±2.2 | 0.06 |
| BMI | 16.9±2.3 | 16.6±2.3 | 0.58 |
| AHI | 0.2±0.3 | 11.1±9.8 | <0.0001 |
Table 3.
Comparison of physical and cephalometric parameters in patients with OSAS and control group
Table 4.
The relationship between AHI and physical and cepha-lometric parameters in OSAS group
| AHI | ||
|---|---|---|
| r | p value | |
| Tonsil | 0.0788 | 0.7342 |
| AN-r | 0.3437 | 0.1272 |
| P-Hy | 0.0249 | 0.9147 |
| MP-Hy | 0.3987 | 0.0734 |
| P-MP | 0.0085 | 0.9709 |
| Ratio 1 | 0.4455 | 0.0430 |
| Ratio 2 | 0.0104 | 0.9642 |
| Ratio 3 | 0.3896 | 0.0808 |
Table 5.
Comparison of the physical and cephalometric parameters according to the OSA severity
Table 6.
The evaluation of the effective screening measurements to identify the moderate-severe OSAS group in all patients
Table 7.
The univariable logistic regression analysis of each variable


 PDF
PDF ePub
ePub Citation
 Print
Print


 XML Download