

 PDF
PDF ePub
ePub Citation
 Print
Print


INTRODUCTION
Metabolic syndrome (MetS) is one of the most relevant issues in public health as it is associated with a three-times increased risk of cardiovascular disease [1] and five-times increased risk of type 2 diabetes mellitus (DM) [2]. Globally, the prevalence of MetS has been increasing. In the United States, the overall prevalence of MetS increased from 27.9% to 34.1%, according to data from the National Health and Nutrition Examination Survey (NHANES) III in 1988 to 1994 and NHANES 1999 to 2006 [3]. More recently, MetS prevalence reached a peak of 36.1% in 2007 to 2008, and plateaued at 34.7% during 2011 to 2012, according to data from the NHANES 2003 to 2012 [4]. These increasing trends are also evident in countries in the Asia-Pacific region [5]. Consistent with data from other countries, the Korean National Health and Nutrition Examination Survey (KHANES) in 1998 to 2007 also demonstrated increasing trends of the age-adjusted prevalence of MetS, from 24.9% to 31.3% [6]. Given its growing impact on public health, understanding the underlying mechanisms or drivers of MetS is becoming increasingly important.
In western populations, accumulating evidence shows that low testosterone levels are associated with insulin resistance [7], type 2 DM [8], hypertension [9], and increased risk of cardiovascular disease [10]. Moreover, close relationships between low testosterone levels and MetS have been observed in western cross-sectional studies [1112], and a longitudinal cohort study demonstrated that low testosterone levels are responsible for higher risks of MetS [1314].
Data showing an association between serum testosterone level and MetS or its components among Asian men are limited. Recently, a meta-analysis investigating the correlation between serum testosterone level and MetS, including 20 observational studies among 9,525 men, showed that serum testosterone level has an inverse association with MetS risk; however, the associations of testosterone levels with MetS vary according to body mass index (BMI) and individual MetS components [15]. Moreover, among the 20 eligible studies, only 2 were performed in Asian countries (Japan and China), and had small-sized populations (194 and 307 participants, respectively) [1617]. Hence, further evidence on the relationship between testosterone levels and MetS or its components in Asian populations is needed. To elucidate these associations, we conducted a large-scale cross-sectional study among healthy Korean men who participated in a routine health check-up program.
Go to : 
MATERIALS AND METHODS
1. Ethical statements
The present study protocol was reviewed and approved by the Institutional Review Board of Asan Medical Center, Seoul, Korea (no. 2018-0157), which waived the requirement for informed consent because of the minimal risk of harm. All participants were anonymized before the analysis.
2. Study population
We obtained data from 17,153 healthy adult (age≥20 years) men who attended the Health Screening and Promotion Center of Asan Medical Center for a routine health check-up between January 2006 and December 2015. Among them, 10,143 (59.1%) were excluded because their serum testosterone levels were not quantified, and 43 (0.3%) were excluded because they had a past history of testosterone replacement therapy. Therefore, 6,967 men (40.6%) were enrolled in the final analysis.
3. Measurements of metabolic risk factors and testosterone
The health screening program provided by Asan Medical Center has been described elsewhere [18]. Briefly, our health screening program routinely includes blood sampling and measurement of height, weight, waist circumference (WC), and blood pressure (BP). In this study, all participants were also requested to complete a questionnaire designed to assess comorbidities and current (or past) medications. Height, weight, and WC were measured using standard techniques, and BMI was calculated using the following equation: BMI (kg/m2)=weight (kg)/square of height (m2). BP was measured at least twice utilizing an automated electronic manometer (ACCUNIQ BP210; Selvas Healthcare, Daejeon, Korea). Blood samples were obtained using cubital vein puncture in fasting state between 07:00 and 10:00 AM. Fasting plasma glucose (FPG), serum cholesterol, triglyceride (TG), and high-density lipoprotein (HDL) levels were measured using enzymatic methods via a chemistry autoanalyzer (TBA-200FR; Toshiba, Tokyo, Japan). Serum low-density lipoprotein (LDL) level was calculated using the following equation: LDL (mg/dL)=cholesterol (mg/dL)-(TG [mg/dL]/5)-HDL (mg/dL). The testosterone level was quantified on the date of sampling using a commercially available radioimmunoassay kit (TESTO-CT2; Cisbio Bioassays, Codolet, France).
4. Definition of metabolic syndrome
MetS was defined according to the 2005 revised National Cholesterol Education Program Adult Treatment Panel III (NCEP-ATP III) criteria, proposed by the American Heart Association and the National Heart, Lung, and Blood Institute [1920]. The diagnosis of MetS requires the presence of at least three of the following components: 1) hyperglycemia (FPG≥100 mg/dL or history of type 2 DM); 2) increased body size (WC≥90 cm for Asian men); 3) increased TG levels (TG≥150 mg/dL); 4) decreased HDL cholesterol levels (HDL<40 mg/dL); and 5) elevated BP (systolic BP [sBP]≥130 mmHg, diastolic BP [dBP]≥85 mmHg, or history of hypertension) [1920].
5. Statistical analysis
We estimated the age-adjusted prevalence of MetS in the total population and among middle-aged Korean men (≥40 years) using data of the Korean Population Census 2010, provided by the Korea National Statistical Office [21]. Clinical parameters were compared between men with and without MetS. Correlations between serum testosterone level and each component of MetS were analyzed using a Pearson's correlation test. Associations between serum testosterone level and the number of MetS components were also evaluated in the same manner. Unconditional logistic regression was performed to estimate the odds ratios (ORs) and 95% confidence intervals (CIs) for MetS, according to quartiles of serum testosterone levels. ORs with 95% CIs for each component of MetS were also estimated in a similar manner. Continuous parameters were compared using the Mann–Whitney U-test. All tests were two-tailed with a significance level of 0.05. All statistical analyses were performed using IBM SPSS® ver. 21.0 (IBM Corp., Armonk, NY, USA).
Go to :
RESULTS
1. Patient characteristics
Table 1 shows the baseline characteristics of participants. The median serum testosterone level (interquartile range) of the entire cohort was 4.2 ng/mL (3.2–5.4 ng/mL). The prevalence of MetS in the entire cohort was 30.1% (2,098 of 6,967 participants). The criterion for hyperglycemia was met in 54.5% participants and this was the most common of the five MetS components, followed by elevated BP (44.0%), increased TG levels (34.9%), increased body size (34.0%), and decreased HDL cholesterol levels (15.5%; Table 1).
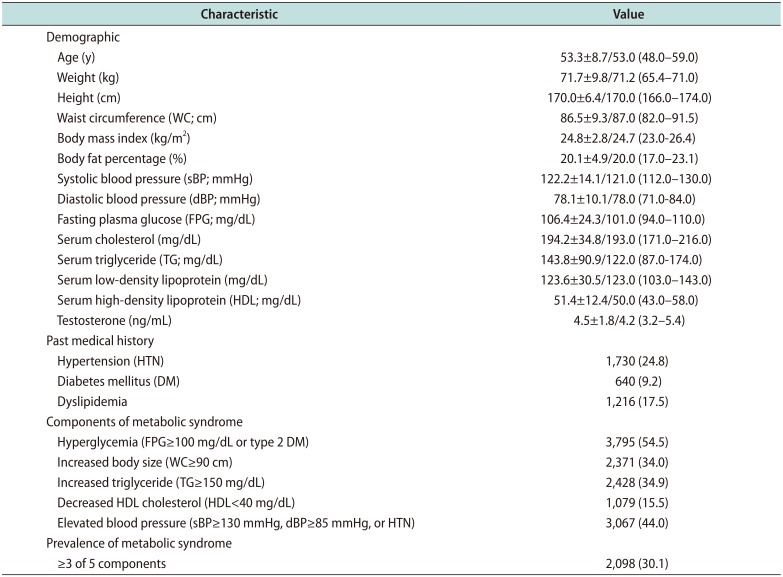
Table 1
Clinical characteristics of participants included in this study (n=6,967)
![]()
The prevalence of MetS according to age group is shown in Table 2. Overall, 95.2% of men (6,631 of 6,967 participants) were middle-aged. The prevalence of MetS in young men (20–39 years) was 23.2% (78 of 336 participants), lower than that in middle-aged men (30.5%; 2,020 of 6,631 participants). The age-adjusted prevalence of MetS in adult (≥20 years) and middle-aged Korean men was estimated as 27.5% and 30.6%, respectively (Table 2).
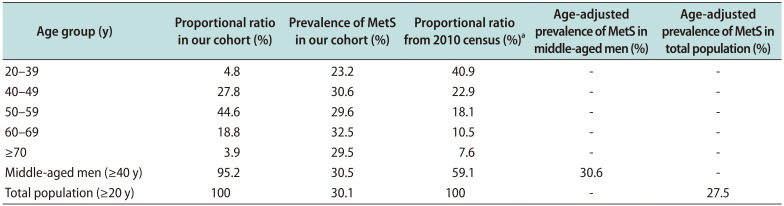
Table 2
Prevalence of metabolic syndrome (MetS) according to age group
aData from the Korean Population Census 2010 [21].
![]()
2. Association between serum testosterone level and metabolic syndrome
Clinical characteristics were compared between men with and without MetS (Table 3). The BMI (26.5 kg/m2
vs. 24.0 kg/m2), WC (92.0 cm vs. 85.0 cm), sBP (127.0 mmHg vs. 119.0 mmHg), dBP (82.0 mmHg vs. 76.0 mmHg), serum FPG level (109.0 mg/dL vs. 97.0 mg/dL), and TG level (182.0 mg/dL vs. 105.0 mg/dL) were significantly higher in men with MetS than in those without MetS, but serum HDL cholesterol levels were significantly lower (44.0 mg/dL vs. 52.0 mg/dL; Table 3). Additionally, men with MetS had significantly lower levels of serum testosterone (4.0 ng/mL vs. 4.3 ng/mL; Table 3).
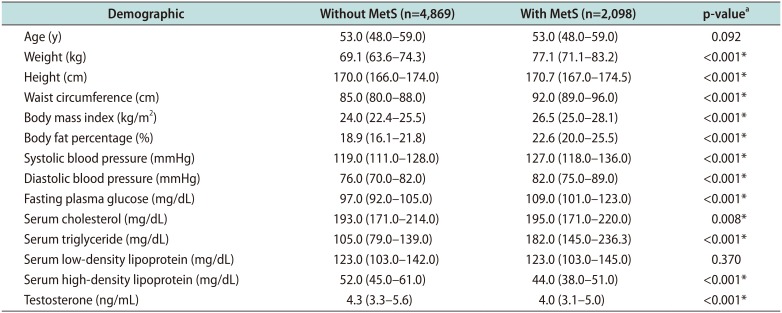
Table 3
Comparison of clinical characteristic between participants with or without metabolic syndrome (MetS)
![]()
In the quartile analysis (Table 4), high serum testosterone level was significantly associated with a low risk of MetS (highest vs. lowest quartile, OR=0.528; ptrend<0.001). Our data demonstrated an approximately 13% reduction in risk of MetS per 1 ng/mL increment in serum testosterone levels (Table 4). The association between serum testosterone level and MetS was attenuated after adjustment for age and BMI but remained significant (approximately 7% reduction in MetS risk per 1 ng/mL; Table 4).
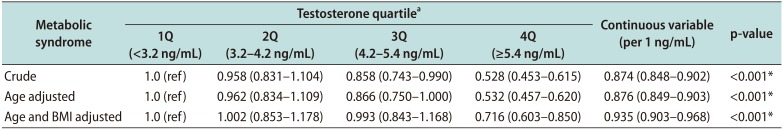
Table 4
Odds ratios for metabolic syndrome, according to quartiles of serum testosterone level
![]()
3. Association between serum testosterone level and components of metabolic syndrome
Serum testosterone level was inversely correlated with all MetS components, including hyperglycemia (r=−0.041, p=0.001), increased body size (r=−0.093, p<0.001), increased TG levels (r=−0.090, p<0.001), decreased HDL cholesterol levels (r=−0.030, p=0.013), and elevated BP (r=−0.071, p<0.001; Table 5). All MetS components were also significantly associated with each other, but there was no association between hyperglycemia and decreased HDL cholesterol levels (p=0.158; Table 5).
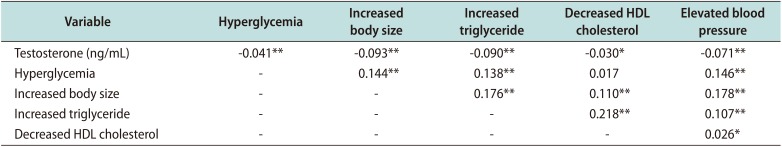
Table 5
Correlations of serum testosterone level with components of metabolic syndromea
![]()
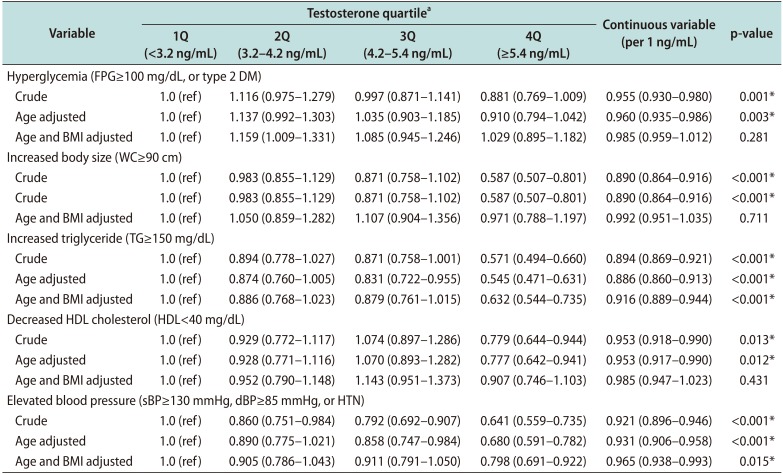
The quartile analyses (Table 6) showed that high serum testosterone level was significantly associated with a low risk of hyperglycemia (OR=0.881; ptrend=0.001), increased body size (OR=0.587; ptrend<0.001), increased TG levels (OR=0.571; ptrend<0.001), decreased HDL cholesterol levels (OR=0.779; ptrend=0.013), and elevated BP (OR=0.641; ptrend<0.001). We observed a 4%, 11%, 11%, 5%, and 8% reduction in the risk of hyperglycemia, increased body size, increased TG levels, decreased HDL cholesterol levels, and elevated BP per 1 ng/mL increment of serum testosterone levels, respectively (Table 6). Therefore, as shown in Fig. 1, serum testosterone levels showed an inverse association with the total number of MetS components (r=−0.121, p<0.001). Interestingly, hyperglycemia (ptrend=0.281), increased body size (ptrend=0.711), and decreased HDL cholesterol levels (ptrend=0.431) showed no significant association with serum testosterone levels, after adjustment for age and BMI (Table 6). However, increased TG (OR=0.632; ptrend<0.001) and elevated BP (OR=0.798; ptrend=0.015) were independently associated with low serum testosterone level, even after adjustment for age and BMI (Table 6).
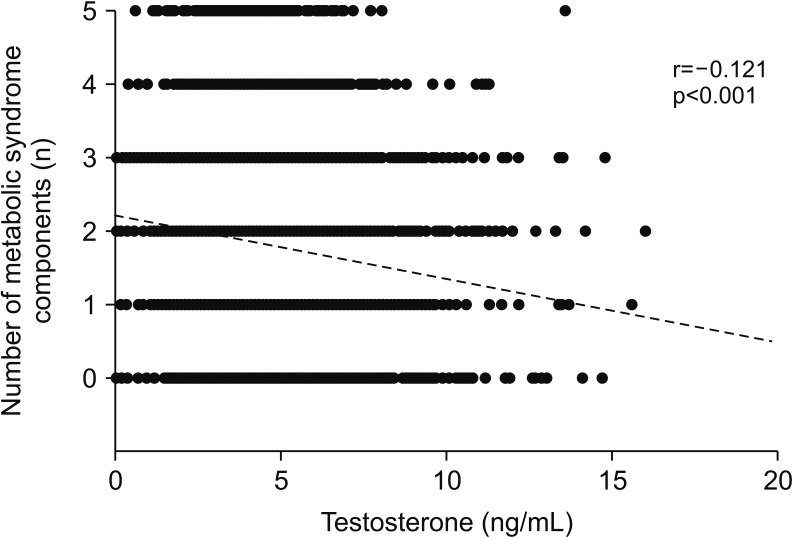 | Fig. 1Scatterplot and regression line (dotted line) showing the correlation between serum testosterone level and number of metabolic syndrome components.
|
Table 6
Odds ratios for each component of metabolic syndrome, according to quartiles of serum testosterone level
![]()
Go to :
DISCUSSION
As mentioned, the prevalence of MetS in Asian countries is increasing similar to that in western countries [56]. According to KHANES 1998 to 2007 data (n=6,907; men, 45.5%), the age-adjusted prevalence of MetS among adult Korean men, according to NCEP-ATP III criteria, gradually increased from 26.9% in 2001 to 29.0% in 2007 [6]. In our cohort comprising 6,967 healthy adult Korean men recruited during 2006 to 2015, using the same diagnostic criteria, the estimated age-adjusted prevalence of MetS was 27.5% (Table 2). Our results are generally consistent with previous KHANES 1998 to 2007 data [6].
However, considering that our participants were recruited later than participants in KHANES 1998 to 2007, our estimated prevalence is somewhat lower than that in that study [6]. The bias in the characteristics of our participants, most of whom (95.2%; Table 2) were middle-aged, is thought to contribute these findings. In our study, the age-adjusted prevalence of MetS among middle-aged men was 30.6% (Table 2). This rate was significantly higher than that noted in another study (n=5,330; men, 41.2%) reporting an MetS prevalence of 26.3% according to NCEP-ATP III criteria in middle-aged men during 2003 to 2004 [22]. These results suggest that the prevalence of MetS has continued to increase in Asian countries, particularly in Korea, almost reaching western levels [34]. Given the increasing prevalence and growing disease burden of MetS in Asian countries, understanding the underlying mechanisms is increasingly important, including among Asians.
Previous studies in western countries have reported an inverse correlation between serum testosterone levels and MetS risk [11121314], but there is little such evidence in Asian populations. Akishita et al [16] performed a cross-sectional study among 194 middle-aged Japanese men and concluded that low testosterone level is associated with MetS (hazard ratio by quartile decline of testosterone=2.02). Similarly, a Chinese cross-sectional study including 304 middle-aged men found that low testosterone level was associated with MetS (OR by tertile decline of testosterone level=2.40) only in men with a familial history of DM [17]. These somewhat contradictory findings can be attributed to the small-sized population in these studies [1617].
Recently, a Japanese cross-sectional study with a large population (n=1,150) reported that higher levels of serum testosterone were independently associated with a lower risk of MetS (OR per standard deviation decrement of testosterone level=2.30) [23]. These recent results are consistent with previous results from western studies [11121314], but more evidence is needed regarding the association between testosterone level and risk of MetS in Asians. To our knowledge, our study is the largest (n=6,967) to investigate the relationship between testosterone levels and MetS in an Asian population. Our results clearly showed that serum testosterone level has an inverse association with the risk of MetS (OR=0.528; ptrend <0.001; Table 4). Our results are in accordance with those of the above Japanese study [23], and confirm that low serum testosterone level is also a relevant risk factor for MetS in Asian populations.
It is important to identify the components of MetS associated with serum testosterone levels, as this association can provide important clues in understanding the underlying mechanisms or drivers of MetS. Previous studies have reported relatively consistent associations between testosterone level and MetS risk; however, there is much disagreement as to which components are related to testosterone levels [15]. Our results clearly showed that serum testosterone level is significantly associated with all MetS components, including hyperglycemia (r=−0.041), increased body size (r=−0.093), increased TG levels (r=−0.090), decreased HDL cholesterol levels (r=−0.030), and elevated BP (r=−0.071; Table 5). Our quartile analyses demonstrated similar results (Table 6); therefore, serum testosterone level showed an inverse association with the total number of MetS components (r=−0.121, p<0.001; Fig. 1).
Our results are in accordance with a previous Japanese study by Akishita et al [16] that demonstrated a correlation between testosterone levels and the number of MetS components. However, our result that testosterone level is related to all MetS components is somewhat different from the findings of Tsujimura et al [23], who showed that testosterone level is not related to hyperglycemia (age-adjusted OR=1.7, p=0.146). This difference may be because the previous study was underpowered, with a relatively small number of participants (n=1,150) [23]. Moreover, in a previous study, only 41.2% (474 of 1,150 participants) had measured plasma glucose levels; among them, only 2.1% (10 of the 474 participants) met the hyperglycemia criterion (FPG≥100 mg/dL) [23]. This unusual distribution might have biased the results of the relationship between testosterone level and hypoglycemia. In contrast, in our study, all 6,967 participants had measured FPG and 54.5% of men had FPG ≥100 mg/dL or a history type 2 DM, with the highest prevalence among MetS components (Table 1). This rate was somewhat higher, but generally similar, when compared with the study by Akishita et al [16] reporting the prevalence of hyperglycemia (FPG≥100 mg/dL) as 38.0%. This difference is thought to have contributed to the differing results.
The main mechanism underlying the association between testosterone level and MetS has been suggested to be the causal relationship between low testosterone level and obesity. Exogenous testosterone replacement in obese middle-aged men substantially diminishes visceral obesity, and the activation of lipoprotein lipase and lipolysis represents the key role of testosterone in adipose tissue [24]. Previous epidemiologic studies have shown a significant correlation between testosterone level and MetS, but corrections for obesity parameters weaken the correlation [111213141623]. Moreover, the significant associations of testosterone level with HDL cholesterol, free fatty acids, hemoglobin A1c, insulin, and adiponectin levels were attenuated after adjustment for age and WC in the study by Akishita et al [16]. These findings strongly indicate that obesity is an important contributor to the association between low testosterone level and MetS. Our results also showed that the relationship between testosterone level and MetS (13% reduction in MetS risk per 1 ng/mL) is weakened with adjustment for age and BMI (approximately 7% reduction in of MetS risk per 1 ng/mL; Table 4), similar to a previous study [16].
Another interesting finding is that testosterone level still independently affects MetS risk, although it is attenuated, after adjusting for BMI (Table 4). This suggests that although testosterone is involved in the pathogenesis of MetS through pathways associated with obesity, other pathways affect MetS as well. Among the MetS components, our findings that increased TG (OR=0.632; ptrend<0.001) and elevated BP (OR=0.798; ptrend=0.015) were independently associated with testosterone level, after adjustment for age and BMI (Table 6), support this hypothesis. Our results confirmed the findings of previous studies showing that testosterone level is still associated with sBP (r=−0.169) and TG levels (r=−0.182) after adjusting for age and WC [16].
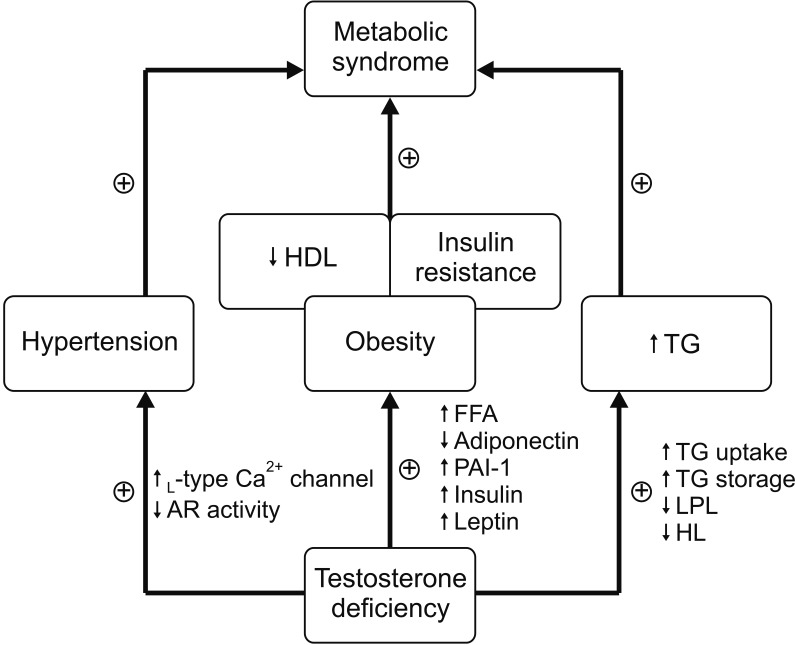
Regarding hypertension, a previous study reported that men with low testosterone concentrations had an increased risk of incident hypertension (OR by quartile decline of testosterone=1.19) [25]. Moreover, direct vasodilating effects of testosterone on vascular smooth muscle [26], mediated by inhibition of L-type calcium channels [27] or androgen receptors in vascular smooth muscle cells [26] have been suggested as potential mechanisms for this relationship. Similarly, it has been proven that testosterone deficiency independently promotes the absorption and storage of TG in a rat model [28]. Additionally, testosterone deficiency lowers the activity of lipoprotein lipase and hepatic lipase [29], consequently inhibiting TG degradation in the bloodstream [28]. In a large cohort from the fourth Tromsø study (n=1,274), a negative association between testosterone level and non-fasting TG (r=−0.193, p<0.001) was proven [30]. Taken together, these results suggest that testosterone level independently affects MetS components, such as increased TG levels or elevated BP, in addition to component clusters associated with obesity, such as increased body size, hyperglycemia, and decreased HDL cholesterol levels (Fig. 2).
The current study had some limitations. First, most participants (95.2%) were middle-aged men because of the nature of the health examination data. Thus, our findings represent the characteristics of middle-aged men rather than the entire population of Korea. To overcome this bias, we used contemporary Korean census data [21] and provided age-adjusted values for all results. Second, as sex hormone-binding globulin, which determines the bioavailability of testosterone, was not routinely measured during health screening, the correlation between testosterone bioavailability and MetS could not be analyzed. Lastly, because of the cross-sectional nature of this study, although a relationship between testosterone level and MetS was confirmed, the temporal causal relationship between these two factors could not be determined. Research to overcome these limitations is needed in the future.
Go to :
CONCLUSIONS
Serum testosterone level was inversely associated with MetS in Korean men. This association was attenuated after adjustment for age and BMI, but remained significant. Among MetS components, increased TG and elevated BP were independently associated with testosterone level regardless of obesity. This suggests that although testosterone is involved mainly in the pathogenesis of MetS through pathways associated with obesity, other pathways affect MetS as well.
Go to :
 XML Download