

 PDF
PDF ePub
ePub Citation
 Print
Print


INTRODUCTION
The penis has a specialized vascular bed and penile erection requires well-coordinated interactions between vascular endothelial cells (ECs), smooth muscle cells, pericytes, and neuronal cells [123]. The vascular endothelium plays a critical role in the regulation of blood flow and vascular tone [4]. Pericytes surrounding the ECs of microvessels are known to plays a critical role in maintaining vascular homeostasis [5]. We recently documented the differential distribution of EC and pericytes in the erectile tissue of mice and human by using immunohistochemistry [23].
Over the past decades, in vitro cell-based models were widely used in the field of vascular biology [678] and have given us invaluable insight for understanding physiologic angiogenesis as well as pathophygiology of various vascular diseases. Many different methods for the isolation and cultivation of EC and pericytes from the human umbilical vein, placenta, skeletal muscle, and brain have been reported [91011121314]. Although the enzymatic digestion method is one of the most widely used technique, the enzymes can exert harmful effects on cell surface proteins and negatively affect on cellular viability [15]. Recently, we successfully isolated the EC and pericytes from mouse corpus cavernosum tissue [216]. From the clinical perspective of view, however, it is more advantageous to use human cavernous EC and pericytes than use the cells originated from animals.
In the present study, we for the first time established protocol to isolate EC and pericytes from human erectile tissues. Because it is well-known that the passage number of primary cultured cells influences phenotype and morphology of the cells [17], we further determined the changes in phenotypic characteristics and morphological feature of primary cultured cells according to the passages. Finally, we determined the effects of different glucose concentrations on tube formation by cultivating EC or pericytes under normal- or high-glucose condition.
Go to : 
MATERIALS AND METHODS
1. Human corpus cavernosum tissue and ethics statement
Human corpus cavernosum tissues were obtained from three patients with Peyronie's disease who have normal erectile function during reconstructive penile surgery: 1 undergoing penoplasty using saphenous vein graft (age; 55 years), 2 undergoing Nesbit operation (age; 70 and 47 years, respectively). No patient reported diabetes or other cardiovascular diseases. All tissue donors provided informed consent, and the experiments were approved by the Ethics Committee and the internal review board of Inha University (No. 2007-730).
2. Isolation and culture of human cavernous endothelial cell
The human cavernous EC were prepared and maintained as we described previously [16]. Briefly, the corpus cavernosum tissues were cut into two or three pieces and the samples plated on Matrigel-coated (Becton Dickinson, Mountain View, CA, USA) 60-mm cell culture dishes. The Matrigel was polymerized with a 5-minute incubation period at 37℃ and 3 mL of complement medium 199 (GIBCO, Carlsbad, CA, USA) supplemented with 20% fetal bovine serum (FBS), 1% penicillin/streptomycin, 0.5 mg/mL heparin (Sigma-Aldrich, St. Louis, MO, USA), and 5 ng/mL vascular endothelial growth factor (R&D Systems Inc., Minneapolis, MN, USA) was added to the dishes. The dishes were incubated at 37℃ in a 5% CO2 atmosphere. After the cells were confluent and spread over the bottom of the dish (~3 weeks after the start of culture), only sprouting cells were used for subcultivation. The sprouting cells were seeded onto dishes coated with 0.2% gelatin (Sigma-Aldrich).
3. Isolation and culture of human cavernous pericytes
The human cavernous pericytes were prepared and maintained as described previously [218]. The fresh adult corpus cavernosum tissues were collected after surgery and transferred into sterile vials containing Hank's balanced salt solution (GIBCO) and washed twice in phosphate buffer saline. The corpus cavernosum tissues were cut into several 1-mm pieces and the fragmented pieces settled by gravity into collagen I-coated 35-mm cell culture dishes (Becton Dickinson). After 30 minutes of incubation at 37℃ with 300 µL complement Dulbecco's modified Eagle Medium (DMEM; GIBCO) supplemented with 10% FBS, 1% penicillin/streptomycin, and 10 nM human pigment epithelium-derived factor (Sigma-Aldrich), we added an additional 900 µL complement medium and incubated the samples at 37℃ in a 5% CO2 atmosphere. The medium was changed every 2 days. After the cells were confluent and spread over the bottom of the dish (~3 weeks after the start of culture), only sprouting cells were used for subcultivation. The sprouting cells were seeded onto dishes coated with 50 µL/mL collagen I (Advanced BioMatrix, San Diego, CA, USA).
4. Characterization of isolated cells
To determine cell type, cells were stained with antibody to von Willebrand factor (vWF, an EC marker; Santa Cruz Biotechnology, Santa Cruz, CA, USA; 1:50), CD34 (an EC marker; Abcam, Cambridge, MA, USA; 1:50), NG2 chondroitin sulfate proteoglycan (a pericytes marker; Millipore, San Francisco, CA, USA; 1:50), platelet-derived growth factor receptor-β (PDGFR-β, a pericytes marker; Santa Cruz Biotechnology; 1:50), fibroblast-specific protein 1 (FSP1, a fibroblast marker; Santa Cruz Biotechnology; 1:50), or DAPI (a nucleus marker; Vector Laboratories Inc., Burlingame, CA, USA). Signals were visualized and digital images were obtained with a confocal microscope (FV1000; Olympus, Tokyo, Japan).
5. In vitro tube formation assay
To evaluate the angiogenic ability of the human cavernous EC or pericytes in normal- or high-glucose condition, the primary cultured human cavernous EC or pericytes were serum-starved (medium 199 supplemented with 2% FBS and 1% penicillin/streptomycin was used for EC culture, and DMEM supplemented with 2% FBS and 1% penicillin/streptomycin was used for pericyte culture) for 24 hours and were exposed to a normal-glucose (5 mmol/L) or a high-glucose (30 mmol/L) condition for 48 hours as previously described [192021]. The tube formation assay was performed as previously described [16]. About 50 µL of growth factor-reduced Matrigel (Becton Dickinson) was dispensed into 96-well tissue culture plates at 4℃. After gelling at 37℃ for at least 30 minutes, the conditioned human cavernous EC or pericytes were seeded onto the gel at 2×10⁴ cells/well in 200 µL of starvation medium. The assay was performed in a CO2 incubator and the plates were incubated at 37℃ for 24 hours. Images were obtained with a phase-contrast microscope and the numbers of branch points in each well of the plate were counted at a screen magnification of ×40.
6. Western blot
Equal amounts of protein from whole-cell extracts (50 µg/lane) were electrophoresed on 10% sodium dodecylsulfate-polyacrylamide gels, transferred to nitrocellulose membranes, and probed with antibody to CD34 (an EC marker; Abcam; 1:200), PDGFR-β (a pericytes marker; Santa Cruz Biotechnology; 1:200), or β-actin (a loading control; Abcam; 1:2,000). Results were quantified by densitometry.
7. Statistical analysis
Results are expressed as the mean±standard errors. We used the Mann-Whitney U-tests or Kruskal-Wallis tests for group comparison. We performed statistical analysis with SigmaStat 3.5 software (Systat Software Inc., Richmond, CA, USA). The p-values less than 5% were considered significant.
Go to :
RESULTS
1. Localization of endothelial cell and pericytes in the human corpus cavernosum tissue
Immunofluorescent double staining of human cavernous tissue with antibodies against two different EC markers (CD34 and vWF) or pericytes markers (PDGFR-β and NG2) revealed that EC and pericytes are closely distributed in human erectile tissues (Fig. 1).
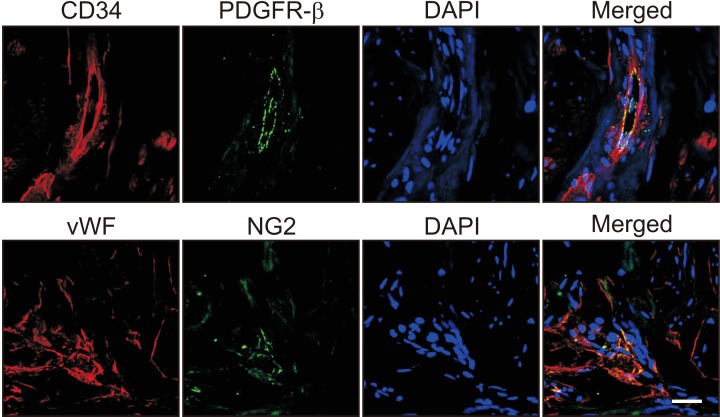 | Fig. 1Localization of endothelial cells and pericytes in human corpus cavernosum tissue. Immunofluorescent staining of human penile tissue (n=3) performed with antibodies against CD34 or von Willebrand factor (vWF, endothelial cell markers, red) and platelet-derived growth factor receptor-β (PDGFR-β) or NG2 (pericyte markers, green). Scale bar=25 µm. DAPI: 4,6-diamidino-2-phenylindole (a nuclei marker, blue).
|
2. Isolation of endothelial cell and pericytes from human corpus cavernosum tissue
Representative images of the cells cultivated for 14 days were shown at Fig. 2A and 2C. After cells were confluent and spread over the whole bottom (21 days), only sprouting cells were used for subcultivation. However, the primary cultured EC at passage 1 did not show a typical cobble stone appearance, but an elongated spindle-shaped appearance (Fig. 2A). It has been known that primary cultured EC shows different morphology based on the cells of origin [22]. The cells revealed a highly positive staining for an EC marker vWF (green), but did not show positive staining for a pericytes marker NG2 (Fig. 2B). Primary cultured pericyte at passage 1 showed typical multi-directional projections and highly positive staining for a pericytes marker NG2 (red), but did not show positive staining for an EC marker vWF (Fig. 2D).
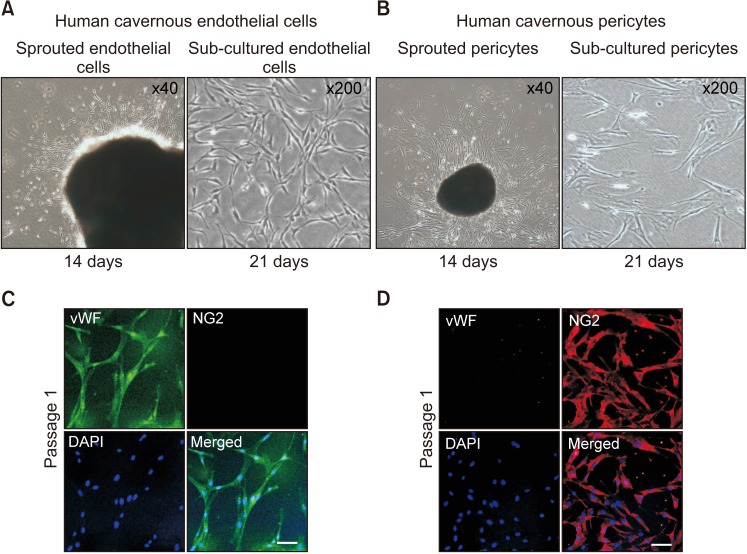 | Fig. 2Isolation and characterization of human cavernous endothelial cells and pericytes. (A) The human corpus cavernosum tissues were implanted on a Matrigel-coated 60-mm cell culture dish with endothelial cell culture medium. A representative image of the cells cultivated for 14 days. After cells were confluent and spread over the whole bottom (21 days), only sprouting cells were used for subcultivation. (B) Fluorescent immunocytochemistry of primary human cavernous endothelial cells (passage 1) with antibodies against von Willebrand factor (vWF, endothelial cell marker) and NG2 (a pericyte marker). Nuclei were labeled with the DNA dye DAPI (4,6-diamidino-2-phenylindole). Scale bar=100 µm. (C) The human corpus cavernosum tissues were implanted on a collagen I-coated 35-mm cell culture dishes with pericyte culture medium. A representative image of the cells cultivated for 14 days. After cells were confluent and spread over the whole bottom (21 days), only sprouting cells were used for subcultivation. (D) Fluorescent immunocytochemistry of primary human cavernous pericytes (passage 1) with antibodies against vWF and NG2. Scale bar=100 µm.
|
3. Morphologic and phenotypic changes of human cavernous endothelial cell according to the passages
The phase image of human cavernous EC from passage 1 to passage 5 revealed that EC morphology started to be changed at passage 3 (Fig. 3A). Fluorescent immunocytochemistry revealed that the cells showed highly positive staining on CD34 and vWF (EC markers), but not on PDGFR-β and NG2 (pericyte markers) up to passage 3. However, more than 60% of human cavernous EC did not express EC markers at passage 5 (Fig. 3B, 3C). Similarly, Western blot analysis revealed a significantly decreased CD34 expression from passage 2 (Fig. 3D, 3E).
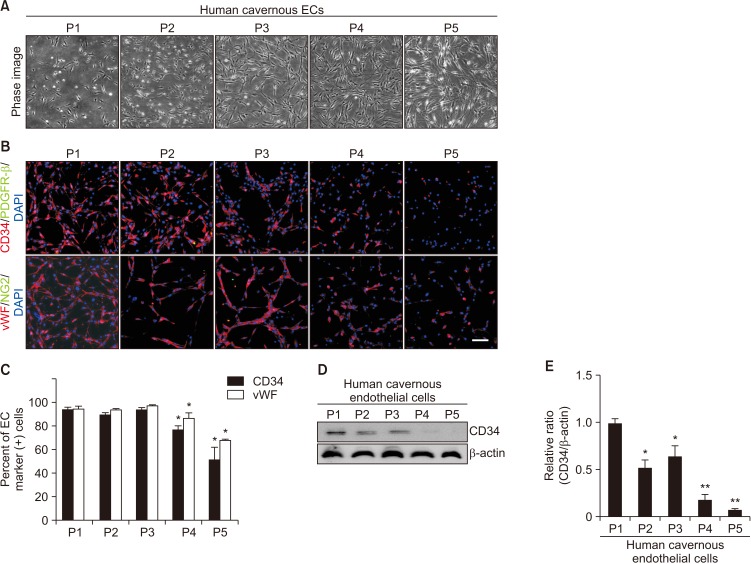 | Fig. 3Morphologic and phenotypic changes of human cavernous endothelial cells (ECs) according to the passages (Ps). (A) Phase image of human cavernous ECs from P1 to P5. (B) Fluorescent immunocytochemistry of human cavernous ECs with antibody against CD34 or von Willebrand factor (vWF, EC markers) and antibody against platelet-derived growth factor receptor-β (PDGFR-β) or NG2 (pericyte markers). Nuclei were labeled with the DNA dye DAPI (4,6-diamidino-2-phenylindole). Scale bar=100 µm. (C) The percentage of CD34- or vWF-positive cells was quantified by Image J. *p<0.05 compared with P1 to P3 groups. (D) Representative Western blot for CD34. (E) Data are presented as the relative density of CD34 to β-actin. The relative ratio measured in the P1 group is arbitrarily presented as 1. *p<0.05 compared with P1 group. **p<0.01 compared with P2 to P3 group. Each bar depicts the mean values (±standard error) from four experiments per group.
|
4. Morphologic and phenotypic changes of human cavernous pericyte according to the passages
Similar to the results from human cavernous EC, the phase image of human cavernous pericyte from passage 1 to passage 5 revealed that pericyte morphology significantly changed from the passage 3 (Fig. 4A). Fluorescent immunocytochemistry revealed that the cells showed highly positive staining on PDGFR-β and NG2 (pericyte markers), but not on CD34 and vWF (EC markers) up to passage 3. However, more than 60% of human cavernous pericytes did not express pericyte markers at passage 5 (Fig. 4B, 4C). Similarly, Western blot analysis revealed a profound decrease in PDGFR-β expression from passage 3 (Fig. 4D, 4E).
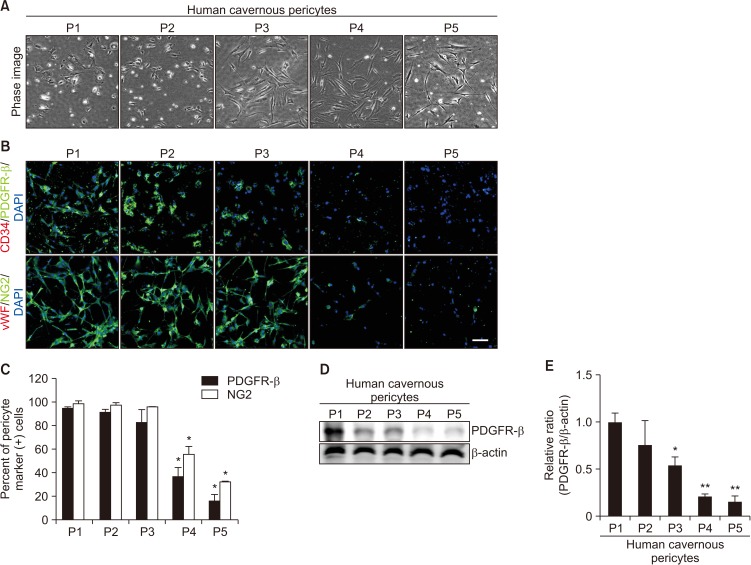 | Fig. 4Morphologic and phenotypic changes of human cavernous pericytes according to the passages (Ps). (A) Phase image of human cavernous pericytes from P1 to P5. (B) Fluorescent immunocytochemistry of human cavernous pericytes with antibody against platelet-derived growth factor receptor-β (PDGFR-β) or NG2 (pericyte markers) and antibody against CD34 or von Willebrand factor (vWF, endothelial cell markers). Nuclei were labeled with the DNA dye DAPI (4,6-diamidino-2-phenylindole). Scale bar=100 µm. (C) The percentage of PDGFR-β or NG2-positive pericytes was quantified by Image J. *p<0.05 compared with P1 to P3 groups. (D) Representative Western blot for PDGFR-β. (E) Data are presented as the relative density of PDGFR-β to β-actin. The relative ratio measured in the P1 group is arbitrarily presented as 1. *p<0.05 compared with P1 to P2 groups. **p<0.01 compared with P3 groups. Each bar depicts the mean values (±standard error) from four experiments per group.
|
5. Differentiation of human cavernous endothelial cell and pericytes into fibroblast-like cells at passage 5
We determined morphologic and phenotypic characteristics of primary cultured cells at passage 5. Both human cavernous EC and pericytes do not express a fibroblast marker FSP1 at passage 1. However, the primary cultured cells showed highly positive staining for FSP1 (in cavernous EC about 94.6%; in cavernous Pericytes about 92.9%) at passage 5 (Fig. 5).
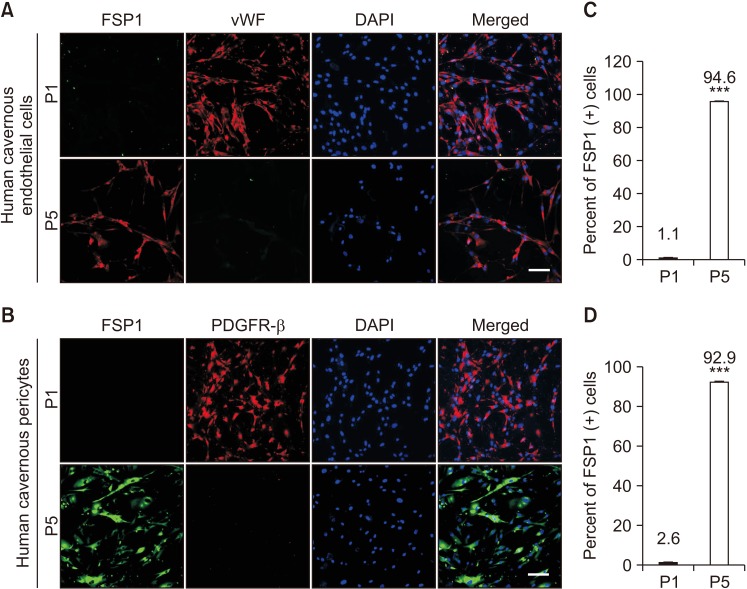 | Fig. 5Differentiation of human cavernous endothelial cells and pericytes into fibroblast-like cells at passage (P) 5. (A, B) Fluorescent immunocytochemistry of human cavernous endothelial cells with antibody against fibroblast-specific protein 1 (FSP1, a fibroblast marker) or von Willebrand factor (vWF, an endothelial cell marker) and antibody against FSP1 or platelet-derived growth factor receptor-β (PDGFR-β). Nuclei were labeled with the DNA dye DAPI (4,6-diamidino-2-phenylindole). Scale bar=100 µm. (C, D) The percentage of FSP1 positive cells in P1 and P5 were quantified by Image J. ***p<0.001 compared with P1 groups. Each bar depicts the mean values (±standard error) from four experiments per group.
|
6. Impaired tube formation in human cavernous endothelial cell or pericytes exposed to the high-glucose condition
To test whether primary cultured human cavernous EC and pericytes are capable of forming tube-like structures and to determine the effect of high-glucose on tube formation, we performed an angiogenesis assay on Matrigel in vitro. After 16 hours of incubation on Matrigel, human cavernous EC or pericytes formed well-organized capillary-like structures in normal-glucose condition, whereas the number of tubes was significantly decreased when the cells were exposed to high-glucose condition (Fig. 6).
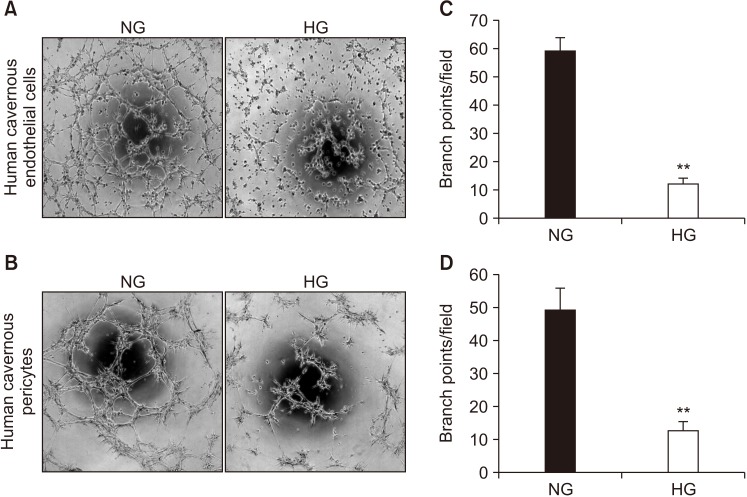 | Fig. 6Decrease in the number of tubes formed in human cavernous endothelial cells or pericytes exposed to the high-glucose (HG) condition. Phase-contrast microscopy of human cavernous endothelial cells (A) and human cavernous pericytes (B). After serum starvation for 24 hours, human cavernous endothelial cells and pericytes were incubated in the normal-glucose (NG, 5 mM) or the HG (30 mM) condition for 48 hours. Then, the tube formation assay on Matrigel was performed in 96-well dishes (×40 magnification). (C, D) Number of branch points per field. Each bar depicts the mean values (±standard error) from four separate wells per group. **p<0.01 compared with the NG group.
|
Go to :
DISCUSSION
The erectile tissue is mainly composed by vascular EC, smooth muscle cells, pericytes and neuronal cells. The functional and structural derangements of these cellular components play an important role in the pathophysiology of erectile dysfunction (ED) [223]. It was reported that the interaction between EC and pericytes plays a crucial role in the blood vessel formation and vascular maturation [24]. We recently confirmed the presence of pericytes in mouse and human corpus cavernosum tissues by using immunohistochemistry, and successfully isolated EC and pericytes from mouse penis [216].
To further investigate the cellular mechanisms responsible for physiologic penile erection and pathophysiology of ED, we tried primary culture of EC and pericytes from human corpus cavernosum tissue by using nonenzymatic culture technique. In the present study, we successfully isolated and cultivated human cavernous EC and pericytes. The morphology and sprouting pattern of the human cavernous EC and pericytes were similar to those cells isolated from mouse corpus cavernosum tissue [216]. However, the growth rates of human cavernous EC and pericytes are somewhat lower than those of mouse cavernous EC and pericytes. We previously reported that the mouse cavernous EC and pericytes were confluent and spread over the whole bottom of the dish at 2 weeks [216]. However, the human cavernous EC and pericytes were confluent at 3 weeks after cultivation. This finding may result from different metabolic rate and life processes between the mouse and human. The larger the animal, the slower its cellular metabolic rate and life processes. Moreover, the difference in age between mouse (mean age, 8-week-old) and human (mean age, 56-year-old) may also contribute this discrepancy.
The primary cultured EC and pericytes are known to rapidly differentiate and lose their phenotype as the passage goes on [2526], Although some literature have reported that EC and pericytes are stable over several passages [2728], the stability of primary cultured human cavernous EC and pericytes remains a controversial issue. In the present study, we performed immunocytochemistry by using EC and pericyte markers to determine phenotype and morphologic changes from passage 1 to passage 5. Primary cultured EC and pericytes maintained their cellular characteristics up to passage 2. However, there were significant changes in their typical phenotype at passages 4 and 5, and morphologic characteristics from the passage 3 to 5. More than 60% of the human cavernous EC and pericytes did not express their specific cellular markers at passage 5. The cells were elongated and irregular in size, which was similar with fibroblast-like cell. Furthermore, the human EC and pericytes showed positive staining for fibroblast-like cell marker FSP1 at passage 5. From these findings, we have reached conclusion that primary cultured human cavernous EC and pericytes should be used at earlier passages (up to passage 2).
To further examine whether the primary cultured human cavernous EC and pericytes are capable of forming tube-like structures under different glucose concentration, we performed tube formation assay by cultivating the cells under normal- or high-glucose condition. Similar to the results from the our previous study in mice [29], the number of tube was significantly lower in human cavernous EC and pericytes exposed to high-glucose condition than in the cells exposed to the normal-glucose condition.
To the best of our knowledge, this is the first study to provide protocol to isolate human cavernous EC and pericytes. Although our in vitro model may not completely represent the complexity of in vivo diabetic ED, this model will be a valuable tool to understand the role of the each cellular component in physiologic penile erection and pathophysiology of diabetic ED.
Go to :
CONCLUSIONS
We established a simple and nonenzymatic method to isolate human cavernous EC and pericytes. Human cavernous EC or pericytes function study will be a valuable tool for determining the efficacy of candidate therapeutics targeting angiogenesis and may open a new avenue to develop novel therapeutic modalities for ED.
Go to :
 XML Download