

 PDF
PDF Citation
 Print
Print


INTRODUCTION
In the past, a number of studies have considered particulate matter (PM) and ozone in terms of morbidity and mortality.1234567 There have also been studies focusing on the effects of air pollutants on the elderly population, in which hospital visits (e.g., inpatient or outpatient) and mortality due to cardiopulmonary disease or asthma were researched.891011121314 Furthermore, similar studies have been conducted in Korea, in which the associations between air pollutants with depression and insulin resistance,1516 as well as acute stroke death were found.17 Previous studies considering the relationship between air pollution and elderly health have used time series analysis,18192021222324 often using PM and ozone as exposure variables, and mortality as the outcome variable. In 2003, Fischer et al.25 used the mortality record in the Netherlands and found associations between PM10, pneumonia and mortality as well as in regards to ozone, cardiovascular problems, pneumonia and mortality in people 75 years or older. Also, a study published by Goldberg et al.26 in 2013 found that people, aged 65 years or older, with a history of heart failure or atrial fibrillation had and increased mean percent change of mortality due to PM2.5, and those with a history of coronary artery disease had an increased mean percent change of mortality due to ozone. Furthermore, Di et al.27 reported in 2017 that an increase of 10 μg/m3 in PM2.5 and 10 ppb in warm-season ozone were statistically significantly associated with a relative increase in all-cause daily mortality rate. Despite the importance of prior studies, they have been limited to specific illnesses such as cardiovascular or respiratory diseases, and all-cause mortality. Additionally, a study conducted in Korea assessed the association between air pollutants and mortality. Kim et al.,28 reported in 2017 that PM10 level was significantly associated with all-cause mortality and cardiovascular disease depending on the season. Another study further postulated that the effects of air pollutants (e.g., SO2, Co), on mortality in the elderly population differed in high temperature.29 Furthermore, a study found an increased all-cause mortality incidence when highly dense PM10 level persisted.30 However, as far as we know, studies considering the effects of PM2.5 and ozone on elderly mortality using single and two pollutants model are scarce. Our study aimed to study the effects of PM2.5 and ozone on the health of community-dwelling elders in Seoul area using mortality data of the Korea National Statistical Office. Furthermore, additional analysis was conducted to distinguish between illnesses as a cause of mortality. Different models taking into account various lag periods were postulated to assess possible delayed effects.
METHODS
Study sample and data collection
The current study utilized the mortality data from Korean National Statistical Office to analyze the mortality data of those 60 years or older living in Seoul area between 2002 to 2012. Daily mortality incidents during the study period were collected and used as the outcome variable measure. Because more than 95% of the death certificates in Seoul are completed by medical doctors, these reports are assumed to be credible. There were 311,526 overall mortality incidents and 28,320 yearly mortality incidents during the study period. The overall as well as disease-specific mortality incidents are shown in Table 1.
Table 1
Summary statistics for air pollutants, meteorological factors and daily overall/disease-specific deaths with subgroups of disease in Seoul, 2002–2012

The number of daily overall as well as disease-specific mortality incidents were analyzed. In terms of the disease-specific mortality, illnesses such as vascular disease, chronic respiratory disease, lung cancer, diabetes and hypertension were classified according to the Charlson Comorbidity Index (CCI) based on the International Classification of Diseases 10th revision (ICD-10). CCI is widely used as a way to control for comorbidities. It was included in our analysis, because the study sample, which was the elderly population, tends to have higher number of comorbidities compared with other age groups. Moreover, the Quan algorithm used in this study showed high predictability in terms of mortality incidence of hospital in-patients.31 The usefulness of the Quan algorithm was further demonstrated in a study of Korean patients suffering from myocardial infarction. In this study, Charlson comorbidity ICD-10 conversion algorithm, observation period, as well as the predictive power according to the range of data and diagnosis of the disease were most accurate when the Quan algorithm was used.32 In regards to vascular disease, myocardial infarction (I21.x, I22.x, and 125.2), congestive heart failure (I09.9, I11.0, I13.0, I13.2, I25.5, I42.0, I42.5-I42.9, I43.x, I50.x, and P29.0), peripheral vascular disease (I70.x, I71.x, I73.1, I73.8, I73.9, 177.1, 179.0, I179.2, K55.1, K55.8, K55.9, Z95.8, and Z95.9), and cerebrovascular disease (G45.x, G46.x, H34.0, and I60.x-I69.x) were included. Also, (127.8, 127.9, J40.x-J47.x, J60.x-J67.x, J68.4, J70.1, and J70.3) for chronic respiratory disease, (C30.x–C39.x) for lung cancer, and in the case of diabetes, both diabetes without other complications and with other complications (E10.x–E14.x) were included.33 Lastly, although hypertension is not included in CCI, because it is a highly prevalent disease in the Korean elderly population,34 it was included in the study with the classification of I10.x.
Exposure variables
Both PM2.5 and ozone level were measured hourly. The amount of PM was measured using ‘Beta-ray absorption method’, which measures the amount of β -ray absorbed by a certain substance, considering the characteristic of the β-ray being absorbed more in bigger substances. To measure the ozone level, an ultraviolet ray with the wavelengths of 253.65 nm, which is most easily absorbed by the ozone, was shot at the ozone. The amount of the β-ray, which was absorbed by the ozone and decreased, was measured to calculate the ozone level. The amount of PM2.5 from 2002 to 2012 was acquired through the Climate Environment Division of Seoul, and the ozone level as well as other weather factors were acquired through the Ministry of Environment. The daily average of PM2.5 and ozone measurements were analyzed with meteorological factors (e.g., daily average of temperature, atmospheric pressure, and humidity) to account for other weather variation.
Statistical analysis
The number of disease-specific daily mortality incidents and 2 air pollutants (e.g., PM2.5 and ozone) were recorded according to date, and analyzed by the time series method (Table 2). More detailed information regarding the statistical model is described in a previous study.35 In this study, a single exposure model (i.e., air pollutants were treated as single air pollutant) and a multiple exposure model (i.e., each air pollutant was adjusted for the other air pollutant) were used. The purpose of using these models was to ascertain whether or not the association between an air pollutant and mortality remained significant even after adjusting for the other air pollutant. For example, in a single exposure model in terms of the PM only included the effect of the PM2.5, but the multiple exposure model was able to account for the effects of both the PM2.5 and ozone. Air pollutants such as sulfur dioxide or nitrogen dioxide were not included in the current study, because according a previous study,35 adjusting for these factors decreased the statistical power in regards to PM2.5, and a strong correlation between the main exposure variable (e.g., PM2.5) and sulfur dioxide or nitrogen dioxide.
Table 2
Estimated relative risk (95% intervals) in daily disease-specific mortality per 10 μg/m3 increase in PM2.5 and 10 ppb increase in ozone concentration in Seoul
Model 1 was a univariate model. Model 2 was generated using over-dispersed generalized linear models and polynomial distributed lag model for cumulative exposures over the same day and lag days, adjusted for calendar day (natural smooth function with 4 × 12 df), day of the week, temperature (lag 0, natural smooth function, 3 df), pressure (lag = 0), and humidity (lag 0). Model 3 was generated using multivariate model and ozone (lag 0, natural smooth function, 3 df). Model 4 was generated using multivariate model and PM2.5 (lag 0, natural smooth function, 3 df).
PM = particulate matter, df = degrees of freedom.
Bolds are P value less than 0.05.
aP value was less than 0.1.
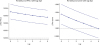
To analyze the different seasonal effects of air pollution on mortality, study periods were divided into warm periods and the rest into cold periods. Based on average sunshine hours, we considered May to August as the warm period and the rest as the cold period. The association between air pollutants and daily overall mortality differed depending on the season. Period-specific mortality rate was described with disease-specific mortality rate (Fig. 1 and Table 3).
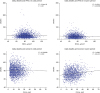
Table 3
Estimated relative risk (95% intervals) in daily disease-, period-specific mortality per 10 μg/m3 increase in PM2.5 and 10 ppb increase in ozone concentration in Seoul
Model 1 was a univariate model. Model 2 was generated using over-dispersed generalized linear models and polynomial distributed lag model for cumulative exposures over the same day and lag days, adjusted for calendar day (natural smooth function with 4 × 12 df), day of the week, temperature (lag 0, natural smooth function, 3 df), pressure (lag = 0), and humidity (lag 0). Model 3 was generated using multivariate model and ozone (lag 0, natural smooth function, 3 df). Model 4 was generated using multivariate model and PM2.5 (lag 0, natural smooth function, 3 df).
PM = particulate matter, df = degrees of freedom.
Bolds are P value less than 0.05.
aP value was less than 0.1.
Because the overall mortality rate was close to a Poisson distribution, and the explanatory variables of mortality were mostly nonlinear, the Generalized Linear Model (GLM) was used. In this model, the main exposure variable was the daily average of each air pollutant level. GLM combines the time series analysis, Poisson distribution and natural spline to calculate the short-term relationship between PM2.5, ozone and disease-specific mortality. The Partial autocorrelation function was used to induce the optimal degrees of freedom (df) in the natural spline of the calendar time, which was 4 per year according to Peng and Dominici.36 Therefore, the season and long-term trend was controlled for by the natural 3rd smooth spline with the calendar time (df = 4 × 12). Considering previous studies,3738 temperature and other pollutants (df = 3) at the time of mortality incident were integrated in to the natural 3rd smooth spline model. Day of the week (DOW), which was a categorical variable, was used as a dummy variable to control for all DOW related variables. The final model is shown below.
log[E(Yt-i)] = α + β1PM2.5t-i or β1O3t-i + ns (Temp0, df = 3) + Humi + Press + ns (PM2.50 or O30, df = 3) + ns (Time, df = 4 × 12) + β2DOW
E(Yt-i) is the expected number of deaths; PM2.5t-i or O3t-i are the average amount of PM2.5 and ozone level in Seoul with i being the lag day. For instance, when lag = 2, the average amount of PM2.5 or the Ozone level is included in the analysis; ns is the natural 3rd spline; Temp0 is the daily average temperature (°C), Humi is the daily relative humidity (%), and Press is the daily relative atmospheric pressure (hPa); PM2.50 and O30 are the densities of PM2.5 and ozone; Time indicated the long-term trend as well as seasonal effects with calendar days.
Considering the lag model, in which the resulting effect is delayed compared to the exposure, the model consists a delay (lag). For example, lag1 indicates an exposure a day prior to the resulting incident. Different lag effects were observed in prior studies. In terms of ischemic stroke, a latency between 0 and 1 was apparent (i.e., the day of as well as a day prior to the exposure),39 for chronic obstructive pulmonary disease, a latency of 0–3 (i.e., the day of, as well as one day, two days and three days prior to the exposure),40 and in terms of cardiovascular mortality and morbidity, a latency of 1–5 days was observed.41 With a careful consideration of prior results, the current study analyzed a latency up to 5 days making a single lag model (lag0–lag5). Disease-specific mortality rate was described according to the day of the exposure (Table 4).
Table 4
Estimated relative risk (95% interval) in daily mortality per 10 μg/m3 increase in PM2.5 and 10 ppb increase in ozone concentrations in Seoul, according to lag days

Model 1 was a univariate model. Model 2 was generated using over-dispersed generalized linear models and polynomial distributed lag model for cumulative exposures over the same day and lag days, adjusted for calendar day (natural smooth function with 4 × 12 df), day of the week, temperature (lag 0, natural smooth function, 3 df), pressure (lag = 0), and humidity (lag 0). Model 3 was generated using multivariate model and ozone (lag 0, natural smooth function, 3 df). Model 4 was generated using multivariate model and PM2.5 (lag 0, natural smooth function, 3 df).
PM = particulate matter, df = degrees of freedom.
Bolds are P value less than 0.05.
aP value was less than 0.1.
The results of the statistical analysis in the current study were based on the relative risk of daily mortality due to 10 µg/m3 increase in the PM density and 10 ppb increase in the ozone density. A P value below 0.05 was considered statistically significant, and all analyses were conducted using R statistical software, version 3.3.3 (R Foundation for Statistical Computing, Vienna, Austria).
RESULTS
Between 2002 and 2012, PM2.5 level had a mean value of 29 µg/m3 (standard deviation [SD], 18 µg/m3; MAX, 366 µg/m3), and ozone level had a mean value of 17 ppb (SD, 1 ppb; MAX, 63 ppb). In the same period the average for temperature was 12.7°C, humidity 61% and air pressure was 1,005.7 hPa. There were an average of 78 (SD, 11) overall daily mortality, 16 (SD, 5) mortality due to vascular disease, 3 (SD, 1) due to chronic respiratory disease, 5 (SD, 2) due to lung cancer, 2 (SD, 1) due to hypertension, and 4 (SD, 2) due to diabetes (Table 1).
The association between air pollutants and daily overall mortality differed depending on the season. Considering the warm-period and the cold-period, increased mortality risk in association with increased PM2.5 was apparent in the cold-period (R2 = 3.04e–05; P = 0.230), but not in the warm-period (R2 = 0.0014; P = 0.001). Contrastingly, the association between ozone and mortality was apparent in the warm-period (R2 = 0.0242; P = 5.5e–55), but not in the cold-period (R2 = 0.000228; P = 0.041) (Fig. 1).
In regards to daily mortality, as the level of particulate level increased by 10 µg/m3, the overall mortality rate in the multiple exposure model, adjusting for ozone level, increased by 1.0037 (95% confidence interval [CI], 1.0027–1.0046; P < 0.05), and mortality due to vascular disease by 1.0049 (95% CI, 1.0001–1.0098; P < 0.05). In the multiple exposure model, adjusting for PM2.5, ozone was associated with 1.0027 (95% CI, 1.0002–1.0052; P < 0.05) fold higher overall mortality rate and, 1.0304 (95% CI, 1.0078–1.0529; P < 0.05) fold higher risk of mortality due to diabetes in the single exposure model (Table 2). Considering the warm and cold period separately, in the multiple exposure model, with ozone as the main exposure factor, increase in the overall mortality rate 1.0046 (95% CI, 1.0010–1.0083; P < 0.05) and mortality due to diabetes 1.0422 (95% CI, 1.0049–1.0795; P < 0.05) were significant in the warm-period. Moreover, in the multiple exposure model, adjusting for PM2.5, the overall mortality rate increased by 1.0039 (95% CI, 1.0000–1.0078; P < 0.05) due to ozone in the cold-period. In association with PM2.5, overall mortality increased by 1.0046 fold and mortality due to vascular disease by 1.0061 fold in the multiple exposure model adjusting for ozone during the cold-period. Also, during the warm-period, the overall mortality increased by 1.0025 fold (95% CI, 1.0004–1.0045; P < 0.05) (Table 3).
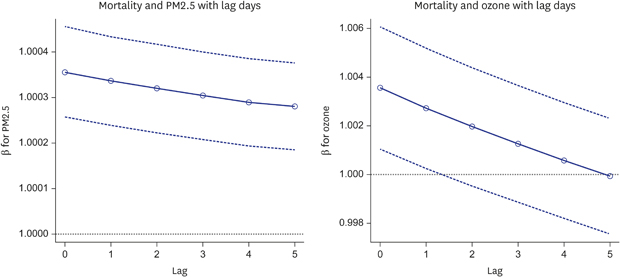
The relative risk with the lag effect of mortality due to increase in ozone level is shown in Table 4 and Fig. 2. The relative risk of mortality due to increase in PM2.5 level in the single exposure model was 1.0062 (95% CI, 1.0053–1.0071; P < 0.05) on the day of death, and 1.0060 (95% CI, 1.0051–1.0069; P < 0.05) one day after death. The results of the lag effect are as follows: lag 0 (day of death): 1.0035, 95% CI, 1.0025–1.0145; lag 1: 1.0033, 95% CI, 1.0024–1.0043; lag 2: 1.0032, 95% CI, 1.0022–1.0041; lag 3: 1.0030, 95% CI, 1.0020–1.0040; lag 4: 1.0029, 95% CI, 1.0019–1.0038; lag 5: 1.0028, 95% CI, 1.0018–1.0037; all P < 0.05). In the model with ozone as the exposure factor, adjusting for meteorological factors, the lag effect remained significant until one day after death, and was smaller compared to the model considering PM as the main exposure factor: lag 0 (day of death): 1.0035, 95% CI, 1.0010–1.0061; lag 1: 1.0027, 95% CI, 1.0003–1.0052; all P < 0.05). Lastly, in the multiple exposure model of ozone including PM, the result was only significant in lag 0 (day of death): 1.0025, 95% CI, 1.0000–1.0051; P < 0.05).
Fig. 2
Estimated relative risk (95% CI) in daily mortality per 10 μg/m3 increase in PM2.5 and 10 ppb increase in ozone concentrations in Seoul, according to lag days (0–5). Estimates were generated using over-dispersed generalized linear models and polynomial distributed lag model for cumulative exposures over the same day and lag days, adjusted for calendar day (natural smooth function with 4 × 12 df), day of the week, temperature (lag 0, natural smooth function, 3 df), pressure (lag = 0), humidity (lag 0) and month.
CI = confidence interval, PM = particulate matter, df = degrees of freedom.
DISCUSSION
In this study, we analyzed the short-term effects of PM2.5 on overall mortality as well as mortality due to vascular disease in the elderly. In terms of ozone, the overall mortality and mortality due to diabetes were effected. Furthermore, we observed a lag effect of PM2.5 and ozone between the day of and a few days prior to death on overall mortality. The increased vulnerability of the elderly against air pollutants was shown in a previous study, in which the mortality rate due to air pollutants was 2-3 fold higher for those 85 or older compared to those 65 and younger.18 Furthermore, in terms of the vulnerability to PM in the elderly could be explained through three mechanisms: 1) a reduced physical reserve due to the body's response to counter-act the harmful effects of PM; 2) increased inflammation due to PM; and 3) weakened health due to sarcopenia.42
The association between mortality, PM2.5 and ozone in the elderly population was found in previous studies. Di et al.27 found an increase in the mortality rate in accordance with an increase in the PM2.5 density, but in terms of ozone density, the association was only significant during the warm period. Also, Fann et al.9 found that a yearly increase of PM2.5 and an average increase in ozone density in 8 hours during the summer season were associated with 1.1 million, and 36,000 life years lost. Our results were somewhat consistent with previous findings and indicated that PM2.5 was associated with increased overall mortality in all situations, but ozone was only significantly associated with overall mortality rate during the warm period. The cause of these results is supported by previous studies proposing that photochemical formation is weaker during the cold period, and pulverized ozone density consumes the reaction between ozone and nitrogen oxides. Therefore, ozone density is negatively correlated with nitrogen oxide density, and nitrogen dioxide is positively correlated with disease related health status, causing a difference in mortality rates due to ozone density between cold and warm periods.434445464748495051
In this study, increase in the PM2.5 significantly increased the mortality rate due to vascular disease, but the effect of ozone was not ascertained. Although a number of studies have found that PM10 and PM2.5 increases the risk of cerebrovascular disease, the cause of it has not been clearly identified. However, it is possible that the PM10 or PM2.5 triggers oxidative stress of vascular endothelial cells, reduces angiogenesis, and increases vascular inflammation, which then can lead to cerebrovascular disease. Consequently, inadequate microvascular function caused by the PM2.5 could be the underlying mechanism between the association between PM2.5 and cerebrovascular disease.525354 In a study by Halonen et al.,41 hospitalization due to PM2.5 of the elderly, suffering from either asthma or COPD, increased significantly, but the association between cardiovascular health and PM2.5 was not very strongly supported. In contrast, Ren et al.55 found that 10 ppb increase in ozone density was associated with 6.5% increase in mortality due to stroke. However, because the participants included in the study were people 35 years or older, a further study only considering elderly population could show different results.
Unlike previous studies showing associations between lung cancer,5657 hypertension and air pollution,2658 our study did not find any significant association between these factors. This difference could be accounted for by the possibility that the number of mortality incidents due to lung cancer was relatively small, limiting the statistical power. In regards to hypertension, it is noteworthy to consider that the diagnosis of a disease for the elderly, suffering from multiple diseases, is often made for convenience depending on the medical prescription, subsequently not correctly reflecting the correct incident rate.59
The association between ozone density and mortality due to diabetes during the warm period was significant, but was much weaker in regards to PM2.5. In a previous study looking at the association between air pollutants and the markers of insulin resistance in Korean population, PM10 and ozone were both associated with an increase in insulin resistance of the elderly population. Additionally, certain genotype was shown to increase the effects of air pollutants on insulin resistance.15 In a study conducted in Italy, increase in PM10, PM2.5 and ozone density was associated with diabetes incidents, and in case on ozone density, the association remained significant even after controlling for other sources of pollutants.60 In our study, the small number of mortality due to diabetes could have been the cause that limited its association with PM2.5, but the fact that the effect of ozone density remained significant in the exposure model could suggest that ozone acts as an independent risk factor in terms of mortality due to diabetes.
PM2.5 and ozone on the day of as well as a few days prior to death was associated with increased mortality in our results. This association indicates that the two air pollutants increase mortality incidents and that there is a lag effect in the relationship. The lag effect included in our study controls for seasonal overdispersion. Also, a multiple exposure model, including confounding variables often associated with air pollution and mortality, as well as a single exposure model, only including the main exposure variables, were used to estimate the lag effect. In the past, epidemiological studies have reported contrasting results. A study published by Costa et al.61 in 2017 reported that PM10 on the day of and a day prior to death was associated with increased non-accidental mortality incidents as well as mortality due to cerebrovascular disease, and chronic lung disease. Furthermore, an accumulation of PM10 during 10 days prior to death significantly increased the mortality incidents due to cerebrovascular disease and chronic lung disease. Also, while a study from Japan published in 2013 found that a maximum 8 hours of 10 ppb increase in ozone was associated with 0.69% increase in mortality incidence,62 studies conducted in Canada and Finland did not find any lag effects in terms of the effect of air pollutant on the association between heart failure and cardiopulmonary disease with mortality.6364 Accordingly, each air pollutant influenced mortality incidents differently in our study. Unlike the PM2.5, which showed 5 days of lag effect, the effects of ozone density were much smaller, only showing significant effects on the day of and a day prior to the death. Because we used daily averages to determine the mortality of ozone in this paper, the results might be underestimated compared to those that result in 1 hour or 8 hours maximum. However, the 5 days lag effect was apparent even in the multiple exposure model, controlling for ozone density, the amount of PM2.5 exposure on the day of as well as several days before death needs to be considered.
There are several limitations of this study. First, because the study only included those 60 years and older, if age is a confounding factor in the relationship between air pollutants and medical use, it is difficult to generalize the results to the younger generation. Second, important factors such as influenza epidemic, pollen, and index of holidays were not accounted for, it is possible that confounders were not controlled completely.
Despite these limitations, this study does have various strengths. First, the current study used the population representative data of the Korean National Statistical Office to derive a significant association between PM2.5, ozone and mortality. Second, because the results included overall mortality as well as mortality due to highly prevalent illnesses in the elderly population, the association of interest was found in terms of more various conditions.
The results of the current study provide meaningful findings. Although both PM2.5 and ozone were significantly associated with overall mortality, the lag effect was longer in terms of the PM2.5. Also, because the results differed according to warm and cold periods, it could be assumed that the period season changes the effects of the PM2.5 on mortality. In future studies, the research should be expanded to wider age cohorts, and how different air pollutants influence medical use should be considered in more various types of air pollutants.
 XML Download