

 PDF
PDF ePub
ePub Citation
 Print
Print


Keratoconus and post-laser in situ keratomileusis (LASIK) ectasia are progressive, non-inflammatory corneal ectasia disorders characterized by progressive corneal thinning that results in corneal protrusion, irregular astigmatism and visual distortion. Spectacles and rigid contacts lenses are typically used to improve visual acuity [1]. However, for those who cannot tolerate contact lenses, intrastromal corneal ring segments (ICRS) can be implanted to reduce refractive errors and flatten the cornea [2].
Recently, corneal collagen crosslinking (CXL) has also been widely applied to treat ectasia [3]. CXL introduces chemical bonds between corneal collagen fibers, thus enhancing the integrity and mechanical strength of the cornea [45]. In this procedure, the cornea is subjected to UV-A irradiation after being treated with a photosensitizer (riboflavin). Although the clinical effects of the diverse CXL protocols vary, CXL has been demonstrated to effectively halt the progression of ectasia by stabilizing and strengthening the cornea [3]. However, CXL alone can only reduce refractive errors by less than 3 diopters, which is not sufficient to improve naked visual acuity in very steep corneas with high myopic astigmatism.
ICRS were first introduced as an intervention for myopia [6]. In corneal ectasia, ICRS are implanted at the mid-periphery of the corneal stroma, where they displace the local anterior surface while flattening the central portion of the anterior surface. ICRS implantation has been demonstrated to improve visual acuity by reducing the refractive errors and keratometry in keratoconus [2]. ICRS implantation is regarded as an attractive surgical option because it is minimally invasive and reversible, and also can delay or preclude keratoplasty.
To achieve both visual rehabilitation and corneal stabilization, a combined procedure of ICRS implantation and CXL has been introduced. ICRS implantation flattens the corneal surface but does not prevent the progression of keratoconus; indeed, several reports have described the regression of the beneficial effects of ICRS in long-term follow-up [7891011]. On the other hand, CXL stabilizes the pathologic cornea but does not cause significant visual recovery. The combination of ICRS implantation and CXL has been demonstrated to have synergistic effects in some studies, but a consensus on these effects has not yet been reached [12].
The aim of the present study was to compare the effects of ICRS implantation followed by CXL with those of ICRS implantation or CXL alone on visual, refractive and keratometric outcomes during 12 months of postoperative follow-up.
Materials and Methods
Patients
This retrospective study adhered to the ethical standards of the Declaration of Helsinki and was approved by the institutional review board of Seoul National University College of Medicine, Seoul, South Korea (1907-089-1048). Written informed consent was waived due to the retrospective nature of the study. The study included 36 eyes of 34 patients with progressive keratoconus or post-LASIK ectasia who underwent CXL, ICRS implantation or both procedures. The procedures were performed by a single surgeon (MKK) at a single institution (Seoul National University Hospital). The medical records of the 34 patients were retrospectively reviewed. We included eight eyes of eight patients in the ICRS group, 20 eyes of 18 patients in the CXL group and eight eyes of eight patients in the ICRS + CXL group. Patients with preoperative Kmax values greater than 60 diopters or central corneal thickness (CCT) values less than 400 µm were excluded. Patients who had other ocular surface diseases, surgical history or trauma history were also excluded. The data from patients with ICRS implantation only [13] and CXL only [14] were reported previously, and were included in this study for comparison with the ICRS + CXL group.
Clinical evaluation
Preoperative and postoperative examinations included best-corrected visual acuity (BCVA) and uncorrected visual acuity (UCVA) as a logarithm of the minimum angle of resolution, refractive errors determined with an auto kerato-refractometer (KR-8900, Topcon, Tokyo, Japan), and keratometric values including the maximum (Kmax), minimum (Kmin), and average (Kavg) determined by topography (ORBSCAN II, Bausch & Lomb, Rochester, NY, USA). CCT and thinnest corneal thickness (TCT) were measured by anterior segment optical coherence tomography (AS-OCT; Visante OCT, Carl Zeiss Meditec, Dublin, CA, USA). Noncontact specular microscopy (SP-8800, Konan, Hyogo, Japan) was used to measure endothelial cell density in the CXL and ICRS + CXL groups. Preoperative measurements were compared with postoperative measurements at 1, 2 or 3, 6 and 12 months for intra-group analyses. The measured values were also compared among the groups at each time point for inter-group analyses.
ICRS implantation
The implantation axis and depth of the ICRS (Intacs, Addition Technology, Sunnyvale, CA, USA) were determined by preoperative topography (ORBSCAN II) and AS-OCT (Visante OCT) based on the nomogram defined by the manufacturer. The depth of incision was set as 80% of the corneal thickness at the incision site, which was measured by AS-OCT. In all cases, two Intacs® with an inner diameter of 6.0 mm were inserted symmetrically. The detailed surgical procedure was reported in our previous study [13].
In brief, the center of the cornea was marked with an 11-mm zone marker (Frimen, Jiangsu, China) and a sinskey hook. The incision site was marked with reference to the corneal center, and a corneal incision was made with a diamond knife. Stromal pockets were created with a pocket hook, and a symmetric glide was inserted to enlarge the pockets. Vacuum centering guides were applied to fix the eye, and dissectors were inserted into the pockets with a vacuum of 450 mBar. The dissectors were used to create stromal tunnels both clockwise and counterclockwise. The vacuum centering guides were then removed and the ICRS were inserted. The incision site was repaired with a 10-0 nylon suture. The depth of insertion was confirmed through an intraoperative portable slit-lamp examination. A silicone hydrogel bandage contact lens (ACUVUE OASYS, Johnson & Johnson Vision Care, Jacksonville, FL, USA) was applied, and was maintained with topical 0.5% moxifloxacin and 1% prednisolone four times per day for seven days. In the combined group, crosslinking was performed after an average interval of 41.8 ± 20.2 days.
Crosslinking
The detailed surgical procedure for CXL was reported previously [14]. The corneal epithelium was peeled off and the CCT (≥325 µm) was determined by pachymetry (Pocket II, Quantel Medical, Bozeman, MT, USA). Then, a retention ring (8.0 mm in diameter, Frimen) was applied to the epi-off corneal surface, and 0.1% isotonic riboflavin with dextran-free hydroxypropyl methylcellulose (VibeX Rapid, Avedro, Waltham, MA, USA) was continuously applied for ten minutes within the retention ring. Then, a trephined (inner diameter, 8.5 mm) silicone hydrogel bandage contact lens (ACUVUE OASYS) was applied to protect the limbus from UV irradiation. UV-A irradiation (Avedro) was applied at a pulsing (1 second on/off) intensity of 30 mW/cm2 at a wavelength of 365 nm for eight minutes, resulting in a cumulative dose of 7.2 J/cm2. After irrigation, the silicone hydrogel bandage contact lens was applied for seven days with topical 0.5% moxifloxacin and 1% prednisolone four times per day.
Statistical analysis
Statistical analysis was performed with IBM SPSS Statistics ver. 22 (IBM Corp., Armonk, NY, USA). Paired t-tests were used to compare each of the baseline parameters with the follow-up measurements in intra-group analyses. For inter-group analyses of continuous variables, the Kruskal-Wallis test was performed, and Bonferroni correction was applied for the post hoc test. The data are presented as the mean ± standard deviation, and statistical significance was established if p < 0.05 (paired t-test) or p < 0.017 (Kruskal-Wallis test). After Bonferroni correction, statistical values are considered significant only when p < 0.017 in the Kruskal-Wallis test.
Results
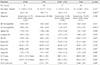
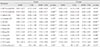
In this study, 36 eyes from 34 patients were analyzed over a mean postoperative follow-up period of 12.2 ± 3.4 months. The baseline characteristics of each study group are shown in Table 1. The mean age of all the subjects was 31.0 ± 10.3 years, and patients in the ICRS + CXL group were significantly older than patients in the other groups at the time of operation (p = 0.005). Diagnoses of keratoconus and post-LASIK ectasia were made in 30 and 6 eyes, respectively; however, there were no significant demographic differences between the groups. The BCVA, refractive errors, keratometric values (Kmax, Kmin, and Kavg) and astigmatism did not differ significantly among the groups. The UCVA was lower in the ICRS + CXL group than in the other groups (p < 0.001). The CCT exhibited a marginally significant difference among the groups (p = 0.041), while the TCT did not. Endothelial cell density measurements were not routinely performed in the ICRS group, and did not differ between the CXL and ICRS + CXL groups.
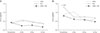
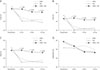
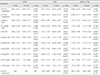
Table 2 displays the intra-group changes in each clinical parameter between the preoperative measurement and the postoperative measurements at 6 and 12 months. Table 3 and Fig. 1A, 1B, 2A–2C, 3A–3D display the inter-group comparisons of each clinical parameter at postoperative 6 and 12 months. The intra-group analysis revealed that the BCVA of the CXL group had significantly improved after 12 months (p = 0.05) (Table 2) and the UCVA of the ICRS + CXL group had significantly improved after 6 months (p = 0.003) (Table 2) compared with the preoperative level. The inter-group analysis demonstrated that the improvement in the UCVA (Δ UCVA) was greater in the ICRS + CXL group than in the other two groups at both 6 (p = 0.008) and 12 months (p = 0.028) (Table 3 and Fig. 1B). Spherical and spherical equivalent refractive errors were significantly reduced in both the ICRS group (p = 0.002 at 6 months, p = 0.004 at 12 months) (Table 2) and the ICRS + CXL group (p < 0.001 at both 6 and 12 months) (Table 2), but not in the CXL group. The absolute reductions (Δ) of spheres and spherical equivalents were the greatest in the ICRS + CXL group at 6 and 12 months (all p < 0.001) (Table 3 and Fig. 2). The CXL group exhibited significant reduction of cylinders at 12 months (p = 0.028) (Table 2). However, the reduction of cylinders did not differ significantly among the three groups (p = 0.554) (Table 3 and Fig. 2B).
Kmax and Kavg were significantly reduced in all 3 groups at postoperative 6 and 12 months (Table 2). Kmin was also significantly reduced in the ICRS and ICRS + CXL groups over time (Table 2). The absolute reductions in Kmax, Kmin, and Kavg were greater in the ICRS + CXL group than in the other groups (all p < 0.001) (Table 3 and Fig. 3). However, in the ICRS + CXL group, the absolute reductions (Δ) in Kmax, Kmin, and Kavg did not change significantly from 6 months to 12 months (p > 0.05) (Table 2). Meanwhile, the topographic reduction of astigmatism was only significant in the CXL group (p = 0.007 at 6 months, p < 0.001 at 12 months) (Table 2), although it did not differ significantly from those in the other groups (Table 3 and Fig. 3D).
CCT and TCT were reduced by approximately 10 µm in the CXL group (CCT: p = 0.027 at 6 months, p = 0.019 at 12 months; TCT: p = 0.003 at 6 months) (Table 2). On the contrary, both the CCT and TCT had increased in the ICRS + CXL group at 12 months (p = 0.037 and 0.050, respectively) (Table 2). These changes in corneal thickness differed significantly among the three groups at 6 months, but not at 12 months (CCT, p = 0.012 and 0.040; TCT, p = 0.012 and 0.023 at 6 and 12 months; respectively) (Table 3). Endothelial cell density did not exhibit significant changes in intra- or inter-group analyses.
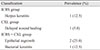
Complications related to the operation and postoperative status are listed in Table 4. A patient in the ICRS group developed herpes keratitis and was successfully treated with topical acyclovir and oral valaciclovir for one month without a remaining corneal lesion. In the CXL group, there was a single case of delayed wound healing, which spontaneously resolved in 14 days through conservative treatment with artificial tears. There were some complications in the ICRS + CXL group. One patient experienced bacterial keratitis seven days after CXL. After two weeks of topical moxifloxacin instillation, the infection resolved with no definite sequelae. Two patients exhibited epithelial ingrowth requiring a surgical procedure to remove the lesion. In the first case, the epithelial ingrowth was identified seven weeks after CXL at the incision site of ICRS implantation in a keratoconus patient. The epithelial ingrowth was surgically removed at the stromal level, and no further ingrowth was identified. In the second case, the epithelial ingrowth was identified three weeks after CXL at the temporal LASIK flap margin in a post-LASIK ectasia patient. During the epithelial peeling step of the CXL procedure, the flap displayed mild shrinkage with gutters, so a suture was added to tighten the flap. However, a shallow epithelial ingrowth appeared at the flap margin, so this ingrowth was surgically removed with additional sutures. No further recurrence was noticed in this patient.
Discussion
In this study, ICRS implantation followed by CXL within one month seemed to reduce refractive errors and keratometric values and improve UCVA to a degree that was comparable to or greater than that of ICRS implantation or CXL alone. The reduction effect seemed to be stabilized 6 months after ICRS + CXL treatment.
In a recent meta-analysis, no significant difference in refractive or keratometric outcomes was found between ICRS implantation and ICRS + CXL treatment [12]. In the same meta-analysis, ICRS + CXL had better effects than ICRS implantation alone on corrected distant visual acuity, but not on uncorrected distant visual acuity. CXL is known to effectively prohibit the progression of keratoconus. Meanwhile, ICRS implantation is known to flatten the cornea and substantially reduce refractive errors, resulting in visual improvement. However, some studies have demonstrated that the effects of ICRS implantation diminish during long-term follow-up, and ICRS implantation itself is not sufficient to prevent ectatic progression [15]. Therefore, sequential ICRS implantation and CXL is an attractive treatment option for corneal ectasia, as CXL may not only prohibit the progression of corneal ectasia, but also prolong the effects of ICRS implantation by stabilizing the cornea in the flattened state.
We previously reported that accelerated CXL and conventional CXL had comparable outcomes [14]. As expected, when we combined ICRS implantation with the same accelerated CXL protocol in the present study, we observed visual improvement and reduced refractive errors. Although a meta-analysis found no difference among the three methods we analyzed, the authors used different methods of CXL, which may have affected the final outcomes in terms of visual acuity or refraction. Surprisingly, we found that the UCVA was better in the CXL group than in the ICRS + CXL group at 6 and 12 months (Fig. 1B). This may have been due to the fact that the preoperative UCVA was worse in the ICRS + CXL group than in the CXL group. Irregular astigmatism or optical aberrations induced by the insertion of the ICRS may be other plausible reasons for the lower UCVA in the ICRS + CXL group than in the CXL group. However, in the intra-group analysis, the greatest improvement in UCVA from the preoperative value (Δ UCVA) was observed in the ICRS + CXL group (Table 2, 3), suggesting that the combined surgery had synergistic efficacy. Taken together with the fact that the greatest reductions in spherical equivalents, Kmax and Kavg values were observed in the ICRS + CXL group, these results may suggest that ICRS + CXL is a preferable option for improving the UCVA in patients with severe myopic changes due to steep and ectatic corneas.
The optimal sequence of and interval between ICRS implantation and CXL is controversial. A comparative study indicated that ICRS implantation followed by CXL was more effective than the reverse order [9]. Stabilizing the flattened cornea may be more effective than flattening the stabilized cornea in terms of preventing ectatic progression and improving visual acuity. Theoretically, flattening the ectatic cornea before CXL may have the maximal flattening effect. For this reason, we first performed ICRS implantation to flatten the ectatic cornea, and then performed CXL to strengthen the flattened cornea. In terms of the interval between the procedures, studies with same-day, 3- or 6-month intervals have had comparable clinical results, even though the procedures were performed in different sequences [91617]. Thus, there is no consensus on the ideal sequence or interval. A recent meta-analysis demonstrated that simultaneous ICRS implantation and CXL may provide better outcomes than staged protocols for corneal shape improvement, but not for visual improvement [18]. Prospective studies with well-organized, homogenous protocols are required to establish the optimal sequence and interval.
In the ICRS and ICRS + CXL groups, the BCVA had not significantly improved after 6 or 12 months. Only the CXL group demonstrated significant improvement in the BCVA at 12 months. Our measurement of BCVA was based on the correction of refractive errors determined by an auto kerato-refractometer. In keratoconus or corneal ectasia, image deformation is inevitable, and resultant aberrations at the retinal plane can interfere with autorefraction measurements. In a recent study comparing manifest refraction and autorefraction in keratoconus, significantly superior corrected visual acuity was achieved by manifest refraction [19]. Most of the studies discussed in this report were based on manifest refraction. Thus, our BCVA data were limited by the fact that vision was corrected only by automated refraction. However, the UCVA significantly improved over time compared with the preoperative level in the ICRS + CXL group, suggesting that reduced refractive errors combined with CXL may contribute to visual improvement.
Significant differences in corneal thickness changes were observed among the groups. The central and TCT decreased significantly in the CXL group, but not in the ICRS group. However, both of these parameters increased significantly in the ICRS + CXL group; thus, the combination of ICRS implantation and CXL may have resulted in corneal thickening. In the ICRS group, 2 months after implantation, the central and TCT values had increased by 18.5 and 11.1 µm, respectively. However, these parameters continuously decreased after then and there was no significant difference after 12 months. In the ICRS + CXL group, the corneal thickness values at 2 months were similar to those of the ICRS group; however, the further decrease in thickness after 2 months were much smaller. This phenomenon may be due to the stabilizing effect of CXL, which increases the corneal rigidity and corneal resistance to thinning. Further studies on the histopathology of the cornea after the procedure and more detailed AS-OCT examinations are required.
In the CXL protocol we used, the corneal epithelium was peeled off for riboflavin application and UV irradiation of the stroma. In cases of epithelial ingrowth, epithelial cells may have entered through the previous ICRS incision site during the peeling step of CXL, due to incomplete wound healing in one month. The epithelial ingrowth in the margins of the LASIK flap in one case may have been induced by damage to the flap margin during the epithelial peeling. Therefore, highly delicate epithelial peeling is required during the CXL procedure, especially following ICRS surgery. As an alternative, trans-epithelial CXL can be attempted after ICRS implantation.
ICRS implantation and CXL are indicated for the mild to moderate stages of corneal ectasia, and are able to delay keratoplasty. Late-stage ectasia requires graft surgeries such as deep anterior lamellar keratoplasty or penetrating keratoplasty. Previous studies comparing ICRS implantation with deep anterior lamellar keratoplasty or penetrating keratoplasty have indicated that graft surgery is superior to ICRS implantation [1320]. However, ICRS implantation is still an effective treatment, and is regarded as an alternative to graft surgery. Combined ICRS + CXL treatment has not yet been compared with graft surgery. Considering the side effects, cost and recovery period of graft surgery, ICRS implantation with CXL could be an attractive alternative. Future studies comparing graft surgery with the combined procedure are needed.
Our study had several limitations, mostly inherent in its retrospective design, aside from the small sample size. Decisions on protocols were based on preoperative status, so the study was susceptible to selection biases. The preoperative age was greater and the UCVA was worse in the ICRS + CXL group than in the other groups, which may have affected the postoperative outcomes. Thus, we re-analyzed the outcomes after adjusting for age by removing two patients who were over fifty years old from the ICRX + CXL group (Supplemental Table 1). After this adjustment, the mean age of the ICRS + CXL group was 38.3 ± 9.3 years and the UCVA was 1.23 ± 0.25 logarithm of the minimum angle of resolution. Statistical analysis revealed that the groups did not differ significantly in age after this adjustment (p = 0.035), but the UCVA was still significantly worse in the ICRS + CXL group than in the other groups (p < 0.001) (Supplemental Table 1). However, the UCVA improvement (Δ UCVA) and the reductions in spherical equivalent, Kmax, Kmin, and Kavg (Δ SE or K) were still the greatest in the ICRS + CXL group (Supplemental Table 1). Therefore, age did not seem to affect the final outcomes significantly.
Thus, this study demonstrated the efficacy of sequential ICRS (Intacs) implantation followed by CXL within one month. Likewise, in an age-matched prospective study comparing ICRS and ICRS (Keraring) + CXL [21], the ICRS + CXL group generally exhibited better clinical outcomes. Nevertheless, more meticulously controlled studies with larger samples are required for stronger validity. Still, we believe that we adequately compared the clinical outcomes of the three procedures and proposed possible explanations for the better results of the combined procedure.
In conclusion, our preliminary study demonstrated that ICRS implantation followed by CXL within one month may be effective and superior to ICRS or CXL alone in reducing refractive errors and keratometric values and improving the UCVA after 12 months of follow-up.

 XML Download