

 PDF
PDF ePub
ePub Citation
 Print
Print


Central serous chorioretinopathy (CSC) is one of the most common diseases of the posterior segment of the eye and a frequent cause of mild-to-moderate visual impairment [1]. Acute CSC typically has an excellent prognosis and self-resolving natural course with almost full visual recovery to the premorbid level. However, active treatment should be considered in cases of CSC with persistent macular subretinal fluid (SRF) or reduced visual acuity [2]. Various medical management strategies for CSC are under evaluation, including a wide spectrum of new drugs.
Acetazolamide is a carbonic anhydrase inhibitor that inhibits carbonic anhydrase IV in the retinal pigment epithelium (RPE) to promote the resorption of SRF and retinal adhesion [3]. A previous study suggested faster subjective visual improvement and clinical resolution occurred among patients treated with acetazolamide as compared with in the control group, with no differences in final best-corrected visual acuity (BCVA) or recurrence rate [4].
Enhanced depth imaging (EDI) has expanded our understanding of choroidal involvement in CSC. With EDI optical coherence tomography (OCT), CSC is now considered one of a range of pachychoroid diseases, of which thickened choroid is a characteristic finding [5]. More recently, not only the absolute thickness of the choroid but also the vascularity of the choroid has become important in the context of these diseases. The choroidal vascularity index (CVI), which is the proportion of luminal area (LA) to cross-sectional choroid area [6], makes the quantitative analysis of choroidal vascularity possible and is noticeably increased in CSC patients [7].
Previous studies have suggested that acetazolamide treatment may promote more rapid subjective visual improvement, but no prior studies have established how this carbonic anhydrase inhibitor drug affects the choroidal structure. Thus, the purpose of this study was to analyze the effects of acetazolamide on choroidal structure changes in eyes with CSC.
Materials and Methods
This retrospective interventional case-control study followed the tenets of the Declaration of Helsinki. Approval was obtained from the institutional review board of the Bucheon St. Mary's Hospital, The Catholic University of Korea (HC19RESI0083). Informed consent was waived due to the retrospective nature of the study. All patients were recruited between March 2017 and March 2018 at Bucheon St. Mary's Hospital, Bucheon, Korea. Patients experiencing their first attack of acute CSC (i.e., with a symptom duration of less than 3 months) and who were treated with or without acetazolamide were included. Group 1 was treated with oral 500 mg of acetazolamide daily for four weeks, while group 2 was followed without any treatment. The exclusion criteria were as follows: a history of any ocular trauma, ocular surgery, or intraocular laser therapy; a history of prior intravitreal or subtenon drug injection; iatrogenic CSC caused by corticosteroids; media opacity that could affect image quality; other intraocular diseases such as glaucoma, age-related macular degeneration, or retinal artery or vein occlusion; other systemic diseases that could affect the eye; and a refractive error of greater than ±6 diopters (spherical equivalent).
All patients underwent comprehensive ocular examinations, including BCVA, intraocular pressure, detailed slitlamp biomicroscopy and dilated fundus examination after dilatation of the pupils, fundus photography, OCT imaging, autofluorescence imaging, and fluorescein angiography. OCT imaging was performed using the EDI mode of a high-definition OCT system (Cirrus 4000; Carl Zeiss Meditec, Dublin, CA, USA). BCVA was measured with standard decimal visual charts and was converted to the logarithm of the minimum angle of resolution (logMAR) for statistical analysis. The diagnosis of CSC was based on multimodal images including f luorescein angiography showing focal leakage at the RPE level, indocyanine green angiography showing choroidal hyperpermeability, and OCT showing SRF. Follow-up measurements including BCVA, intraocular pressure, detailed slit-lamp biomicroscopy and dilated fundus examination after dilatation of pupils, fundus photography, and OCT were performed at one week, one month, two months, and three months, respectively.
Measurement of subfoveal choroidal thickness and choroidal vascularity index
Choroidal thickness was calculated at the subfoveal area (subfoveal choroidal thickness, SFCT) and CSC lesions from the RPE to the outer border of the choroid using software-based calipers. All measurements were performed twice by the same examiner at two different time points.
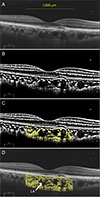
A raster scan passing through the fovea was selected for image binarization. We adapted the image segmentation technique proposed by Sonoda et al. [8] and Agrawal et al. [9]. Image binarization was performed using the ImageJ software ver. 1.51 (https://imagej.nih.gov/ij/; National Institutes of Health, Bethesda, MD, USA). A representative example of the image processing performed to obtain CVI values from the binarization process is shown in Fig. 1. The subfoveal choroidal area within a width of 1,500 µm was selected using the polygon selection tool and the total choroidal area (TCA) was marked. The selected region was added to the region of interest manager. Using the color threshold, the LA was described and subsequently added to the region of interest manager. The LA was indicated by an area of dark pixels and the stromal area was indicated by an area of light pixels, respectively. The TCA, LA, and stromal area were calculated; then, the CVI was calculated by dividing the LA by the TCA.
Statistical analysis
Continuous data were described as means ± standard deviations (95% confidence intervals). The Mann-Whitney U-test was used to compare variables between groups, and the Wilcoxon signed-rank test was used to compare differences between before and after treatment. Statistical analyses were performed using IBM SPSS Statistics ver. 22.0 (IBM Corp., Armonk, NY, USA). For all tests, p < 0.05 was considered to be statistically significant.
Results
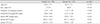
In total, 45 eyes of 45 patients were included, including 20 eyes in group 1 and 25 eyes in group 2. The mean age of the total study cohort was 49.87 ± 8.35 years. Table 1 summarizes the demographic and clinical characteristics of the study eyes. There were no statistically significant differences in age, sex distribution, BCVA, duration of symptoms, SRF height, SFCT, or CVI between the two groups at baseline (all p > 0.05). The mean SFCT and CVI values were 388.2 ± 92.3 µm and 69.53 ± 2.78% for the acetazolamide treatment group (group 1) and 391.1 ± 104.2 µm and 70.85 ± 3.32% for the observation group (group 2), respectively.
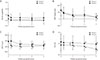
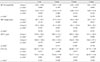
Clinical and anatomical data collected during follow-up are shown in Table 2. Although there were no significant differences in BVCA at month 3 in either group (p = 0.083 and 0.183, respectively), BCVA on the logMAR scale improved from 0.06 ± 0.07 and 0.17 ± 0.24 to 0.01 ± 0.03 and 0.09 ± 0.18 in groups 1 and 2, respectively. Separately, SRF height at month 3 was decreased in both groups, specifically from 133.0 ± 88.4 to 24.9 ± 53.7 µm in group 1 (p = 0.021) and 130.9 ± 79.1 to 28.0 ± 56.5 µm in group 2 (p = 0.025). In group 1, a significant decrease in SRF height was additionally seen at month 1 (p = 0.038). Further, CVI was decreased significantly at month 3, specifically from 69.53 ± 2.78% to 67.74 ± 1.89% in group 1 (p = 0.008) and 70.85 ± 3.32% to 69.92 ± 3.28% in group 2 (p = 0.002). In group 1, a significant decrease in the SFCT and CVI started at one week and one month (p = 0.021 and 0.008), respectively. Conversely, in group 2, a significant decrease in the SFCT and CVI started at one month and two months (p = 0.005 and 0.015), respectively. Changes in BCVA, SRF height, SFCT, and CVI during the three-month follow-up period are illustrated in Fig. 2A–2D. When the two groups were compared, CVI at month 2 was significantly different (p = 0.015) and all other values were similar (all p > 0.05). Changes in SRF height, SFCT, and CVI during the three-month follow-up period are illustrated in Fig. 3A, 3B.
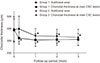
In 43 of 45 eyes, the main lesions were included within the inner 500-µm area of the fovea, while, in the remaining two eyes, the main lesions were located in the outer 1,500-µm area of the fovea. The change in choroidal thickness below the CSC lesion is shown in Fig. 4 in comparison with the SFCT change (387.1 ± 92.1 µm at baseline, 322.1 ± 48.3 µm at 1 week, 306.6 ± 52.1 µm at 1 month, 309.1 ± 48.6 µm at 2 months, and 309.3 ± 47.4 µm at 3 months in group 1 vs. 393.2 ± 101.1 µm at baseline, 398.2 ± 103.3 µm at 1 week, 340.1 ± 59.9 µm at 1 month, 336.6 ± 58.1 µm at 2 months, and 325.7 ± 67.0 µm at 3 months in group 2).
Discussion
Pikkel et al. [4] reported that acetazolamide treatment for CSC shortens the time to both subjective and objective clinical resolution. Our results support the hypothesis that acetazolamide treatment has beneficial effects in facilitating the rapid resolution of CSC. Additionally, our study demonstrated that there was a more rapid decrease in the SFCT and CVI of acetazolamide-treated patients than in the observation group. To the best of our knowledge, this study is the first to report the effects of acetazolamide in choroidal structural changes in patients with CSC.
Although the main pathophysiology of CSC remains unclear, there is angiographic evidence that this disease involves choroidal vascular hyperpermeability [101112131415]. Choroidal vessel dilation as well as diffuse leakage from the choriocapillaris into the stroma are features of acute CSC as seen on indocyanine green angiography [121617]. Additionally, recent studies on choroidal morphology in CSC using EDI OCT imaging have revealed dilatation of the choroidal vessels, which causes an increase in the SFCT [518]. This may lead to increased hydrostatic pressure within the choroid, which can alter the overlying RPE and retina [5]. In this study, a significant reduction in the SFCT in both groups preceded a decrease in the CVI, suggesting that choroidal expansion improved before dilatation of the choroidal vessels improved. Further, acetazolamide treatment appeared to affect the SRF, choroidal thickness, and choroidal vessels more rapidly.
The results of this study indicate that the use of acetazolamide did not affect the final clinical outcomes. This outcome is in line with those of previous studies that evaluated macular edema, subjective visual impairment improvement, and visual acuity in order to evaluate the effects of acetazolamide in relation to improvements in CSC [34]. Both the CVI and SFCT could be useful parameters for evaluating general improvements in CSC. This study describes the clinical importance of the choroidal structure in the progression of CSC eyes treated with acetazolamide. It has been reported that choroidal thickness decreases with the improvement of CSC [19]. In the current study, SFCT and CVI tended to decrease more rapidly with acetazolamide, together with the occurrence of a more rapid resolution of SRF.
Previous investigations have suggested that RPE loses normal polarity in the presence of macular edema, and treatment with acetazolamide induces the reestablishment of normal polarization in the RPE [202122]. In this regard, the role of acetazolamide in reestablishing the normal polarization of the RPE may have improved choroidal expansion and vessel dilation. Normalized polarization of the RPE would reduce the hydrostatic pressure within the choroid, decreasing the volume of the choroid and subsequently normalizing the choroidal vessel. Since acetazolamide has a systemic diuretic effect and an intraocular pressure- lowering effect, it is also thought that the choroidal structure can be altered by way of reducing the volume of choroidal vessels [23].
There are some limitations to this study that should be mentioned, including its small sample size. One major limitation is that we measured only the subfoveal choroidal area within a width of 1,500 µm on the scan as a representative area in the measurement of the CVI. Further analysis of a larger area could provide better information regarding choroidal vascularity. Additionally, diurnal variations in the choroid may have distorted the results since OCT results were not obtained at the same time in all patients during each session. However, all examinations did occur between 1:00 p.m. and 4:00 p.m., so we believe that any diurnal variation would be minimal. A future study with a larger sample size and a randomized prospective design is warranted to support the findings of the present study.
In conclusion, acetazolamide treatment does not affect the final clinical and anatomical status, though it may lead to an accelerated resolution of the SRF and choroidal structure. The use of acetazolamide led to a rapid resolution of the SRF and decreased the SFCT, which was followed by a decrease in the CVI. Determining the pathophysiologic mechanism for this change requires further investigation.
 XML Download