

 PDF
PDF ePub
ePub Citation
 Print
Print


INTRODUCTION
Ectopic fat, caused by a positive energy balance and impaired lipid storage capacity of the subcutaneous fat, can result in the accumulation of fat in undesired sites, such as the liver, skeletal muscle and the heart (1). Ectopic fat accumulation plays an important role in the pathogenesis of obesity-related metabolic consequences, including coronary heart disease (CHD) (23).
Ectopic fat accumulation in hepatocyte is termed non-alcoholic fatty liver disease (NAFLD). NAFLD ranges from simple steatosis to a more advanced fibrosis, with the potential to progress to cirrhosis (4). Similar to NAFLD, the term non-alcoholic fatty pancreas disease (NAFPD) has recently been introduced to describe ectopic fat accumulation in pancreatic cells. FP may promote the development of chronic pancreatitis and pancreatic cancer (567).
NAFLD and NAFPD can be diagnosed by noninvasive means, using imaging modalities, including abdominal ultrasound (US), CT and MRI (89). Although abdominal MRI is the best imaging modality for diagnosing NAFLD and NAFPD, abdominal US is more commonly used because of its accessibility (91011).
A recent meta-analysis identified NAFLD as a significant risk factor for CHD (12). Similarly, NAFPD significantly increases the risk of metabolic comorbidities (13). However, the relationship between US-determined NAFPD severity and CHD risk has not yet been evaluated. Moreover, comparison of the predictive value between US-determined NAFLD severity and US-determined NAFPD severity, as well as the predictive value of the combination of US-determined NAFLD and NAFPD severity, also need to be evaluated. We hypothesized that US-determined NAFPD severity would be significantly associated with CHD risk and, therefore, might be useful for predicting high CHD risk, in combination with US-determined NAFLD severity.
The primary goal of our analysis was to evaluate the relationship between US-determined NAFPD severity and CHD risk. We also aimed to evaluate the predictive performance of US-determined NAFPD severity in determining intermediate/high CHD risk compared to US-determined NAFLD severity.
MATERIALS AND METHODS
STUDY POPULATION
This retrospective study was approved by our Institutional Review Board, and written informed consent was waived as we used only de-identified data routinely collected during health screening visits (IRB No. 2018-09-001). We conducted a retrospective analysis of young adults who underwent a comprehensive health screening examination at our health promotion center between September 1, 2017 and June 30, 2018. We enrolled adults, 18- to 40-years-old based on a recent study which demonstrated a significant change in pancreatic echogenicity and strain after the age of 40 years (14). Additionally, as our objective was to evaluate the association between NAFPD and CHD risk score, our analysis was restricted to participants who underwent abdominal US (n = 1260). We excluded participants who had any of the following conditions: alcohol intake ≥ 30 g/d in men or ≥ 20 g/d in women (n = 585); history of liver cirrhosis, positive hepatitis B surface antigen or hepatitis C virus antibodies (n = 48); history of CHD (n = 18); use of warfarin or antithrombotic medication (n = 15); history of diabetic mellitus (n = 15), pancreatitis (n = 9) or use of anticancer drug (n = 8). Patients were excluded from analyses if the pancreas was not visualized on US (n = 9) or laboratory data was incomplete (n = 9). Finally, the data of 544 consecutive participants were included in our analysis.
DATA COLLECTION
Data collection was performed consecutively based on self-administered questionnaires and electronic medical records. Demographic characteristics, smoking status, alcohol consumption, medical history, and medication use were collected through standardized, self-administered questionnaires. Alcohol consumption was categorized as none or moderate (< 30 g/d in men and < 20 g/d in women). Height, weight, waist circumference (WC), and seated blood pressure were measured by trained nurses. Body mass index (BMI) was calculated as weight in kilograms divided by height in meters squared.
SETTING OF THE ABDOMINAL US
Abdominal US was performed to assess the severity of pancreatic steatosis (US-determined NAFPD) and hepatic steatosis (US-determined NAFLD). Abdominal US was performed using the LogiQ E9 (GE Healthcare, Milwaukee, WI, USA) scanner, with a 1–5 MHz curvilinear abdominal transducer, by board-certified radiologists unaware of the study aims. In order to compare the echogenicity of the renal parenchyma to the one of the pancreatic parenchyma, we set dual screen mode. The US image of the right kidney was displayed on the left side of the US screen, and the US image of the pancreas was displayed on the right. Equipment settings for abdominal US were as follows: depth range, 9 cm; transmit focal depth, 6 cm; gain, 80 dB; dynamic range, 60 dB; time gain compensation sliders in central position; lateral gain compensation in neutral position; and mechanical index, 0.2. Changing the equipment settings during US examination was permitted for obtaining adequate image quality according to body habitus in patients.
US IMAGE ANALYSIS
US-determined NAFPD and NAFLD severity were evaluated independently on the picture archiving and communication system (PACS) (Centricity RA1000, GE Healthcare, Barrington, IL, USA) by two board-certificated radiologists who were not involved in participant selection. The two reviewers were unaware of the final clinical diagnoses and disease prevalence. Also, the written reports of abdominal US were not referenced.
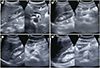
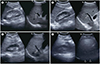
A US diagnosis of FP was made based on previous studies (1117). FP was categorized as non FP, mild FP, moderate FP, or severe FP, based on the echogenicity of the pancreas relative to that of the renal parenchyma (Fig. 1). A US diagnosis of FL was made based on standard criteria (810), including difference in echogenicity between the liver and kidney, visibility of the intrahepatic vessel walls, and of the diaphragm. It was categorized as normal liver, mild FL, moderate FL, or severe FL (Fig. 2). As we had already excluded participants with excessive alcohol use (≥ 30 g/d for men and ≥ 20 g/d for women) and other identifiable causes of FP and FL at baseline, as described in the exclusion criteria, FP and FL were considered as NAFPD and NAFLD, respectively.
CARDIOVASCULAR RISK ASSESSMENT BY THE FRAMINGHAM RISK SCORE (FRS)
The FRS was calculated using participants' sex, age, total cholesterol, high-density lipoprotein cholesterol, systolic blood pressure, and smoking (18). The FRS is based on data from a sample of the Framingham Heart and Offspring studies (19). Participants with a probability of < 10% were classified as being at “low CHD risk,” while those with a probability of ≥ 10% were classified as being at “intermediate/high CHD risk.” The clinician who calculated the FRS was unaware of the final clinical diagnoses and NAFPD/NAFLD prevalence.
STATISTICAL ANALYSIS
Continuous variables are presented as means ± standard deviation (SD), and categorical data as percentages. Comparisons between the four NAFPD severity groups were performed using analyses of variance for continuous variables and the Kruskal-Wallis test for categorical data. Spearman correlation coefficients (ρ) were calculated to determine the correlation between US-determined NAFPD severity and CHD risk score, with ρ value interpreted as follows: ≤ 0.20, no; 0.21–0.40, weak; 0.41–0.60, moderate; 0.61–0.80, high; and ≥ 0.81, very high correlation (20).
In order to assess the independent association between US-determined NAFPD and FRS, multivariate-adjusted logistic regression models were used. We used four models with increasing degrees of adjustment to account for potential confounding factors at baseline. Age, sex, smoking status, alcohol consumption, BMI, and metabolic syndrome were assumed to be potential confounding factors because each could independently increase the risk of CHD. Thus, we adjusted these factors and divided them into four categories: unchangeable demographic factors (age and sex), life habit factors (smoking and alcohol consumption), body habitus (BMI), and metabolic syndrome. The odds ratios (ORs) and 95% confidence intervals (CIs) were calculated for each model.
In order to evaluate the predictive performance of 1) US-determined NAFPD severity, 2) US-determined NAFLD severity, and 3) US-determined NAFPD severity plus US-determined NAFLD severity for patients with intermediate or high CHD risk, receiver operating characteristic (ROC) curves were performed and then, cut-off values, sensitivity, specificity, and areas under the ROC curves (AUC) with 95% CIs were calculated. Optimal cut-off values were defined as the point at which the value of “sensitivity+specificity-1” was maximum (Youden's index) (21). The AUCs from ROC curve were compared by DeLong's method (22). To assess the reliability of the NAFLD grading system, inter-observer reliabilities were calculated using weighted-kappa (κ) statistics and classified as follows: 0–0.20, poor; 0.21–0.40, fair; 0.41–0.60, moderate; 0.61–0.80, good; and 0.81–1.00, excellent agreement. Statistical analyses were performed by one statistician using statistical SPSS version 18.0 (SPSS Inc., Chicago, IL, USA) and MedCalc version 15.0 (MedCalc Software, Mariakerke, Belgium). A p-value < 0.05 was considered statistically significant for all tests.
RESULTS
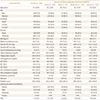
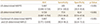
The inter-observer agreement between the two reviewers for the US-determined NAFPD (κ = 0.893, 95% CI, 0.801–0.985) and US-determined NAFLD grading system (κ = 0.949, 95% CI, 0.932–0.962) was excellent. The baseline characteristics of the overall study participants and participants with different degrees of US-determined NAFPD are shown in Table 1.
The mean ± SD age of study participants was 31.3 years (range, 19–40 years). A total of 310 men and 234 women were included. Among the 544 forming the study group, US revealed mild NAFPD in 94 (17.3%), moderate NAFPD in 133 (24.5%), and severe NAFPD in 114 (21.0%) patients. Compared to participants without NAFPD, patients with NAFPD were more likely to be men and smokers; to have a higher BMI, WC and blood pressure; and to have higher adverse health metabolic markers (p < 0.001). The overall mean FRS was 7.5, with the FRS being higher among participants with NAFPD than those without NAFPD (p < 0.001).
US-determined NAFPD severity was positively correlated to the FRS (r = 0.624, p < 0.001). Among the 203 patients without NAFPD, only 16.7% (34/203) were considered at intermediate/ high risk for CHD, whereas more than a quarter [27.7% (26/94)] of those with mild NAFPD, nearly two-fifths [39.1% (52/133)] of those with moderate NAFPD, and nearly one-half [50.9% (58/114)] of those with severe NAFPD were identified as being at intermediate/high CHD risk. US-determined NAFLD was also positively correlated to the FRS (r = 0.648, p < 0.001). US-determined NAFPD and US-determined NAFLD both had a very high correlation to the FRS (r = 0.860, p < 0.001).
In the adjusted multiple logistic regression model, participants with NAFPD had a significantly higher OR of having intermediate/high CHD risk than those without NAFPD. ORs also increased with increasing severity of NAFPD. When we adjusted for age, sex, smoking, alcohol consumption, BMI, and metabolic syndrome, the association between NAFPD and intermediate/high CHD risk was attenuated, but was still significant (Table 2).
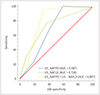
Table 3 presents the AUC values of US-determined NAFPD and US-determined NAFLD for the determination of individuals with intermediate/high CHD risk. The AUCs of US-determined NAFPD and US-determined NAFLD were 0.687 (95% CI: 0.646–0.726) and 0.726 (0.687–0.764), respectively. There was no significant difference between US-determined NAFPD severity and US-determined NAFLD severity in terms of identifying intermediate/high CHD risk (p = 0.17). The combination of US-determined NAFPD severity and US-determined NAFLD severity significantly improved the predictive performance of US-determined severity for intermediate/high CHD risk to 0.807, compared to the predictive value of US-determined NAFPD severity or US-determined NAFPD severity alone (p < 0.001 for both) (Fig. 3).
DISCUSSION
We found out that the US-determined NAFPD severity can be used as an independent factor for intermediate/high risk of CHD. Our result showed that FRS increases in direct proportion to US-determined NAFPD severity. Additionally, US-determined NAFPD severity provides complementary information to US-determined NAFLD, improving the accuracy of identifying an intermediate/high CHD risk compared to using either measure of severity alone.
NAFPD is the term used for an abnormal accumulation of ectopic pancreatic fat (6). Although the relationship between the presence of NAFPD and CHD risk has not been investigated, NAFPD has previously been known to be associated with an increased prevalence and incidence of metabolic comorbidities (613). A meta-analysis of 24 studies demonstrated that NAFLD is significantly associated with a 67% higher risk of hypertension, 108% higher risk of diabetes mellitus (DM) and 137% higher risk of metabolic syndrome (13). In particular, it is well-established that the pathogenesis of type 2 DM involves insulin resistance and β cell dysfunction. Although there is conflicting evidence regarding the association between pancreatic fat accumulation and β cell function, some studies have reported a significant association between pancreatic fat and β cell dysfunction (2324). Inversely, a decrease in pancreatic and hepatic fat content to ‘lean’ levels after bariatric surgery is associated with a decrease in insulin resistance, restoration of insulin secretion and reversal of type 2 DM (2526). Therefore, β cell dysfunction plays an important role in glucose intolerance and insulin resistance, which are associated with increased cardiovascular disease risk accompanied by the presence of an oxidative stress and endothelial injury at the coronary arteries (2728). According to previous studies that have investigated the relationship between β cell dysfunction and cardiovascular disease risk, NAFPD may increase the risk of the CHD, as we reported in our study.
Although age is not a risk factor of pancreatic steatosis, prevalence of pancreatic steatosis does increase with advancing age (293031). However, the relationship between mean pancreatic echogenicity and age is not directly proportional, and it has been reported that a sharp decline in the mean pancreatic echogenicity occurs after the age of 40 years. Additionally, fatty change (also known as a soft pancreas) is the main factor contributing to the decline in pancreatic echogenicity after the age of 40 years (14). To control the effects of age on measured hyperechoicity of the pancreas, we only included individuals between the age of 18 and 40 years.
In our study, we identified a highly positive correlation between NAFPD severity and NAFLD severity (correlation coefficient > 0.8). This finding is supported by a histopathological study (32), in which pancreatic fat and hepatic fat were significantly correlated with both individuals with NAFPD and NAFLD. Additionally, FL was reported as a predictor of hyperechoicity of the pancreas, on an endoscopic US (29). However, simple anthropometric measures, such as BMI and WC, were not associated with the NAFPD severity in our study. This suggests BMI and WC alone may not be reliable measures for NAFPD. While obese patients may frequently have increased ectopic fat depositions, it may not always be a consequence of weight gain. We hypothesized that obese individuals are likely to have different metabolic phenotypes including ‘obese but metabolically healthy obese’ individuals who have metabolic profiles similar to those of lean individuals (i.e., high insulin sensitivity, high levels of high density lipoprotein, and low triglycerides). Such ‘metabolically healthy’ profiles can protect or lower the risk of these individuals of developing metabolic disorders, despite being obese. Thus, the absence of NAFPD may be especially useful to characterize a low-risk phenotype of individuals who are deemed to be at high risk for developing metabolic disorders based on their BMI and WC. In the future, the absence of NAFPD may serve as a potential screening tool to prevent low risk obese individuals from undergoing futile bariatric surgery or from consuming therapeutic medications for weight loss.
MRI of the pancreas is considered as the best imaging technique for the diagnosis of NAFPD. Various MRI-based methods are available to measure pancreatic fat. The three most common methods are in/opposed-phase, Dixon method and the spectral-spatial excitation techniques (33). Additionally, CT, with or without contrast, can be used to for the diagnosis of NAFPD. The density of a steatotic pancreas is similar to that of adipose tissue on CT scan. Therefore, the amount of pancreatic steatosis on CT can be measured using Hounsfield units, using the spleen as a reference, with a steatotic pancreas being hypodense on CT images, with a negative Hounsfield unit, compared to the spleen (6). However, transabdominal US is the most widely and commonly used imaging technique for the evaluation of NAFPD due to the cost- and time-effectiveness (91011). On US examination, the echogenicity of the pancreas has been traditionally compared to that of the liver echogenicity (3031). However, the reliability of this comparison has been brought into question as the liver is metabolically very active and, therefore, its echogenicity exhibits high variance (3435). To address this issue, Lee et al. (11) proposed basing the diagnosis of NAFPD on a comparison of the echogenicity of the pancreas over that of the kidney during US, which provides a more accurate measure of fat in the pancreas than when using the liver for comparison.
Transabdominal US has some limitations, including difficulty in clearly visualizing the pancreas in obese patients, as well as the appearance of pancreatic fibrosis as hyperechogenic. To avoid the latter problem, kidneys or liver can be used as a reference point; a higher pancreatic echogenicity compared to liver or kidney indicates pancreatic steatosis, while an echogenicity similar to retroperitoneal fat suggests the highest amount of pancreatic fat deposition (11).
Our study has several limitations which need to be acknowledged. First, the retrospective study design may have led to inevitable biases, including selection or misclassification bias. Second, although US images were reviewed in PACS rather than in radiology reports, interobserver variability could exist because the US images were examined by various radiologists. To overcome this limitation interobserver reliability was evaluated and excellent agreement was shown. Third, we did not perform abdominal MRI, which is regarded as the gold standard for diagnosing pancreatic steatosis, and our US classification of NAFPD was not compared to a MRI-based classification. Additionally, we did not perform pancreatic function tests to exclude the potential early stages of chronic pancreatitis. Fourth, we did not take into consideration of variations in metabolic profile over time, with only one measurement obtained for each participant. Fifth, it is quite difficult to precisely define either non-alcoholic or alcoholic patients because quantifying alcohol consumption is subjective and alcohol ingestion fluctuates over time. To overcome this problem, we excluded patients with ambiguous diagnosis. Finally, our study was conducted in asymptomatic Korean men and women attending regular health screening examinations; thus, our findings may not be generalizable to other populations, particularly other age or race/ethnicity groups. However, our study is meaningful in that it is the first to study the relationship between US-determined NAFPD severity and CHD and to evaluate the predictive performance of US-determined NAFPD for determining intermediate/high CHD risk.
In conclusion, we report a positive association between US-determined NAFPD severity and the prevalence of intermediate/high CHD risk in healthy young adults. More importantly, US-determined NAFPD severity combined with US-determined NAFLD severity may be useful for predicting which patients may have a higher risk of CHD.

 XML Download