

 PDF
PDF ePub
ePub Citation
 Print
Print


INTRODUCTION
Metabolic surgery has been considered as an option to treat obese individuals with uncontrolled type 2 diabetes (T2D) [123]. Both Roux-en-Y gastric bypass (RYGB) and sleeve gastrectomy (SG) yield significant metabolic outcomes in patients with body mass index (BMI) >35 kg/m2, resulting in T2D remission rates of 50%–70% [456]. Metabolic surgery for patients with BMI of 25–35 kg/m2 also led to T2D resolution [78], and it has been shown to be more effective than medication treatment with respect to T2D remission [236]; however, metabolic surgery is more effective in patients with BMI >35 kg/m2. Therefore, the selection of candidates for metabolic surgery with highly expected T2D remission rates is crucial, especially for patients with BMI <35 kg/m2 that are considering metabolic surgery for uncontrolled T2D.
Several international and government organizations have recently suggested expanding the indications for metabolic surgery to include patients with uncontrolled T2D patients with BMIs as low as 30 kg/m2 (27.5 kg/m2 for the Asians) [9101112]. However, current guidelines do not provide selection criteria for patients who have a higher chance of T2D remission after metabolic surgery. While a few scoring systems [131415] for predicting T2D prognosis after metabolic surgery have been developed and mainly validated on the basis of patients with mean BMI >35 kg/m2 [71416], considerable disagreement among models was disclosed [1718]. These reports evoke concerns about applying current prediction models to select metabolic surgery candidates based on expected T2D remission rate. However, there are few reports on the distribution of metabolic surgery candidates' scores calculated by existing scoring systems and consistency in prognosis prediction in individual patients using different scoring systems.
This study aimed (1) to determine scoring systems for predicting T2D remission rates after RYGB and SG that have been externally validated, and (2) to apply these scoring systems to potential metabolic surgery candidates diagnosed with T2D within a year, and compare expected remission rates calculated by each scoring system.
METHODS
Study population
We retrospectively reviewed the medical records of patients with T2D in the prospectively collected database initiated in 2011 in Korea University Anam Hospital. The inclusion criteria were diagnosis of T2D and outpatient clinic visit in our hospital between 2011 and 2013 and T2D duration of less than 1 year. The exclusion criteria were (1) type 1 diabetes; (2) age below 19 years; (3) pregnancy or breastfeeding; (4) glucocorticoid use; (5) previous surgery of the stomach, bile duct, pancreas, or large intestine (except hemorrhoidectomy, herniorrhaphy, and appendectomy); (6) transplantation history; (7) diabetes due to pancreatic lesions such as chronic pancreatitis or pancreatic cancer; and (8) diagnosis of cancer except basal cell carcinoma of the skin and carcinoma in situ (patients with disease-free survival longer than 5 years were included). All procedures performed in studies involving human participants were in accordance with the ethical standards of the institutional and/or national research committee. The Institutional Review Board of Korea University Anam Hospital approved (IRB No. 2019AN0058). Written consents were waived by the committee.
Scoring systems for prediction of diabetes remission after metabolic surgery
To identify scoring systems developed for prediction of T2D prognosis after metabolic surgery, we analyzed published scientific literature with a structured search strategy. We used MEDLINE and Embase database, and search terms were adapted according to the syntax of each specific database. Main keywords used for the search were “bariatric surgery,” “metabolic surgery,” “Roux-en-Y gastric bypass,” “sleeve gastrectomy,” and “type 2 diabetes.” Scoring systems were selected for this study if (1) they tried to predict the prognosis of T2D after RYGB or SG (other surgical techniques were not considered), (2) they presented an organized protocol (e.g., scoring system or nomogram) including any quantified measures, and (3) they were validated externally.
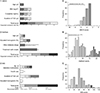
We adopted 3 systems based on the search results: ABCD score [1317], DiaRem score [14], and individualized metabolic surgery (IMS) score [15]. Patients with higher ABCD scores were predicted to have a higher probability of T2D remission after surgery. Patients with lower DiaRem scores were predicted to have a higher probability of T2D remission after surgery. IMS score classified diabetes severity into mild, moderate, and severe, and patients with mild diabetes were predicted to have a higher probability of T2D remission after metabolic surgery. Each scoring system is presented in Fig. 1.
Outcome assessments
Based on the calculated scores for each patient, we compared (1) the probability of T2D remission according to the scoring systems, (2) difference in patient characteristics by categories of score, (3) patient characteristics between groups wherein postoperative T2D remission was highly expected (expected remission rate > 67% based on ABCD and DiaRem score) were compared, and (4) test agreements of scoring systems in all study populations and patients with BMI of 27.5–32.5 kg/m2.
Statistical methods
Data were presented as percentages for categorical variables and means with standard deviations (SDs) for continuous variables. Patient groups by IMS scores (mild, moderate, or severe) were compared using 1-way analysis of variance with Bonferroni post hoc test. Cohen kappa statistic was used to assess the level of agreement between the ABCD and DiaRem systems in all participants or those with BMI of 27.5–32.5 kg/m2. The a priori level of statistical significance was set at P-value < 0.05 for all analyses; these analyses were 2-tailed and performed using Stata version 12.0 (StataCorp LP, College Station, TX, USA).
RESULTS
Patient characteristics
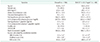
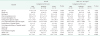
A total of 186 patients with T2D duration of less than 1 year were included in the analysis (Table 1). Overall, the mean ABCD and DiaRem scores were 4.1 (SD, 1.2) and 9.9 (SD, 5.6), which indicate T2D remission rates of 39.8% and 43.5%, respectively [17]. The mean IMS score was 45.6 (SD, 23.6), which indicates moderate severity. Compared to all study populations, patients with BMI between 27.5 and 32.5 kg/m2 showed higher ABCD and IMS scores and lower DiaRem score on average. Distribution of ABCD, DiaRem, and IMS scores is shown in Fig. 1A, B, and C, respectively.
Patient characteristics by categories of ABCD and DiaRem scores
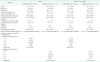
Table 2 shows outcomes of patients assigned into 5 categories based on calculated ABCD and DiaRem scores. Patients with higher ABCD scores were younger on average while there was no consistent tendency between DiaRem score and age. The mean BMI gradually decreased with decreasing ABCD score but showed no consistent tendency with DiaRem scores. Patients with higher DiaRem scores showed higher glycated hemoglobin level, and those with lower ABCD scores showed lower C-peptide level.
Comparison between patients with high expected diabetes remission rate
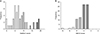
Outcomes of patients whose scores indicated highly expected diabetes remission (ABCD score, 10–5; DiaRem score, 0–7) are described in Table 3. In patients whose ABCD score was between 10 and 5, Cohen kappa showed slight concordance between 2 scoring systems (0.07; SE, 0.05). Patients whose DiaRem score was between 0 and 7 demonstrated slight concordance between the 2 scoring systems (0.003; SE, 0.007). Kappa measures represented poor to slight agreement in the analysis of patients with BMI 27.5–32.5 kg/m2 (0.08 and −0.02; SE, 0.02). Fig. 2 shows distribution of DiaRem (Fig. 2A) and ABCD (Fig. 2B) scores, among patients in whom diabetes remission was highly expected according to the other system.
Comparison by categories of IMS scoring system
IMS scores were calculated, and patients were divided into 3 categories (Table 4). The mean DiaRem scores of the mild (6.7 ± 6.1), moderate (10.3 ± 5.2), and severe (16.2 ± 5.8) groups were significantly different from each other. Consistently, the analysis of patients with BMI between 27.5 and 32.5 kg/m2 showed that the DiaRem score increased as IMS score moved from mild to severe. Post hoc tests were not performed for the subgroup because the severe group had less than 2 cases. The ABCD score showed no association with IMS score.
DISCUSSION
The new guidelines from American Diabetes Association recommends metabolic surgery to treat T2D in surgical candidates with BMI ≥40 kg/m2 (BMI ≥37.5 kg/m2 in the Asian-American population), regardless of the glycemic control level or complexity of glucose-lowering regimens, and in adults with BMI of 35.0–39.9 kg/m2 (32.5–37.4 kg/m2 in the Asian-American population) when hyperglycemia is inadequately controlled despite lifestyle and optimal medical therapy [19]. Moreover, adults with T2D and BMI of 30.0–34.9 kg/m2 (27.5–32.4 kg/m2 in the Asian-American population) should consider metabolic surgery if hyperglycemia is inadequately controlled despite optimal medical control by either oral and injectable medications [19]. Even though the remission rate is not confirmed yet and unsuccessful outcome after metabolic surgeries needs to be considered, selection criteria of candidates undergoing metabolic surgery in current metabolic surgery guidelines are not mentioned [192021]. Prediction of patients with higher chance of T2D remission after surgery is necessary, and some scoring systems are required to help select and consult such patients in clinical practice.
Existing scoring systems are not sufficiently validated in various ethnicities and BMI ranges. The ABCD score [13] was developed by analysis of Asian populations with BMI of 36.5 kg/m2, while the DiaRem [14] and IMS scores [15] were developed based on American populations with mean BMI >45 kg/m2. This difference must be thoroughly assessed since the Asian population is more likely to develop T2D in younger age with lower BMI compared to the Caucasian population [2223]. Moreover, a preceding study showed that only 25% of non-obese patients with T2D (mean BMI, 26.9 kg/m2) had remission after surgery while patients with higher BMI (mean BMI, 49.5 kg/m2) showed a remission of 79% [24]. This result implies the impact of baseline BMI on T2D remission rate, and evaluation of these systems on nonobese metabolic surgery candidates is imperative.
All patients obtained 3 out of 3 points for T2D duration since they had T2D for less than 1 year. Most patients got poor score for age since the cutoff was 40 years while the mean age of patients was 54.8 years. Therefore, the ABCD score was particularly dependent on C-peptide level and BMI. Besides the 3 points for T2D duration, patients obtained 1.3 out of 7 points on average. The ABCD score was adjusted downward and was not useful in stratifying patients according to the expected remission rates.
The distribution of DiaRem score was wider than that of ABCD score. The impact of insulin treatment on DiaRem score (10 of 22 points) was the largest among the 4 factors. According to the guidelines for T2D in Korea [25], a glycated hemoglobin level >9.0% during diagnosis is an indication for insulin treatment and oral hypoglycemic agent combination therapy. Thus, a glycated hemoglobin level >9.0% directly affects the DiaRem score with respect to insulin treatment and use of combination drugs, as well as glycated hemoglobin level itself. Glycated hemoglobin level showed high correlation to the DiaRem score (Table 2) and contributed to the DiaRem score's wide distribution.
According to previous studies, the DiaRem score was useful to predict T2D remission in those with a low DiaRem score but more limited in its predictive power in those with a high DiaRem score [1726] while the ABCD score was relatively more accurate throughout a wider range [17]. Accordingly, when each scoring system was applied to patients with T2D (BMI, 35.7 ± 7.8 kg/m2), the distribution of high ABCD and low DiaRem scores were similar [17]. However, no correlation between the ABCD and DiaRem scores was noted in the whole range, and disagreement between these scoring systems was also significant when they were applied to participants with highly expected T2D remission (Table 3, Fig. 2). These inconsistencies warrant further analysis of an existing scoring system in different ethnic groups and BMI ranges.
The IMS score categorizes patients into 3 stages of diabetes severity and T2D remission rate is expected to be higher in patients with mild severity [15]. We observed a dose-response association between mean DiaRem score and IMS score stage, while there was no significant difference in ABCD scores between each stage (Table 4). Both DiaRem and IMS scoring systems were developed in Caucasian populations with class 3 obesity (mean BMI, 49.4 and 46.4 kg/m2, respectively), while the ABCD scoring system was first introduced in Asian populations. This explains the disagreement between results in different ethnicities and BMI ranges and indicates insufficient evidence to utilize existing scoring systems in an unverified range of BMI or ethnic group.
The study had some limitations. First, this study was conducted with a cohort of patients who had T2D for less than 1 year, not with actual metabolic surgery candidates. Considering that most previous studies were performed on patients with T2D who were expected to undergo metabolic surgeries, there might be some inconsistencies derived from different cohort characteristics. Nevertheless, scoring systems for predicting metabolic surgery need to be applied to not only metabolic surgery candidates but also patients with T2D considering the expected remission rate in decision making. Second, this study could not determine the scoring system with highest accuracy for predicting T2D remission rate due to lack of postoperative data. Still, discordance between the scoring systems applied to potential metabolic surgery candidates implies inadequacies of selecting candidates for surgery by current scoring systems. Third, there were possible unknown confounders due to its retrospective and nonrandomized design. Fourth, the study population included Korean adults who have limited diversity in ethnicity, and the patient characteristics might have been biased. Lastly, expected remission rates were not verified in diverse groups, and we adopted a remission rate calculated in a cohort of 245 Asian patients with T2D who underwent metabolic surgery [16]. We evaluate the expected remission rates observed in a group of patients with the same ethnicity and BMI range to improve accuracy.
We observed considerable discordance between T2D remission rate predicted by ABCD and DiaRem scores in patients with T2D duration of less than a year. The result was consistent in the subgroup with BMI of 27.5 to 32.5 kg/m2. The IMS score showed a dose-response association with the DiaRem score, which was developed in study populations with the same ethnicity and BMI range, but there was no significant association between IMS and ABCD scores, which was developed in different ethnicities with different degrees of obesity.

 XML Download