

 PDF
PDF ePub
ePub Citation
 Print
Print


Introduction
Gastroesophageal reflux disease (GERD) is one of the most common gastrointestinal disorders.[1] The clinical symptoms of GERD are defined as experiencing heartburn and acid regurgitation at least once a week. The prevalence of GERD among the adult population in East Asia is 2.5–7.8%.[1] Peptic ulcer disease is another gastrointestinal disorder known by its high prevalence and chronic nature.[23]
Proton-pump inhibitors (PPIs) reduce gastric acid secretion by inhibiting H+/K+-ATPase of parietal cells.[4] Since their approval in 1998, PPIs have been widely used to treat acid-related diseases such as GERD and peptic ulcer. Although PPIs have been proved to be safe and effective, quite a large number of patients failed to respond to the treatment.
The use of PPIs poses some limitations. Firstly, PPIs cause nocturnal acid breakthrough even in patients who take PPIs with long half-life or twice daily.[5] Secondly, PPIs exhibit delayed onset time because they require conversion to the active form.[6] PPIs undergo molecular rearrangement under the acidic condition,[7] and the binding of active form with the receptor is irreversible. For this reason, taking PPIs before a meal is recommended, which may result in poor compliance of the patient.[8] Thirdly, there are many cases of rebound acid secretion after cessation of PPIs. While rebound acid secretion can occur after withdrawal of any acid-suppressive drugs, PPIs induce more extended rebound period than antacids or H2 antagonists.[9] In order to overcome the limitations of conventional PPIs, the development of new types of a drug for the treatment of acid-related diseases is expected.[10]
Potassium-competitive acid blockers (P-CABs) are one of the novel drugs developed for the suppression of gastric acid secretion. P-CAB inhibits H+/K+-ATPase by binding to the potassium-binding site. P-CABs have a fast onset of action because they bind to both active and inactive forms of H+/K+-ATPase, indicating that they do not need acid activation. Owing to these advantages, P-CABs shows faster gastric pH inhibition and have the potential to show a clear pharmacokinetic (PK)-pharmacodynamic (PD) relationship than PPIs.[41011]
Tegoprazan is a novel P-CAB that has high selectivity towards H+/K+-ATPase (IC50 of 0.47 µM in ion-leaky vesicles). In a phase I, single ascending dose study, tegoprazan reached a mean Tmax at 0.5 to 1.5 h after dosing, and the mean elimination half-life (t1/2) was 3.65 to 5.39 h. Cmax and AUClast exhibited a dose-dependent increase. Tegoprazan was expected to be metabolized by CYP3A in humans and produce its major demethylated metabolite M1.[12] In order to improve the productivity and stability of tegoprazan, conducting new formulation studies were needed.
The objective of the present study was to compare PK between the two formulations of tegoprazan film-coated 100 mg tablets in healthy Korean male subjects.
Go to : 
Method
Subjects and Study design
This study was approved by Korea Ministry of Food and Drug Safety and the Institutional Review Board of Chonbuk National University Hospital, Jeonju, Republic of Korea. This study was conducted at Chonbuk National University Hospital following the ethical principles of the Declaration of Helsinki and rules of Korean Good Clinical Practices. Written informed consent from each participant was obtained prior to being enrolled.
Healthy Korean male volunteers, aged 19 to 45 years with weight >50 kg, were enrolled in this randomized, single oral dose, 2-sequence, 2-period, crossover study. Their health status was determined based on medical history within 3 years, physical examination including vital sign measurements, 12-lead electrocardiogram (ECG), serology and routine clinical laboratory testing (including biochemistry, hematology, and urinalysis) conducted within 3 weeks before the initiation of the study. The subjects were excluded if they had a history of symptomatic gastroesophageal reflux disease, erosive esophagitis, duodenal ulcer, gastric ulcer, Barrett's esophagus, or Zollinger-Ellison syndrome.
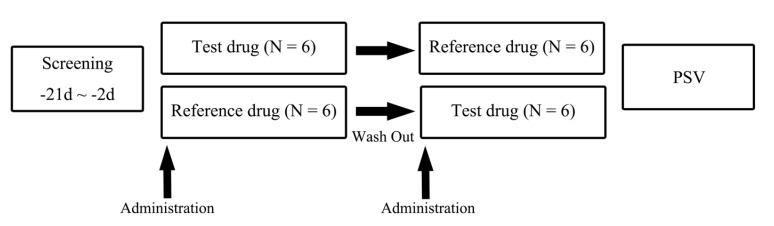
Twelve eligible subjects were randomly assigned to two sequence groups. Subjects in one sequence group were given the test formulation in period 1, followed by the reference formulation in period 2, and the other sequence group was given the reference formulation in period 1, followed by the test formulation in period 2 (Fig. 1). There was a washout period of 7-10 days between the successive treatment periods, and the duration was determined considering the reported half-life of tegoprazan (3.84–6.46 h).[12]
Determination of plasma concentration
Blood samples for PK evaluation were obtained at pre-dose and 0.25, 0.5 1, 1.5, 2, 3, 4, 6, 8, 12, 24, and 48 h post-dose. At each blood sampling point, 8 mL of blood was collected in heparinized tubes and centrifuged for 10 min at 3000 rpm. After centrifugation, plasma was separated and stored at −70℃ until analysis.
The plasma concentrations of tegoprazan and M1 were determined by ultra performance liquid chromatography (UPLC) coupled with a tandem mass spectrometry method. Plasma samples were centrifuged at 13,000 rpm for 3 min. One hundred µL of plasma was mixed with 10 µL of internal standard (IS; tegoprazan 2 ug/mL in 50% methanol), then mixed at 1,500 rpm using Mixmate and centrifuged at 4,000 rpm for 1 min. It was mixed with methanol 400 µL then mixed at 1,500 rpm using Mixmate and centrifuged at 4,000 rpm for 1 min again. One hundred µL of upper layer solution added 300 µL of a mixture of methanol : DW : formic acid (30 : 70 : 0.1) centrifuged at 4,000 rpm for 1 min twice. Then 0.5 µL mixture was injected onto the UPLC–MS/MS. Linear calibration curves for tegoprazan were established from 20 to 10,000 ng/mL (r2 ≥ 0.9995). Within-run and between-run precision and accuracy were determined by five repeated analyses of each quality control sample on day 1. Inter-day precision and accuracy were determined by repeated analyses on four consecutive days using 20, 60, 5000, and 7500 ng/mL of tegoprazan. Within-run and between-run precision (relative standard deviation) for tegoprazan were 1.3–4.1% and 2.3–8.4 %, respectively. The corresponding values for M1 were 0.9–5.4 % and 3.2–10.4 %, respectively. Within-run and between-run accuracy (deviation of the mean from theoretical) for tegoprazan were −0.6–−10.0 %, and −1.9–2.0 %, respectively. The corresponding values for M1 were −4.0–14.0 % and −2.1–6.0 %, respectively.
PK evaluation
The PK parameters were determined using a non-compartmental method implemented in Phoenix® WinNonlin® 6.2 (Certara, L.P., St. Louis, MO, USA). The maximum plasma concentration (Cmax) and time to reach Cmax (Tmax) were determined directly from the observed individual plasma concentration-time profiles. Terminal elimination half-life (t1/2) was calculated as the natural logarithm of 2 divided by λz, which is the terminal elimination rate constant estimated in the linear portion of the decline of natural logarithmic-transformed individual plasma concentrations. The area under the concentration-time curve (AUC) from dosing to the last quantifiable concentration (AUClast) was calculated using the linear trapezoidal method, and AUC from dosing to infinity (AUCinf) was calculated as the sum of AUClast and Ct/λz. CL/F was defined as an apparent total clearance of the drug from plasma after oral administration, and Vd/F was defined as an apparent volume of distribution after non-intravenous administration.
Safety/tolerability evaluation
The safety and tolerability of all subjects, who administered at least one time of investigational products were included in the safety analysis, based on the occurrence of adverse events (AEs), vital signs, clinical laboratory evaluations, ECG, and physical examination throughout the study period.
All adverse events were summarized by subjects, percentage, and frequency of occurrence and presented using descriptive statistics. Adverse events were coded with system organ classes and preferred terms. Laboratory results, vital signs, and ECG findings were reviewed for each subject and clinically significant results were summarized by treatment arms and time points using descriptive statistics. Findings from the physical examination were also reviewed in order to examine the existence of clinical significance or any association with the administration of the investigational products.
Statistical analysis
All statistical analyses were performed using SAS 9.4 (SAS Institute, Cary, NC, USA), and P-values ≤0.05 were considered statistically significant. Descriptive statistics were used to summarize the demographics and PK parameters. To compare the PK parameters, point estimates and 90% CIs of the geometric least squares mean ratio (GMR) (test treatment/reference treatment) of the log-transformed Cmax and AUC0-last were also presented. The demographic characteristics were compared between the two sequence groups using independent t-tests. Bioequivalence was assessed if 90% CI of GMR for Cmax and AUC0-last fell within the conventional bioequivalence range of 0.8–1.25.
Go to :
Results
Subjects
All 12 subjects who were enrolled successfully completed the study. The mean ± standard deviation of age, height, body weight and BMI of the subjects were 23.9 ± 1.3 years, 173.1 ± 7.6 cm, 68.4 ± 8.2 kg, and 22.8 ± 2.2, respectively. There were no clinically relevant differences between the two sequences in any of the demographic characteristics (Table 1).
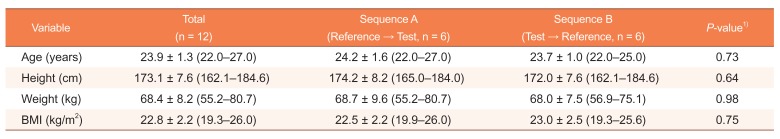
Table 1
Demographics of study participants administered test and reference formulations of 100 mg tegoprazan tablets
| Variable | Total (n = 12) | Sequence A (Reference → Test, n = 6) | Sequence B (Test → Reference, n = 6) | P-value1) |
|---|---|---|---|---|
| Age (years) | 23.9 ± 1.3 (22.0–27.0) | 24.2 ± 1.6 (22.0–27.0) | 23.7 ± 1.0 (22.0–25.0) | 0.73 |
| Height (cm) | 173.1 ± 7.6 (162.1–184.6) | 174.2 ± 8.2 (165.0–184.0) | 172.0 ± 7.6 (162.1–184.6) | 0.64 |
| Weight (kg) | 68.4 ± 8.2 (55.2–80.7) | 68.7 ± 9.6 (55.2–80.7) | 68.0 ± 7.5 (56.9–75.1) | 0.98 |
| BMI (kg/m2) | 22.8 ± 2.2 (19.3–26.0) | 22.5 ± 2.2 (19.9–26.0) | 23.0 ± 2.5 (19.3–25.6) | 0.75 |
![]()
Pharmacokinetics
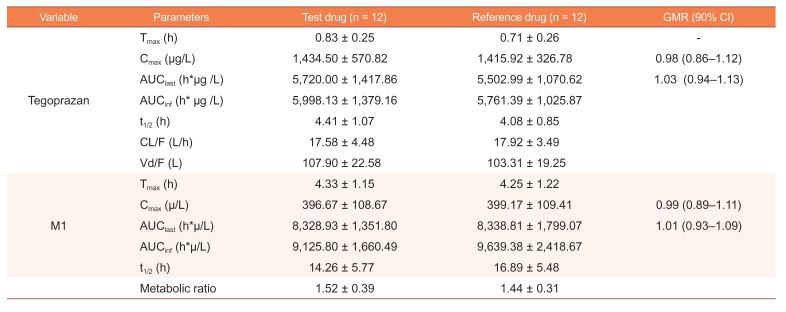
The mean plasma tegoprazan concentration-time profiles of the two formulations after a single oral dose were comparable, including both absorption and disposition phases (Fig. 2). Both formulations were absorbed rapidly with a median Tmax of 0.83 and 0.71 h for the test and reference drugs, respectively. The Cmax (mean ± SD) values for the test and reference drugs were 1,434.50 ± 570.82 and 1,415.92 ± 326.78 µg/L, respectively, and the corresponding values for AUClast were 5720.00 ± 1417.86 and 5,502.99 ± 1,070.62 µg*h/L, respectively. The GMR (90% CIs) values of the test drug to the reference drug for Cmax and AUClast of tegoprazan were 0.98 (0.86–1.12) and 1.03 (0.94–1.13), respectively (Table 2).
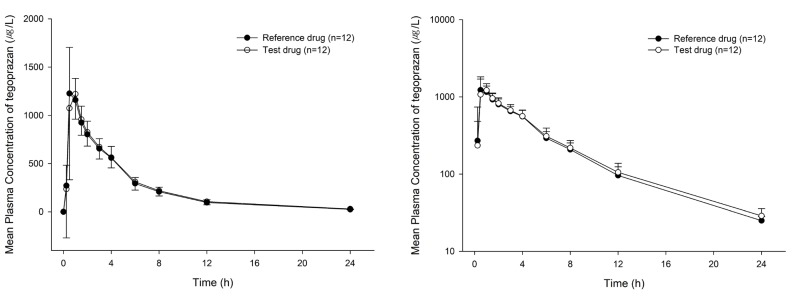 | Figure 2Mean plasma tegoprazan concentration-time profiles after a single oral dose of test or reference formulation of 100 mg tegoprazan tablet (left: linear scale, right: semi-log scale).
|
Table 2
Pharmacokinetic parameters for test and reference formulations of 100 mg tegoprazan tablets (n = 12)
![]()
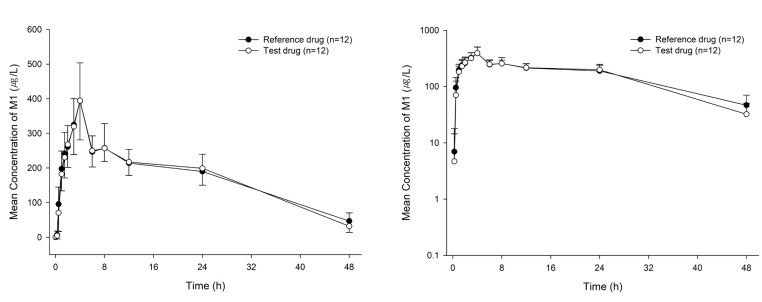
The mean plasma M1 concentration-time curves are shown in Figure 3. The PK parameters of M1 were comparable to each drug. The Cmax (mean ± SD) values for the test and reference drugs were 396.67 ± 108.67 and 399.17 ± 109.41 µg/L respectively, and the corresponding values for AUClast were 8,328.93 ± 1,351.80 and 8,338.81 ± 1,799.07 µg*h/L, respectively. The GMR (90% CIs) values of the test drug to the reference drug for Cmax and AUClast of M1 were 0.99 (0.89–1.11) and 1.01 (0.93–1.09), respectively (Table 2).
Based on the Korea MFDS guidelines, the 90% CIs for the relevant PK parameters such as Cmax and AUClast of both tegoprazan and M1 were within an acceptable range of 0.80–1.25, indicating PK bioequivalence between both formulations.
Safety and tolerability
Subjects who administered at least one dose of the investigational products were included in the tolerability assessment. Both formulations of tegoprazan were well tolerated in every subject and no serious AEs were reported. White blood cells were detected from urine test in one subject, but the severity was mild, and the relationship with the investigational product was evaluated as unrelated. There were no other AEs throughout the clinical trial period. Clinically significant results were not observed by physical examination blood and urine tests, ECG tests, and vital signs.
Go to :
Discussion
The object of the study was to compare the PK parameters and assess the bioequivalence of two formulations of tegoprazan. A new formulation has been developed and manufactured for improved productivity and stability compared to the conventional formulation.
This study was a randomized, single oral dose, 2-sequence, 2-period, crossover design study, which is generally implemented for bioequivalence study. A total 12 of sample size achieved 80% power at a significance level of α=0.05, when the percentage of the intra-individual coefficient of variation (CV%) of Cmax and AUClast of tegoprazan was 17.46 and 12.57%, respectively.[13]
The blood samples were obtained up to 48h after dosing. With regard to the percentage of extrapolated AUC (AUCextra %), which is the marker of sufficient duration of evaluation, the AUCextra of test and reference drugs was 4.97 and 4.74%, respectively. These results imply that the sampling time points were appropriately selected to characterize the absorption and elimination phases of tegoprazan.
The washout period was 7–10 days. As washout period is usually determined as some multiple of the half-life of the drug and considering 3–6 h of the reported terminal half-life of tegoprazan,[12] 7–10 days were considered to be sufficient for the elimination of first administration prior to the second treatment period.[11]
The Cmax values (mean ± SD) for the test and reference drugs were 1,434.50 ± 570.82 and 1,415.92 ± 326.78 µg/mL, respectively, and the corresponding values of AUClast for the test and reference drugs were 5,720.00 ± 1,417.86 and 5,502.99 ± 1,070.62 µg*h/mL, respectively. The PK parameters calculated in the present study were similar to those of a previous study.[12] Therefore, further studies will be designed for the test formulations of tegoprazan using obtained pharmacokinetic characteristics from this study.
In conclusion, this study showed that the PK parameters of the two tegoprazan formulations were comparable, and GMR (90% CIs) for Cmax and AUClast of both tegoprazan and M1 fell within the conventionally accepted bioequivalence criteria.
Go to :
 XML Download