

 PDF
PDF ePub
ePub Citation
 Print
Print


Introduction
The risk of venous thromboembolism increases in patients post-surgically, such as after hip or knee replacement, fracture surgery, or atrial fibrillation.[12] Generally, vitamin K antagonists such as warfarin, phenprocoumon, and acenocoumarol are used to prevent thromboembolism risk,[3] but they have some disadvantages. First, international normalized ratio (INR) monitoring is commonly required for patients on vitamin K antagonists because of their narrow therapeutic index.[45] Second, vitamin K antagonists have long half-lives of approximately 40 h, so anticoagulant effects remain after treatment has been discontinued.[6] Finally, vitamin K antagonists have high inter-individual variabilities according to the cytochrome P450 2C9 (CYP2C9) and vitamin K epoxide reductase 1 (VKORC1) enzyme genotypes.[789] Furthermore, dietary control is recommended such as limiting vitamin K-rich foods.[10] Novel oral anticoagulants (NOACs) such as apixaban, rivaroxaban, edoxaban, and dabigatran have been developed to overcome these disadvantages.[11] NOACs have shorter half-lives (approximately 8–15, 5–13, 6–11, and 12–14 h for apixaban, rivaroxaban, edoxaban, and dabigatran, respectively) than that of warfarin (approximately 40 h), so their anticoagulant effects are easily controlled.[41213] Furthermore, dietary limitations are not required for these drugs.[1415]
Unlike conventional anticoagulants, apixaban does not require periodic monitoring, however, it does require monitor under certain situations such as following the administration of an overdose or before surgery.[6] Generally, the chromogenic anti-Xa assay is used for monitoring apixaban concentrations clinically.[16] Specific external calibrators are required to quantify apixaban or rivaroxaban because this method was originally designed to quantify plasma heparin concentrations.[17] In addition, the sensitivities of the chromogenic assay and dilute Russell viper venom time (DRVV-T) method were 10–25 and 100–200 ng/mL, respectively.[1819] Furthermore, these methods have poor selectivity for apixaban quantification. For example, in a previous study, apixaban was even detected in the control group that was not administered an anticoagulant.[20] Therefore, more sensitive and selective analytical methods for apixaban are required for pharmacokinetic studies and effective drug concentration monitoring.
Liquid chromatography-mass spectrometry (LC-MS) is generally used for analysis in various fields and is mainly used to quantify drug concentrations clinically. Once the method is established, analytes can be rapidly analyzed daily and it has the advantage of high sensitivity.[212223] Recently, published articles suggest that analytical methods using LC-MS can be used to quantify not only apixaban but also other NOACs such as rivaroxaban simultaneously.[2124] The objective of current study was to establish a quantification method for detecting apixaban in human plasma using UPLC-MS/MS and to apply the method to a clinical studies.
Go to : 
Methods
Reagents
Apixaban and apixaban-d3 (internal standard, IS) were obtained from Toronto Research Chemicals (Ontario, Canada). Methanol, ammonium formate, and formic acid were obtained from Sigma-Aldrich (St. Louis, MO, USA) and Duksan (Korea). All reagents used in this study were either LC grade or extra-pure grade. Millipore Milli-Q system at 18.2 MΩ (Billerica, MA, USA) was used to obtain deionized water. Drug-free blank plasma containing ethylenediaminetetraacetic acid (EDTA)-K3 was bought from Biochemed (Winchester, VA, USA).
Chromatographic methods
The analysis was performed on the Acquity™ UPLC (Waters, MA, USA) and Xevo TQ-MS Triple Quadrupole Tandem Mass Spectrometer (Waters, MA, USA). The separation of apixaban in plasma was conducted using a mobile phase consisting of 2.5 mM ammonium formate (pH 3.0) (A) and 100% methanol containing 0.1% formic acid (B) on the Thermo Hypersil Gold C18 column (150 × 2.1 mm, 1.9 µm). The run time using the gradient method was 3 min. Gradient method was applied as follows: 0–0.2 min (45% A), 0.2–0.5 min (15% A), 0.5–2.0 min (15% A), 2.0–2.1 min (45% A), and 2.1–3.0 min (45% A). The flow rate was 0.35 mL/min. The column oven and autosampler temperatures were set to 40℃ and 10℃, respectively, and maintained during analysis. Mass detection was conducted on positive ionization using multiple reaction monitoring (MRM). Mass transitions were set to m/z 460.17 → 199.09 for apixaban and m/z 463.13 → 202.09 for the IS. The analyzed data were handled by Masslynx version 4.1 (Waters, MA, USA).
Stock and working solutions
Apixaban and the IS stock solution (1 mg/mL) were dissolved in 100% methanol. All of the calibration curve and quality control (QC) working solutions for apixaban were prepared by dilution using methanol. Calibration curve working solutions were prepared to 10, 20, 50, 100, 200, 500, 1000, and 5000 ng/mL. Working solutions for low, medium, high, and dilution integrity QC (LoQC, MeQC, HiQC, and DiQC, respectively) samples were prepared to 20, 150, 4,000, and 10,000 ng/mL, respectively. The IS was diluted to 1 µg/mL.
Sample preparation
The plasma completely thawed at ambient temperature (18–21℃) and was then briefly vortexed. Apixaban was extracted by protein precipitation (PP) from the plasma, and then 100 µL sample was transferred into a microcentrifuge tube to which 50 µL IS (apixaban-d3, 1 µg/mL in 100% methanol) was added. Then 450 µL of 100% methanol (3-fold volume of the sample) was added to the sample, followed by gentle vortexing for 5 min and centrifugation for 10 min at 13,000 rpm. The methanol phase was transferred into a vial for subsequent analysis.
Validation
Validation of the analytical method was performed in accordance to “Guidance for Industry Bioanalytical Method Validation” published by the US Food and Drug Administration and “Guideline on Bioanalytical Method Validation” published by the Korean Ministry of Food and Drug Safety (MFDS).[2526]
Accuracy and precision
To measure accuracy and precision, lower limit of quantification (LLOQ), LoQC, MeQC, and HiQC samples were analyzed five times within each batch (intra-batch), and consecutively analyzed for three independent batches (inter-batch). The acceptance criteria of accuracy and precision were within ± 20% for the LLOQ and ± 15% for the LoQC, MeQC, and HiQC.
Linearity and sensitivity
Calibration standards for apixaban were made by spiking the working solution into drug-free blank plasma. The calibration standards included a double blank (no apixaban or IS), blank (only IS), and eight-point samples (both apixaban and IS). Linearity was evaluated at a concentration range of 1–500 ng/mL. The coefficient of correlation (r) of linear regression was used to determine if this value was greater than 0.997.
Carry-over and matrix effect
Carry-over was performed to determine if a high concentration of sample would affect the analysis of the next sample. A volume of 1,000 ng/mL sample (upper limit of quantification, ULOQ) was injected prior to injection of the double blank sample five times. When injecting the blank sample, the peak areas of apixaban and IS were less than 20% and 5% of LLOQ, respectively. The matrix effects were performed to assess the effects of the endogenous compounds on the analysis. LoQC and HiQC samples were prepared using six different individual plasma. The matrix effect calculated the peak area ratios for the analyte and IS of six independent LoQC and HiQC samples, and evaluated whether the CV (%) was within 15%.
Extraction efficiency and dilution integrity
The assessment of extraction efficiency was performed by comparing the apixaban area ratios of samples added before and after extraction. To assess the impact of dilution on analyte quantification, the DiQC sample was diluted 1:10 and 1:50, and then the diluted samples were analyzed. The apixaban concentration in the diluted sample was back-calculated by multiplying the result by the dilution factor.
Stability
Sample stability was assessed by analyzing post-processed samples that were stored in an autosampler at 10℃ overnight. Short-term working solution and stock solution stability were assessed after the sample was kept at laboratory temperatures (18–21℃) for 10 h. We compared the apixaban peak area ratio of the sample left on the table with the newly prepared sample to obtain short-term stability. The freeze-thaw stability was measured by analyzing the apixaban concentration after repeating three cycles of freeze-thaw at −80℃ and laboratory temperature for the LoQC and HiQC samples. Reproducibility of re-injection was assessed by comparing the measured concentrations of the LoQC and HiQC samples analyzed in the previous batch with the freshly prepared QC samples. The acceptance criteria of the stability were that the percentage (%) change of the calculated concentration should be within 15% of the theoretical concentration.
Clinical study design
The clinical study was conducted at Clinical Trial Center of Konkuk University Medical Center (Seoul, South Korea) in 23 subjects who voluntarily agreed to participate. Approval of the clinical study was obtained by the Institutional Review Board of Konkuk University Medical Center (IRB No. KUH1280105). In the first period, the 23 subjects were administered a 10 mg apixaban tablet (Eliquis, BMS Pharmaceutical Korea Ltd., Seoul, South Korea) alone, followed by a wash-out period. In the second period, 16 patients were administered 10 mg apixaban with 20 mg rosuvastatin (Crestor Tab., AstraZeneca, Seoul, South Korea) and 7 were administered 10 mg apixaban and 250 mg lapatinib tablets (Tykerb Tab., Novartis Korea, Seoul, South Korea). To quantify apixaban, whole blood was collected at pre-dose (0 h) and 1, 2, 3, 4, 6, 8, 11, and 24 h after administration in EDTA-K3 tube. The plasma was isolated by centrifugation of the collected blood at 3,000 rpm for 10 min at 4℃ and transferred into microcentrifuge tubes. The plasma was stored at −70℃ until subsequent analysis.
Go to :
Results
Method development
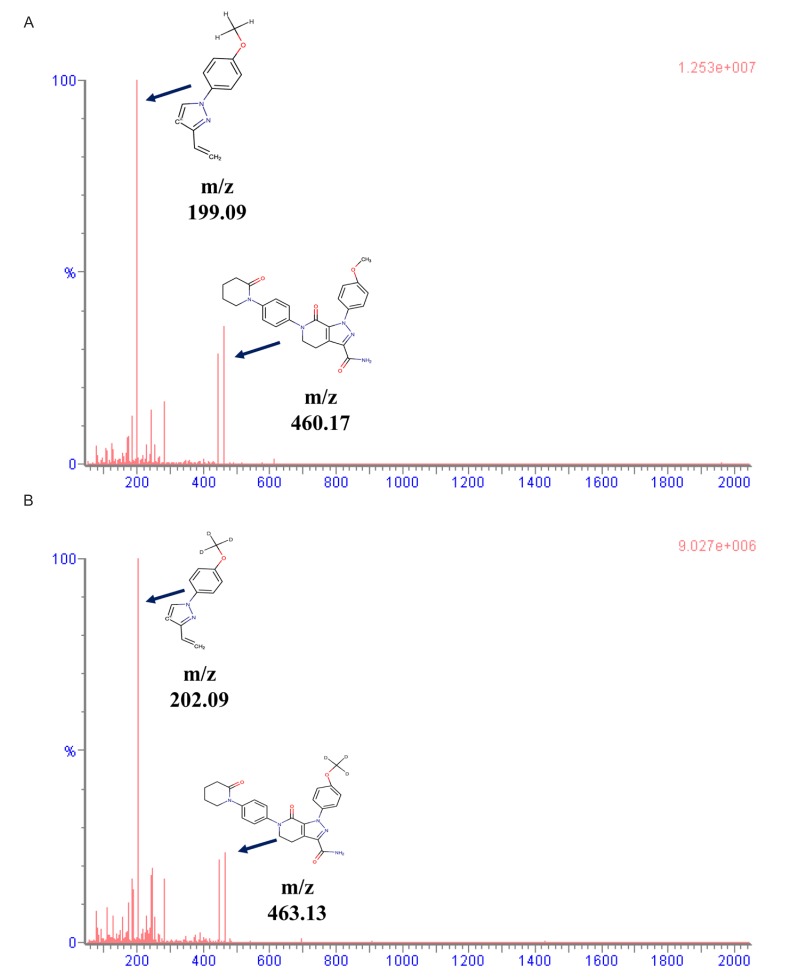
The mass spectra and chemical structures of apixaban and IS are presented in Figure 1. In the electrospray ionization (ESI) positive mode, apixaban and IS showed good responses. Isocratic and gradient methods were tested for sample separation using deionized water, 0.1% formic acid, ammonium formate solution, 100% methanol, 100% methanol containing 0.1% formic acid, 100% acetonitrile, and 100% acetonitrile containing 0.1% formic acid. The results showed that the gradient method was more appropriate than the isocratic method. The separation method was developed based on a previous report,[21] and modified with 2.5 mM ammonium formate (pH 3.0) (a) and methanol containing 0.1% formic acid (b).
Method validation
Accuracy and precision
The accuracy ranged from 94.8% to 111.4% and from 98.8% to 106.2% for the intra-batch and inter-batch, respectively. The precision range was 0.49–4.54% and 2.24–8.72% for the intra-batch and inter-batch, respectively. The accuracies and precisions of the inter-batch and intra-batch are shown in Table 1.
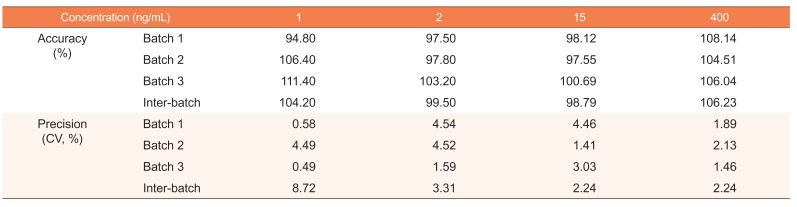
Table 1
Intra-batch and inter-batch accuracy and precision of validation batches
![]()
Linearity and sensitivity
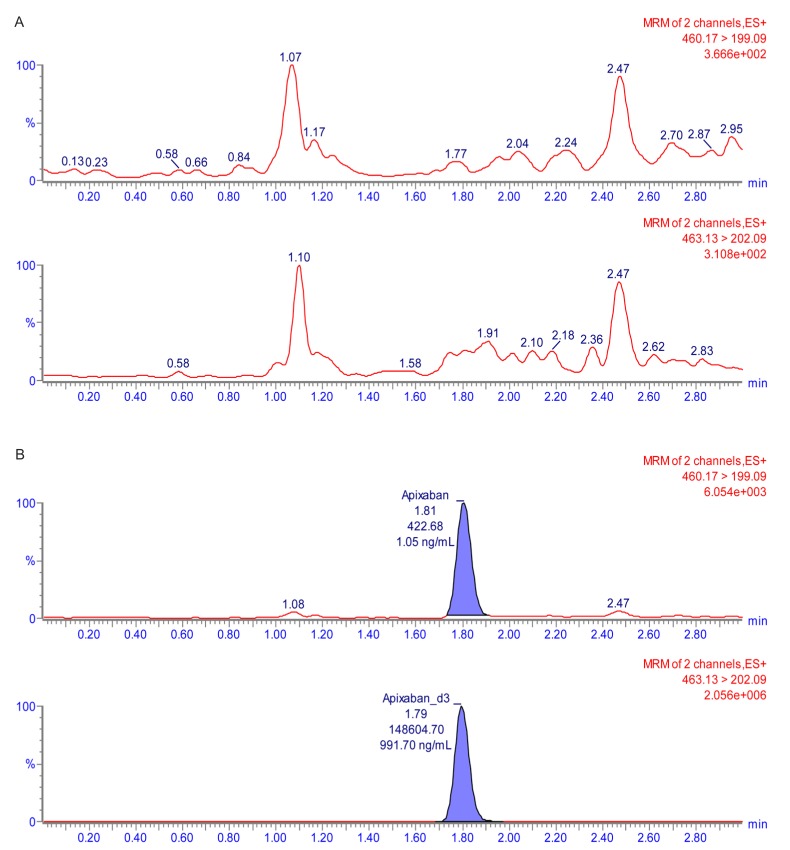
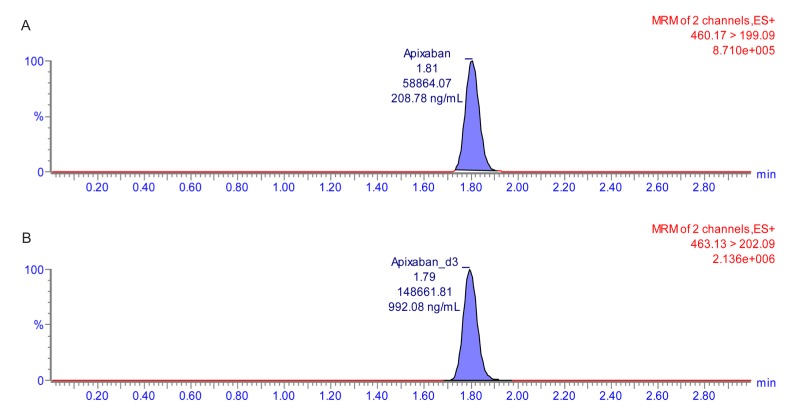
The calibration curve with a weighting factor of 1/χ2 showed good linearity ranging from 1 to 500 ng/mL (r ≥ 0.998 and r2 ≥ 0.997). In the LLOQ (1 ng/mL), signal-to-noise was >10. The double blank sample and chromatogram of the LLOQ are shown in Figure 2 and 3.
Carry-over and matrix effect
To determine the carry-over effect, the ULOQ sample (500 ng/mL) was injected and then five double blank samples were injected. The results indicated that there was no interference after injecting the double blank sample. After injecting the LoQC and HiQC samples prepared from six different individual plasma samples, the percentage coefficient of variation (% CV) for apixaban at the LoQC and HiQC were 4.08% and 2.39%, respectively. No significant matrix effect appeared in the human plasma with the LoQC and HiQC samples.
Extraction efficiency and dilution integrity
The extraction efficiency was evaluated at three QC concentrations, LoQC, MeQC, and HiQC, which showed recoveries of 16.57%, 15.24%, and 14.66%, respectively. The dilution integrity was assessed by diluting the DiQC (1,000 ng/mL) by 50- and 10-fold, respectively. The back-calculated nominal concentrations were 1042.8 and 1043.5 ng/mL for each sample. The accuracy and precision of the 50-fold dilution were 102.79–108.29% and 2.20%, respectively, and values for the 10-fold dilution were 102.33–108.67% and 2.43%, respectively. The results of the dilution integrity are presented in Table 2.
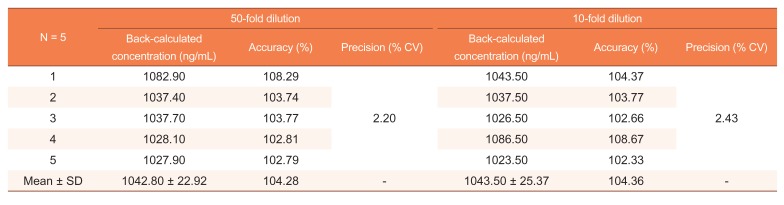
Table 2
Dilution integrity of apixaban in human blank plasma
![]()
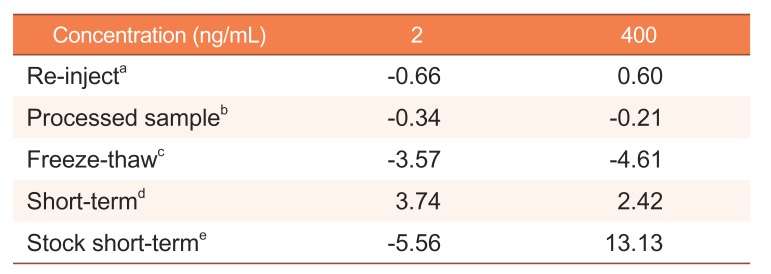
Stability
The stability of the apixaban working and stock solutions were evaluated under various conditions, and the results are presented in Table 3. The processed sample was stable for 24 h in the autosampler. The apixaban working and stock solutions were stable at laboratory temperatures for 10 h. Six LoQC and HiQC samples were within 15% of the nominal concentration change measured after three repeated freeze-thaw cycles. The re-injection change was within 15% of the nominal concentration compared with the test and reference samples. The results indicated that the developed method could be used to analyze apixaban under the investigated conditions.
Application of the analysis method to a pharmacokinetic study
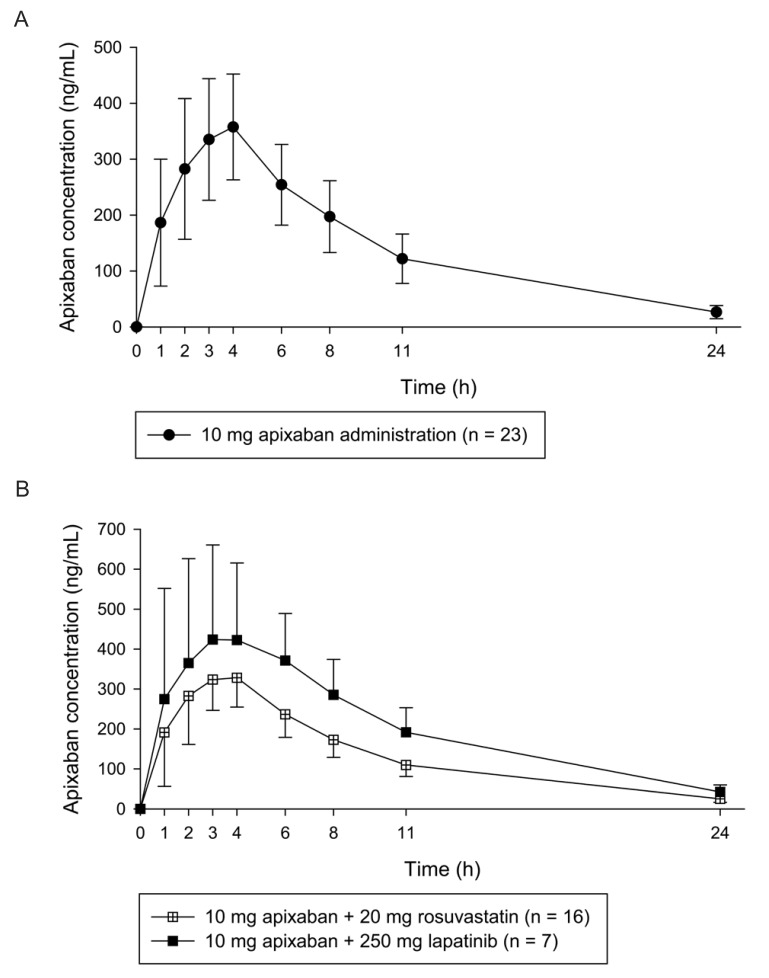
The validated analytical method was applied to quantify apixaban in a clinical study. In Figure 4, the mean plasma apixaban concentration-time profiles for each group were presented. The mean ± standard deviation (SD) values of the maximum plasma concentration (Cmax) and median (range) time to reach the Cmax (Tmax) in the 10 mg apixaban single administration group were 371.57 ± 95.23 ng/mL and 4 (1–4) h, respectively. The mean Cmax and median Tmax values of the 20 mg rosuvastatin co-administered group were 347.65 ± 73.63 ng/mL and 3 (2–4) h, respectively. The mean Cmax and median Tmax of the 250 mg lapatinib co-administered group were 529.01 ± 162.83 ng/mL and 3 (1–6) h.
Go to :
Discussion
An analytical method used for the measurement of apixaban concentration was developed and validated in this study. The percentage change in accuracy, precision, and stability under various temperature conditions in validation batches were within 15% of the nominal concentration at the LoQC, MeQC, and HiQC. Three different concentrations of QC samples did not show significant changes after repeated freeze-thaws for three cycles at −80℃, and no significant changes were observed compared with the nominal concentration even at laboratory and autosampler temperature conditions (10 and 24 h, respectively). The time-concentration profiles for apixaban were determined using the developed method. Analyte ionization was performed in the ESI positive mode according to a previous report.[2728] Comparing the positive and negative ionization mode, apixaban was detected in the positive ionization mode with high sensitivity. The mobile phases were evaluated using deionized water containing 0.1% formic acid, 2.5 mM ammonium formate (pH 3.0), methanol containing 0.1% formic acid, and acetonitrile containing 0.1% formic acid using the Thermo Hypersil Gold C18 column. Among them, 2.5 mM ammonium formate (pH 3.0) and methanol containing 0.1% formic acid (mobile phase A and B, respectively) showed the best peak shapes and excellent separation. Sample preparation using methanol showed better peak shape and reproducibility than those using acetonitrile did.
Generally, the chromogenic anti-factor Xa assay is used to quantify apixaban concentrations.[1617] The correlation of apixaban concentrations and factor-Xa activity at the therapeutic range has been shown to be linear.[29303132] The dynamic ranges for apixaban were approximately 20–500 ng/mL.[17] This method was an indirect quantification method for apixaban using factor Xa activity with residual activated factor Xa.[1829] Changes in the coagulation factor or other anticoagulants may affect apixaban quantification.[21] Chromogenic assay agents are generally stable for up to 4 months depending on the storage temperature conditions after reconstitution.[33] For example, STA®-Liquid Anti-Xa (Stago Group, France) is stable for 3 months at 2–8℃ and Technochrom® anti-Xa (DiaPharma Group, Inc., West Chester Township, OH, USA) is stable for 4 months at 2–8℃. The direct quantification of apixaban using LC-MS could solve these drawbacks, as the analysis with this technique has high sensitivity and specificity.[34] In addition, relatively flexible ranges of the calibration curve could be used according to the study specification or sample status. Chromogenic or clotting-based assays such as prothrombin time (PT), thrombin time (TT), the chromogenic factor-Xa assay, and other methods indirectly quantify coagulation activity,[21] whereas the analytical method using LC-MS enables the direct quantification of anticoagulant concentrations.[21] The other advantage of using LC-MS is that it is not affected by changes in other anticoagulants or coagulation factors. In previously reported studies, apixaban was shown to be stable at −50℃ and −80℃ for 6 and 8 months, respectively.[2732] Therefore, the analysis method using LC-MS may be useful for apixaban analysis that requires high selectivity and sensitivity such as for pharmacokinetic studies. Compared with previously reported methods,[1221283536] the concentration of apixaban analyzed within 3 min on a C18 column with reliable reproducibility (accuracy and precision were within 15% range). Sample preparation with protein precipitation (PP) was used in the current study. PP is a simple and rapid preparation method compared with solid-phase extraction (SPE) or liquid-liquid extraction (LLE).[3738] As the current method was rapid and relatively simple, it might be suitable for therapeutic monitoring or large scale sample analysis. A limitation of this study was that the method showed lower extraction efficiency than that of previous studies.[2139] The three-replicated mean extraction efficiencies were calculated to be 16.57%, 15.24%, and 14.66% for the LoQC, MeQC, and HiQC, respectively. In the other reported studies, the extraction efficiencies were 104% [21] and ranged from 101.8% to 102.7%.[39] The extraction efficiency range in this study was 82% to 84% when it was calculated using the same method as that used in previous studies.[2139] Although the extraction efficiency in this study was relatively lower than that previously reported, the relative SD (RSD) of the mean extraction efficiency was 6.5% (within 15%), indicating the reproducibility of the validation method; therefore, this method was considered reliable.
The Cmax and Tmax values were compared with other previous studies. In this study, the arithmetic mean and geometric mean ± standard deviation (SD) of Cmax were 371.57 ± 95.23 ng/mL and 358.50 ± 1.32 ng/mL, respectively. Median Tmax (range) was 4 (1–4) h. Frost, C. et al. reported the arithmetic mean ± SD of Cmax and median (range) Tmax were 176.3 ± 42 ng/mL and 3.0 (2.5–4.0) h after the single administration of apixaban 10 mg in healthy White and Black volunteers.[40] Upreti, V. V. et al. reported the geometric mean ± SD of Cmax and median Tmax (range) were 207 ± 24 ng/mL and 3.03 (2.0–6.0) h after single administration of apixaban 10 mg in healthy White, Black and Asian volunteers.[41] Moreover Cui, Y. et al. reported the geometric mean Cmax (CV) and median Tmax (min, max) were 233.9 (26) ng/mL and 3 (2, 4) h after the same dosage administration in healthy Chinese volunteers.[42] The Tmax was comparable with other reports, whereas the Cmax was higher than the compared results. Apixaban was known as primarily metabolized by CYP3A4 and is a substrate of P-gp and BCRP. Genetic polymorphism, such as the ABCB1, ABCB2 and CYP3A5 gene, affected the disposition of apixaban.[4344] Further studies with pharmacogenetics approach might be needed to identify the cause of the differences of apixaban pharmacokinetic parameters in a different population.
Go to :
Conclusions
An analytical method for the determination of apixaban was developed using UPLC-MS/MS. Previous anti-factor Xa assays indirectly measured the concentrations of apixaban. These methods were affected by changes in coagulant factors or co-administered drugs. However, the developed method using LC-MS in this study could be directly used to quantify the concentration of apixaban and had an LLOQ value of 1 ng/mL, which was lower than that of the anti-factor Xa assay method (approximately 20 ng/mL). Therefore, the LC-MS-based analytical method may be useful for pharmacokinetic studies and clinical applications.
Go to :
 XML Download